Abstract
Although persistent homology has emerged as a promising tool for the topological simplification of complex data, it is computationally intractable for large datasets. We introduce multiresolution persistent homology to handle excessively large datasets. We match the resolution with the scale of interest so as to represent large scale datasets with appropriate resolution. We utilize flexibility-rigidity index to access the topological connectivity of the data set and define a rigidity density for the filtration analysis. By appropriately tuning the resolution of the rigidity density, we are able to focus the topological lens on the scale of interest. The proposed multiresolution topological analysis is validated by a hexagonal fractal image which has three distinct scales. We further demonstrate the proposed method for extracting topological fingerprints from DNA molecules. In particular, the topological persistence of a virus capsid with 273 780 atoms is successfully analyzed which would otherwise be inaccessible to the normal point cloud method and unreliable by using coarse-grained multiscale persistent homology. The proposed method has also been successfully applied to the protein domain classification, which is the first time that persistent homology is used for practical protein domain analysis, to our knowledge. The proposed multiresolution topological method has potential applications in arbitrary data sets, such as social networks, biological networks, and graphs.
I. INTRODUCTION
Proteins are of paramount importance to living organisms. They are essential to almost all the basic functions at the cellular level, such as providing structural support, regulating signal transduction, mediating gene transcription and translation, and catalyzing metabolic reactions. It is commonly believed that protein functions are determined by protein structures, the so called structure-function relationship. However, protein structures are, in turn, determined by the protein interactions. Protein interactions are inherently of multiscale in nature, including short range covalent bonds, middle range hydrogen-bonds, dipole-dipole interactions, van der Waals interactions, and long range electrostatic interactions. Consequently, protein structures are intrinsically multiscale as well, ranging from atomic scale, residue scale, alpha helix and beta sheet scale, domain scale in a single protein to protein scale in multiprotein complexes. Geometric analysis of proteins is usually in terms of coordinates, bond length, bond angle, surface area, volume, curvature, etc., which often involve excessively high degrees of freedom and high dimensionality and can be computationally prohibitively expensive. For example, a human immunodeficiency virus (HIV) capsid has about 4.2 millions of atoms, giving rise to a problem of ℝ12600000 in the molecular mechanics. Topological analysis of proteins is typically in terms of topological invariants, namely, connected components, tunnels or rings, and cavities or voids, which are zero dimensional (0D) and seldom useful. The complexity and multiscale nature of proteins or protein complexes call for innovative strategies in protein description, representation, characterization, and analysis.
Persistent homology has been advocated as a new strategy for the topological simplification of complex data.9,11,27,41 This approach generates a family of “copies” for a given dataset through a filtration process so as to analyze their topologies and relations. These copies are made slightly different in geometry, such as a systematic increase in the radius of each sphere of point cloud data or a systematic decrease in the isovalue of volumetric data. Simplicial complexes generated by the filtration process are organized into homology groups.9,41 Persistent diagrams or barcode representation14 is introduced to record the “birth” and “death” of topological invariants, i.e., Betti numbers, of the underlying copies. As such, the filtration parameter induces a one-dimensional (1D) topological description of a given data set, in contrast to the 0D description of the traditional topology and the high dimensional description of geometry. Therefore, persistent homology bridges the gap between traditional topology and geometry. Many elegant computational algorithms have been proposed for persistent homology analysis in the literature.6,7,10,21 There is a long list of successful applications of persistent homology in a variety of fields, including data analysis,4,19,22,26,31 image analysis,3,5,12,25,29 shape recognition,8 chaotic dynamics verification,16,20 network structure,15,18,28 computer vision,29 and computational biology.13,17,39 Topological characterization identification and analysis (CIA) are some of the most successful applications of persistent homology. Indeed, persistent homology has scarcely been utilized for physical modeling and/or quantitative prediction.
Recently, we have introduced persistent homology for mathematical modeling and physical prediction of nano-particles, proteins, and other biomolecules.34,36 We have proposed molecular topological fingerprint (MTF) to reveal topology-function relationships in protein folding and protein flexibility.36 We have devised persistent homology to predict the stability of proteins36 and the curvature energies of fullerene isomers.30,34 To proactively extract desirable topological traits from complex data, we have introduced objective-oriented persistent homology based on variational principle.30 We have also developed multidimensional persistence to better analyze biomolecular data.37 We have utilized persistent homology to resolve ill-posed inverse problems in cryo-EM structural fitting.38
Figure 1 illustrates the multiscale features of a virus particle. To understand the physical and biological properties of viruses and other macromolecular complexes, we need to have appropriate multiscale and multiresolution descriptions. The Protein Data Bank (PDB) provides biomolecular structural information in a high level of detail, including atomic coordinates, observed sidechain rotamers, secondary structure assignments, as well as atomic connectivity. This type of structural data is usually known as point cloud data in persistent homology analysis. Multiscale description of biomolecules can be achieved in a variety of ways. Typically, coarse-grained methods describe biomolecules in terms of superatoms or super-particles at a given scale. There are many superatom representations, including residue based, domain based, and protein based ones. The corresponding persistent homology analysis based on the residue representation has been explored in our earlier work.36 Additionally, persistent homology analysis using protein based coarse-grained representation has been introduced in our recent work for studying multiprotein complexes.38 Nevertheless, coarse-grained persistent homology might suffer from inconsistency due to the ambiguity in choosing the coarse-grained particle.
FIG. 1.

Illustration of multiscale features in a virus capsid structure (PDB ID: 1DYL). The capsid has an icosahedral symmetry and consists of 12 pentagons and 30 hexagons. Each hexagon or pentagon encompasses a multiprotein complex with five or six protein monomers. Each protein monomer has more than a hundred amino acid residues. Each residue, in turn, has many atoms.
The direct application of persistent homology analysis to large biomolecules, such as virus capsids which typically have millions of atoms, is unfeasible at present. One of the reasons that lead to the failure is the use of a uniform resolution in the filtration and cross-scale filtration at a high resolution is prohibitively expensive in the present persistent homology algorithms. New strategy is required to use topology for dealing with excessively large datasets.
The objective of the present work is to introduce multiresolution persistent homology (MPH) for analyzing large datasets. Our basic idea is to match the scale of interest with appropriate resolution in the topological analysis. In contrast to the original persistent homology that is based on a uniform resolution of the point cloud data over the filtration domain, the proposed MPH provides a mathematical microscopy of the topology at various scales through an adjustable resolution parameter. In spirit of wavelet multiresolution analysis, resolution based continuous coarse-grained representations are constructed for complex data sets. MPH can be employed to capture the topology of a given geometric scale and applied as a topological focus of lens. MPH becomes powerful when it is used in conjugation with the data that have a multiscale nature. For example, one can use MPH to extract the topological fingerprints of a multiprotein complex either at its atomic scale, residue scale, alpha helix and beta sheet scale, and domain scale or at the protein scale.
The rest of this paper is organized as the follows. In Section II, we introduce multiresolution persistent homology. The underpinning multiresolution geometric modeling is accomplished by generalizing a flexibility rigidity index (FRI) method23,24,35 originally introduced for biomolecular data to general data. We design a hexagonal fractal image to demonstrate the multiresolution analysis and investigate associated multiresolution topological persistence. In Section III, we explore multiresolution topological fingerprints of images and biomolecules. We reveal the close relationship between multiresolution geometry and multiresolution topology. We show that the FRI method provides a unified framework for both multiresolution geometric representation and multiresolution topological analysis. This paper ends with a conclusion.
II. METHOD AND ALGORITHM
In this section, we introduce the theory and algorithm of multiresolution geometric analysis and multiresolution persistent homology. We construct the multiresolution geometric representation by using the FRI method,23,24,35 which converts the point cloud data into a matrix or a density map. The conversion is modulated by a resolution parameter, which enables us to facilitate the multiresolution analysis of complex data. Additionally, FRI provides a resolution-controlled statistical average of general data. The multiresolution topological analysis is developed based on the multiresolution representation of original data. To demonstrate the utility and examine validity of the proposed multiresolution geometric and topological methods, we design a hexagonal fractal image with three distinct scales. We show that the proposed multiresolution persistent homology is able to extract the topological information at each of the three scales. Therefore, the proposed topological method provides a topological microscopy of multiscale data at a desirable scale.
A. Multiresolution geometric analysis
FRI23,24,35 was originally invented for the flexibility analysis of biomolecules. It provides an excellent prediction of macromolecular Debye-Waller factors or B-factors. The essential idea of FRI is to construct flexibility index and rigidity index by certain kernel functions and further use them to describe the topological connectivity of protein structures. In the present work, we generalize the FRI method for characterizing the rigidity and flexibility of arbitrary data sets, such as networks, graphs, etc. The generalized FRI method facilitates the multiresolution geometric description of biomolecules, images, and volumetric data in general.
Assume that a data set has a total N entries, which can be atoms, pixels, or voxels with generalized coordinates r1, r2, …, rN. In general, the rigidity index of the ith entry can be expressed as
| (1) |
where rij = ‖ri − rj‖ is the generalized distance between the ith and jth entries, wj is a weight, which can be the element number of jth atom for biomolecules such as protein, DNA, and RNA, and Φ(rij; ηj) is a real-valued monotonically decreasing correlation function or probability density estimator32 satisfying the following admissibility conditions:
| (2) |
| (3) |
Here, ηj > 0 is a resolution parameter that can be adjusted to achieve the desirable resolution for a given scale. Delta sequence kernels of the positive type discussed in an earlier work32 are admissible correlation functions or kernels. Commonly used correlation functions are generalized exponential functions
| (4) |
or generalized Lorentz functions
| (5) |
Note that, in these functions, the larger the ηj value, the lower the resolution is. The flexibility index of the data set at the ith entry is defined as the inverse of the rigidity index
| (6) |
Although the generalized distance ‖ri − rj‖ can be regarded as the Euclidean space distance for biomolecular atoms, it is more generally defined in the present analysis, such as the distance between biological species or other entities. Therefore, the rigidity index and flexibility index are generalized concepts for arbitrary data sets, such as social networks, biological networks, and graphs in the present formulation.
Flexibility index and rigidity index can be easily extended to more general volumetric flexibility and rigidity functions. The rigidity function of the data can be expressed as
| (7) |
and the flexibility function of the data can be given as
| (8) |
The rigidity function can be regarded as the density distribution of a macromolecule, a picture, or volumetric data. Therefore, it provides an analytical representation of a data structure in ℝ3. More importantly, the resolution parameter in the rigidity function, i.e., ηj, enables us to represent the data at the scale of interest. One can set ηj to a common constant η for all atoms or data entries. If atoms in a biomolecular complex are classified into subsets {αk} according to residues, alpha helices, beta strands, domains, or proteins, one can also represent each subset of atoms at a different resolution ηαk. Similarly, one can choose ηαk for subset ηαk according to other physical traits in general data. Therefore, the resolution parameter ηj offers two types of multiresolution representations: multiple common resolutions (η) and a simultaneous multiresolution {ηαk}.
Since rigidity function gives rise to the density distribution of a macromolecule or general data, the morphology of the macromolecule or data can be visualized at either a common resolution η or a set of resolutions {ηαk}. Obviously, the commonly used Gaussian surface40 is a special case of the present multiresolution geometric model. Figure 2 illustrates the multiresolution analysis of a hexagonal fractal image generated by rigidity function μ(r) at various resolutions η. It can be seen that rigidity functions give rise to a series of multiresolution geometric representations, focusing on different length scales of the original hexagonal fractal image. State differently, varying the resolution enables us to highlight the scale of interest. Additionally, the present multiresolution geometric model provides a basis for multiresolution persistent homology analysis.
FIG. 2.
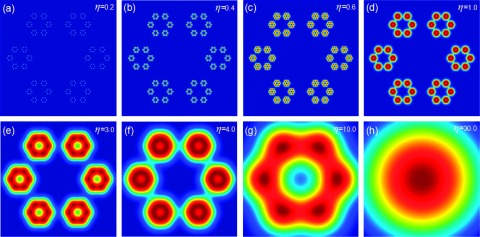
Illustration of multiresolution geometric analysis of a 2D hexagonal fractal image. The rigidity functions μ(r) are constructed from various resolution (η) values.
B. Multiresolution topological analysis
To generate a persistent homology analysis, a filtration process is used to construct a family of objects with different parametrizations. For point cloud data, the radius based filtration is most commonly employed. In this method, one associates each point with a ball whose radius is ever-increasing. When these balls gradually overlap with each other, simplicial complexes which are topological spaces are constructed by connecting corresponding points, line segments, triangles, and their high dimensional counterparts. There are various ways to decide which sets of points are to be connected at each radius. Among them, Vietoris-Rips complex (or Rips complex), in which a simplex is generated if the largest distance between any of its vertices is at most two times the ball radius, is most frequently used. As the radius increases, the previously formed simplicial complexes will be included into latter ones and a filtration process is thus created. In this manner, topological invariants that arise and perish in this series of simplicial complexes are measured by their persistent time and visualized through a barcode representation. Sometimes, another representation called persistent Betti number (PBN) is used. Basically, PBN is the histogram of the total number of topological invariants over the filtration parameter.
The radius based filtration provides an efficient approach for the persistent homology analysis of point cloud data of relatively small data sets. However, it fails to capture two types of important physical properties of biomolecules. First, the information about element type, such as hydrogen (H), carbon (C), oxygen (O), nitrogen (N), phosphorous (P), and sulfur (S), is missing in the normal point cloud representation. The difference in elements has a dramatic impact to chemical and physical behaviors. Additionally, radius based filtrations typically utilize a uniform resolution of the point cloud data over the full filtration domain, which is computationally expensive and requires huge memories for large biomolecules. State differently, it usually fails to capture the topological properties at large or global scales as the number of the constructed simplicial complexes grows exponentially. Moreover, such a description at a uniform resolution does not allow us to emphasize the topology at a given scale or study the topology with mixed scales for different parts.
We propose the MPH based on the FRI method. Specifically, we construct a matrix based on the FRI correlation function
| (9) |
where wmax is the largest element number in the biomolecule or the largest weight in the data set, and 0 ≤ Mij ≤ 1. Obviously, Mij can be viewed as the connectivity between the ith and jth atoms or entries. The smaller the Mij value is, the closer distance between the ith and jth entries is. A filtration over matrix (Mij) values can be constructed. Although a similar matrix based filtration method was introduced in our earlier work,35 the multiresolution property based on the resolution parameter ηj has never been explored. Compared with the radius based filtration, the FRI matrix based filtration incorporates appropriate resolution ηj into the simplicial complex generation and can be used to highlight the topology at a given scale of interest. In this work, we set ηj = η.
Another multiresolution filtration can be constructed based on a series of isovalues of the rigidity function volumetric data (μ(r)) shown in Eq. (7). Unlike the commonly used point cloud representation, rigidity function incorporates the information of atomic types and the resolution matching the desirable scale. In this manner, a multiresolution geometric representation can be obtained. By varying the resolution, our model can pinpoint to the local atomic detail or focus on global protein configuration. State differently, we can focus the lens on biomolecular traits of different scales, such as atom, residue, secondary-structure, domain, protein complex, and organelle. More importantly, the persistent homology analysis is employed in this multiresolution model to deliver a full “spectrum” of topological characterization of the system. From the generated barcodes, a series of topological fingerprints from various scales are obtained.
C. Validation with a hexagonal fractal image
1. Multiresolution geometric analysis of the hexagonal fractal image
To demonstrate the proposed multiresolution geometric analysis and associated multiresolution topological analysis, we design a two-dimensional (2D) hexagonal fractal image as depicted in Figure 2. This structure is constructed by replacing each hexagonal vertex with a smaller hexagon. The coordinates of largest hexagon are set to (, 10), (), (0.0, 20), (0.0, − 20), (, 10), and (). The computational domain Ω is set to Ω = [ − 30, 30] × [ − 30, 30], and the grid spacing is chosen as 0.05 in order to capture all the local details in the structure. It is easy to see that the length of the edge is 20. These nodes are then used as centers for second-level hexagonal structures. The edge length of these hexagons is 0.25 times of the original edge length (i.e., 5). By removing all the nodes of the original hexagon, we have totally 36 new nodes and 6 smaller hexagons in our second level structure. By repeating this process again, i.e., replacing each node in the second-level hexagons with a third-level hexagonal structure, setting the edge length to be 0.25 times of the second level edge length (i.e., 1.25), and removing all the second level nodes, we arrive at our final hexagonal fractal image with 216 nodes in 36 third-level hexagons.
The FRI based multiresolution analysis of the hexagonal fractal image is depicted in Figure 2. Obviously, there are three scales in the fractal image. The smallest scale is better resolved at a resolution around 0.4. The middle scale, which shows six hexagons, is reflected at resolution of 1.0-3.0. At the large scale, there is only one hexagon which is better represented at the resolution of 4.0.
2. Topological fingerprint of the hexagonal fractal image
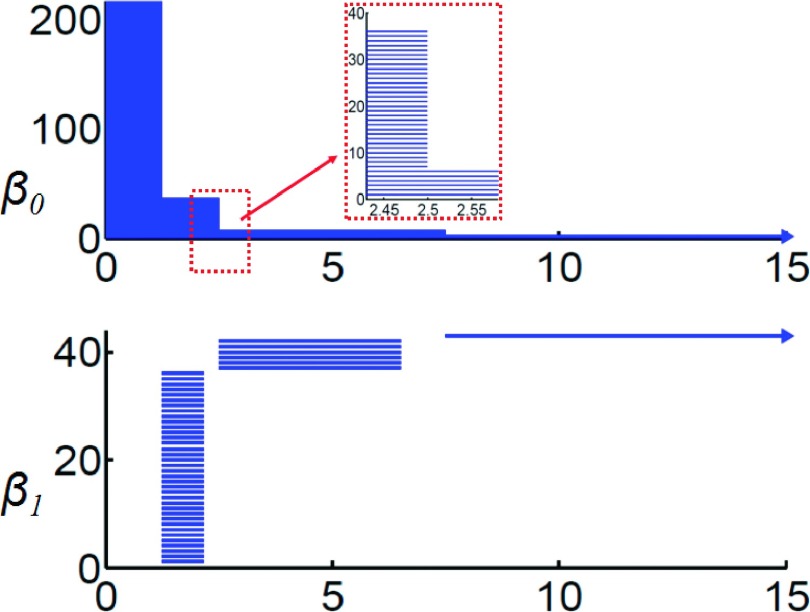
Typically, barcodes are obtained from persistent homology analysis. In our study, we arrange the barcodes in a sequence according to their birth time. The resulting barcode pattern for a given data set is called a topological fingerprint, which can be used to identify the data set. The topological fingerprint of the hexagonal fractal image can be obtained from persistent homology analysis. Figure 3 demonstrates the persistent barcodes of the hexagonal fractal generated by the radius filtration. The upper and lower panels are barcode representations of β0 and β1, respectively. For all our persistent barcodes, the horizontal axis is filtration parameter, i.e., either the radius (Å) or the rescaled density value.
FIG. 3.
Topological fingerprints of a hexagonal fractal image. Top and bottom panels are for β0 and β1 barcodes, respectively. The horizontal axis is the filtration parameter, i.e., radius. Note the separation of ring structures in the β1 barcode.
Topologically, β0 is for isolated components and β1 represents one-dimensional loops or rings. It is seen that originally there are 216 β0 bars, corresponding to 216 nodes in the hexagonal fractal. When filtration size goes to 1.25, most of these β0 bars are simultaneously killed and the total number of isolated components reduces to 36. This means that 1-simplexes (edges) begin to form between adjacent 0-simplexes (nodes) in the related Vietoris-Rips complex, eliminating isolated components. Meanwhile, 36 individual β1 bars, i.e., 36 hexagonal rings, emerge simultaneously. With the advance of the filtration, the PBNs of β0 bars undergo two further reductions. First, PBN descends to 6 at 2.5 and to 1 at 7.5. While two types of larger scaled β1 bars have been generated. From a topological point of view, the detailed small-scale structures are removed by the creation of 2-simplexes, and at the same time higher level structures appear when more connections (1-simplexes) are established. In general, it is seen that all three levels of hexagonal structures are captured in both β0 and β1 bars. All of these identical bars form a unique topological pattern which is directly related to their structure properties and thus is called a topological fingerprint for the fractal image.
3. Multiresolution topological analysis of the hexagonal fractal image
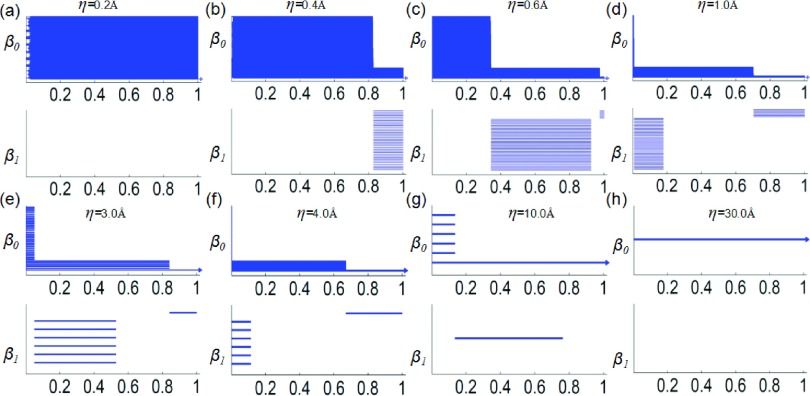
To generate a multiresolution topological analysis of the multiscale hexagonal fractal image, we use the exponential function with κ = 2 and systematically changes the resolution η. To avoid confusion, we linearly rescale all the rigidity function values to the region [0, 1] using formula
| (10) |
where μ(r) and μs(r) are the original and rescaled rigidity density value, respectively. Here, μmax is the largest density value in the original data. The rescaled density value is then used as the filtration parameter. Figure 4 depicts the multiresolution topological analysis of the hexagonal fractal image. Clearly, at the resolution of 0.2, the topology is a set of 216 isolated nodes. At the resolution of 0.4, the topology shows the formation of 36 small hexagons from 216 nodes. At the resolution of 3.0, each small-scale hexagon becomes a “superatom.” Only the middle-scale topological features appear, namely, the formation of 6 middle-scale hexagons from 36 “superatoms.” One can also see the formation of a large ring from 6 middle-scale hexagons. At the resolution of 10.0, no detailed topological structure of the six middle scale hexagons is visible. The topology shows the formation of the large-scale ring from 6 “superatoms.” At the lowest resolution of 30.0, all of the 216 nodes are topologically equivalent to a superdot and there is no ring structure at all. It is seen that the varying of the resolution gives rise to a series of topological representations of the original structure at various scales. State differently, the proposed multiresolution persistent homology provides an adjustable “topological lens” and enables us to focus on any scale of interest.
FIG. 4.
Multiresolution persistence of the hexagonal fractal image. Top and bottom panels are for β0 and β1 barcodes, respectively. The horizontal axes denote the rescaled rigidity density value. The topological fingerprints at different scales can be identified.
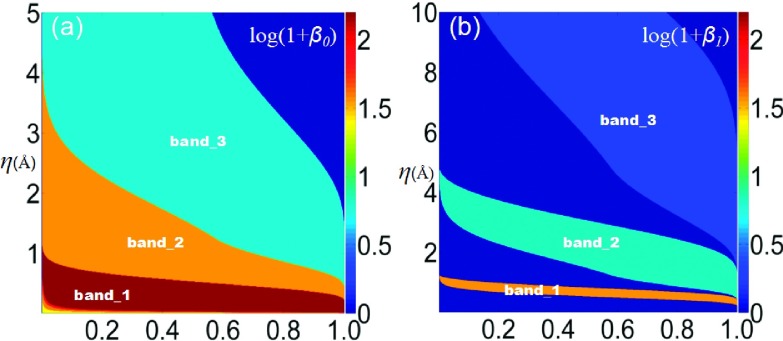
The multiscale nature of the resolution parameter can be more clearly seen in a multi-dimensional filtration process. Figure 5 demonstrates the PBNs under various resolution values. The horizontal axes represent the rescaled rigidity density value, and the vertical axes are the resolution. The color bar indicates the common logarithm (logarithm with base 10) of the PBN values. It should be noticed that in order to avoid the situation of log10(0), we systematically increase all the PBNs by one in both β0 and β1 plots. As demonstrated in Figure 5, there exist three bands in both β0 and β1 plots. Each band represents a scale in the structure, capturing the essential multiscale topological properties of the hexagonal fractal image.
FIG. 5.
Illustration of 2D persistent homology in terms of PBNs for the hexagonal fractal image. The horizontal axes denote the rescaled rigidity density value, and the vertical axes represent the resolution η. The logarithm of PBNs for β0 and β1 is plotted in (a) and (b), respectively. Three large bands in both β0 and β1 indicate three distinguished scales of the fractal topology.
III. MULTISCALE MULTIRESOLUTION TOPOLOGICAL ANALYSIS OF BIOMOLECULES
In this section, we illustrate how to employ the proposed multiresolution topological analysis for the study of biomolecular data. We first use a DNA structure to demonstrate multiscale geometric analysis generated at two atomic scale representations and one coarse-grained (nucleic acid) representation in terms of phosphorus atoms. The associated topological analysis provides topological fingerprints for biomolecules at different scales. We further illustrate multiresolution geometric and topological analysis of biomolecular data. Specifically, we construct biomolecules at various FRI resolutions using the rigidity function in our FRI method. The rigidity density, i.e., volumetric profile of the rigidity function, is used to create multiresolution topological analysis by varying the resolution η. Finally, we apply the present multiresolution persistent homology to protein domain classification. We show that at appropriate resolutions, the β0 invariants indicate the separation of domains.
A. Multiscale topological analysis of biomolecules
As discussed earlier, macromolecules are intrinsically multiscale. On the one hand, persistent homology analysis of macromolecular data gives rise to multiscale persistence. On the other hand, the multiscale nature of macromolecules allows us to carry out the persistent homology analysis at different scales. For example, multiprotein complexes can be represented at a variety of scales, including atomic scale, residue scale, domain scale, and protein scale. The different representations of a multiprotein complex lead to different topological fingerprints and associated topological interpretations.
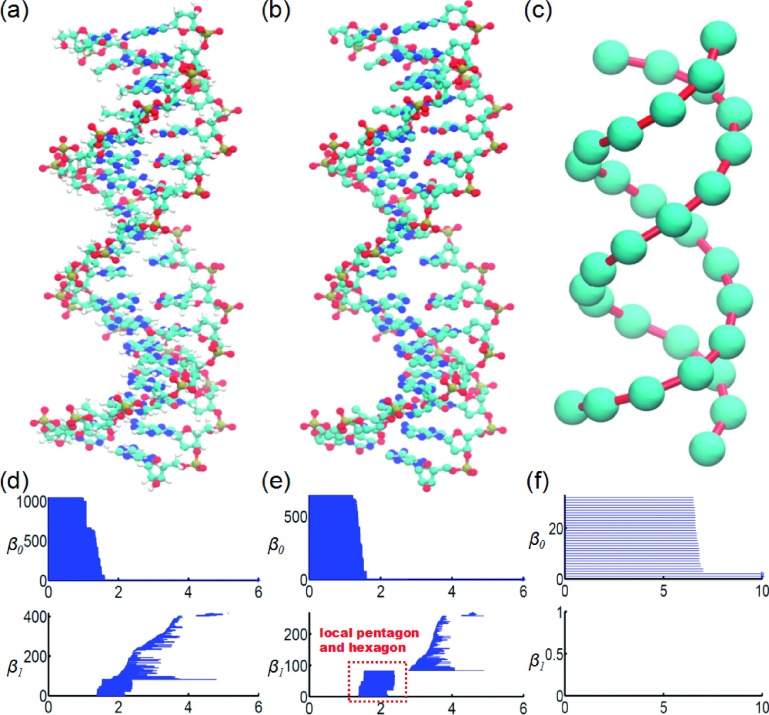
Figure 6 illustrates a multiscale persistent homology analysis of a DNA molecule (PDB ID: 2M54). The DNA molecule is described in all-atom representation (Figure 6(a)), all-atom representation without hydrogen atoms (Figure 6(b)), and coarse-grained phosphorous representation (Figure 6(c)). The corresponding topological fingerprints shown in Figures 6(e) and 6(f) are dramatically different. The building blocks of nucleotides include nitrogenous base, five-carbon sugar, and phosphate group. The five-carbon sugar has a pentagonal ring (PR) and the nitrogenous base has either a hexagonal ring (HR) or one HR and one PR. It can be seen that these local structural details are well-resolved in the topological fingerprint computed from our hydrogen-free all-atom data as indicated in Figure 6(e). The signatures of HR and PR appear around 2.0 Å, which is very similar to PRs and HRs in protein molecules,36 indicating they are consistent in all biomolecular structures. The selection of coarse-grained DNA models is very subtle. In our case, a phosphorous atom is chosen to generate a representation of a nucleotide. In this manner, only the two strand backbones are preserved, which are represented by two long persisting bars in β0. There is no ring formation or β1 bar in the coarse-grained topology.
FIG. 6.
Multiscale analysis of DNA molecule (PDB ID: 2M54). (a)-(c) Multiscale geometric analysis of the DNA molecule in all-atom representation, all-atom representation without hydrogen atoms, and coarse-grained representation (using phosphorous atoms), respectively; (d)-(f) corresponding persistent barcodes for the above three representations. Top and bottom panels are for β0 and β1 barcodes, respectively. The horizontal axes denote the filtration parameter, i.e., radius (Å). In all-atom representation, nearly half of the β0 bars end around 1.2 Å in (d). With the removal of the hydrogen atoms, local topological invariants representing hexagonal and pentagonal rings are clearly separated from the global topological structures in (e). The dimensionality reduction with the coarse-grained model displays not only the signature of phosphorous atoms but also the double string structure in (f).
For multiprotein complexes, such as viruses and microtubules, it is computationally too expensive to directly compute the full spectrum of topological fingerprints in the atomic scale. Multiscale persistent homology based coarse-grained residue or protein representations provide a potential solution to this problem. However, one always faces a difficulty as to how to select representative superatoms for the given atomistic data. Different choices lead to dramatically different topological fingerprints. Large topological errors can be generated by using undesirable superatoms. These issues highlight the problematic nature of multiscale persistent homology method.
The multiresolution persistent homology proposed in this work by-passes such a difficulty. It effectively provides a coarse-grained representation at a large scale. However, unlike the aforementioned superatom-based coarse-grained representation, the present resolution based coarse-grained method provides a faithful representation of the original geometry.
B. Multiresolution topological analysis of biomolecules
It is well known that in biomolecules, there are various types of atoms, H, C, O, N, P, S, etc., with a wide range of element numbers. As discussed in Section II B, traditional point cloud representation does not discriminate these chemical elements and treats them equally. Our FRI based density model can automatically take the element information into consideration. More importantly, the resolution can be controlled to match the scale of interest. This enables us to tackle the topology of macromolecules at large scales that are intractable with the current point cloud approaches. In this section, we apply multiresolution persistent homology to two biomolecular systems, i.e., a complex DNA structure and a virus capsid structure. In both cases, we use the exponential function with κ = 2 as the FRI kernel.
1. A complex DNA structure
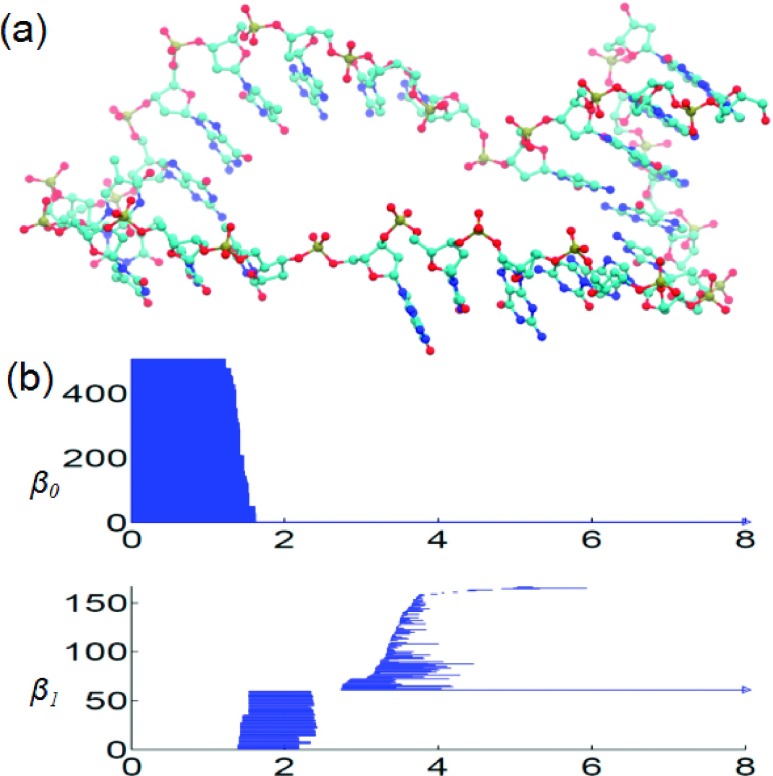
We present a multiresolution topology analysis for a complex DNA segment extracted from PDB 1SLS. In the original PDB structural file, there are 9 frames, with each frame in a pseudosquare knot configuration. A complex multiscale DNA structure can be obtained by extracting chain A from the first frame and removing its all hydrogen atoms. Figure 7 depicts the basic structure and its persistent barcodes generated from point cloud data. Note that the deletion of hydrogen atoms facilitates the separation of local and global barcodes. In fact, the local barcodes, representing the pentagon and hexagon rings, last from around 1.3 to 2.5 Å in the β1 panel. The global topological invariants come much later in the filtration process. Moreover, a long-persisting β1 bar, which persists even over filtration size 8.0 Å, reveals the global topological invariant in the DNA structure, i.e., a large loop formed by the backbone of this special DNA segment.
FIG. 7.
Geometric and topological analysis of a DNA segment (PDB ID: 1SLS). (a) The atom-bond representation reveals the local nucleotide information as well as the global loop backbone structure. (b) The persistent barcodes for the DNA segment. The horizontal axis denotes the filtration parameter, i.e., radius (Å). Hydrogen atoms are excluded. Local pentagon and hexagon rings from nucleotide bases and sugars, and global helix strips appear in two different domains in the β1 panel.
In our DNA segment structure, remarkably different scales, including those of atoms, sugar rings, nitrogenous base rings, inter-nucleic acid structures and backbone structures, exist simultaneously. To reveal these multiscale properties, we construct a FRI based density function and perform our MPH analysis. The rigidity function is of essential importance. On the one hand, it captures the atomic scale information through weight coefficients. Normally, we set wj as jth particle’s element number. On the other hand, the resolution parameter η is systematically changed to cover a full “spectrum” of geometric resolution. For this special DNA structure, we vary the parameter from 0.2 to 4.0 Å. Once the density maps are obtained, we linearly rescale them to the range of [0, 1] using Eq. (10), so that we can observe and compare the scales and their evolution in the series of barcodes. Computationally, a grid spacing of 0.2 Å is used as a smaller grid spacing can be prohibitively expensive. However, it should be noticed that a large grid spacing cannot match with high resolution, as the local structures will not be fully represented and may even appear as noise in the data. Therefore, in our MPH analysis, all the bars with persistent length less than 0.05 are regarded as unreliable results and are removed from the barcode representation.
Rigidity density isosurfaces at various resolutions provide a vivid illustration of the multiscale geometric model. Figure 8 demonstrates four DNA isosurfaces from rigidity density maps at resolutions η = 0.5, 1.0, 2.0, and 4.0 Å, respectively. Note that the representative isosurface is extracted from about the middle value of the density map. It can be seen that the dominated scales of these representative isosurfaces gradually shift from the local type, i.e., atoms in Fig. 8(a), sugar rings, and nitrogenous base rings in Fig. 8(b) to the global type, i.e., inter-nucleic acid structures in Fig. 8(c) and the backbone structure in Fig. 8(d). This shift of scales controlled by the resolution parameter can be more quantitatively characterized with our MPH analysis.
FIG. 8.
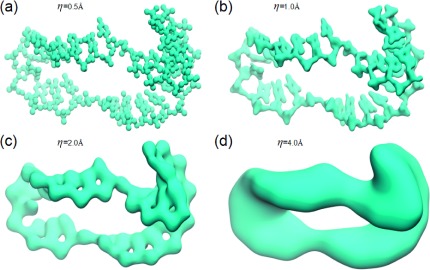
Multiresolution geometric analysis of a complex DNA segment from 1SLS. The surfaces are extracted from representative isovalues. It can be seen that, from (a) to (d), there is a very consistent shift in scale from local ones to global ones, namely, from atomic feature in (a), sugar rings, and nitrogenous base rings (b), to inter-nucleic acid characteristics in (c) and backbone traits in (d). This multiscale nature is well-captured in our MPH analysis as demonstrated in the barcodes in Figure 9.
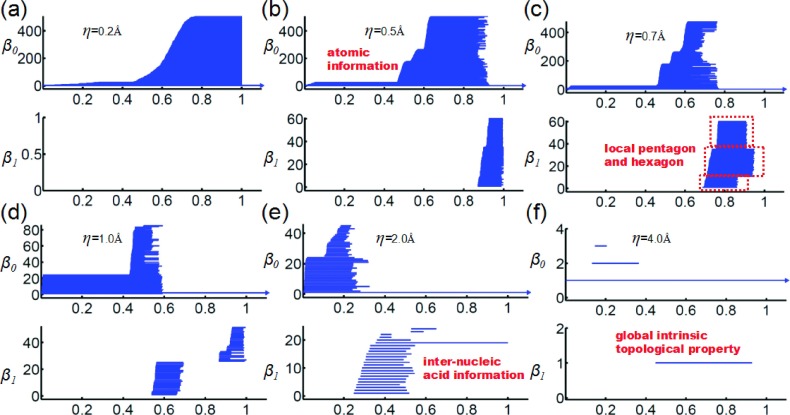
The essence of our multiresolution persistent homology analysis is to describe our multiscale geometric model in a topological representation, i.e., in barcodes or/and persistent Betti numbers. To illustrate our idea, we systematically change η from 0.2 Å to 4.0 Å and select six representative resolutions, i.e., η = 0.2, 0.5, 0.7, 1.0, 2.0, and 4.0 Å, to perform MPH analysis. It can be observed that in Fig. 9(a), when η is around 0.2 Å, the atomic scale detail dominates. There are 507 β0 bars, representing 507 individual atoms. Not all of β0 bars have the same lengths. A group of 24 bars emerges much earlier in the filtration, representing 24 phosphorus atoms that have the largest element number. However, due to the limited grid resolution at the grid spacing of 0.2 Å, many details of the atom types are not well captured and we cannot distinguish other types of atoms. With the decrease of the resolution in Figs. 9(b) and 9(c), more atomic information reveals and we can distinguish all other three types of atoms, i.e., 153 oxygen atoms, 87 nitrogen atoms, and 243 carbon atoms. More importantly, local ring structures begin to appear and gradually dominate. With a suitable resolution as in Fig. 9(c), we can even clearly identify the three types of rings in β1 bars. Based on the death time, these 60 β1 bars can be divided into three groups, i.e., 35 pentagon rings from five-carbon sugars, 35 hexagon rings from nitrogenous bases, and 10 pentagon ring from nitrogenous bases, from the top to the bottom. Inter-nucleic acid structures begin to appear with further increase of η value as demonstrated in Figs. 9(d) and 9(e). Local ring structures gradually fade away from the barcodes. Finally, when η is increased to 4.0 Å, only the global loop formed by the backbone of the DNA segment remains.
FIG. 9.
Multiresolution persistent homology analysis of a DNA segment from 1SLS. It can be observed that at the highest resolution (0.2 Å), only the atomic information is observed as in (a). Local pentagon and hexagon ring structures start to appear in (b) and (c) when resolution decreases. Inter-nucleic acid structures emerge and gradually dominate the barcodes if η exceeds 1.0 Å. Further increase in resolution values eliminates most transitional local and global topological invariants, leaving the largest loop as demonstrated in (f). One can expect that the DNA molecule will evolve into a feature-less sphere if resolution parameter reaches a certain limit.
2. A virus capsid structure
The virus capsid structure of 1DYL shown in Figure 1 has multiple scales, ranging from atomic, residual, protein scales to pentagonal or hexagonal protein complex scales. There are 5705 atoms in each of 12 pentagon-shaped complexes and 6844 atoms in each of 30 hexagon-shaped complexes, leading to a total of 273 780 atoms in capsid. Computationally, it is prohibitively expensive to incorporate all the scales in a uniform topological representation.
In the construction of rigidity density maps, we incorporate atom type information by the association of weight parameters wj with the atomic element number. We set the grid size to be 2.0 Å to generate density map for the virus, although a finer grid size of 0.6 Å has been used for constructing the density maps of a single pentagon-shaped or a single hexagon-shaped protein complex as shown in our supplementary material.1 We also linearly rescale all the generated density maps to the range of [0, 1] using Eq. (10) and remove the bars with length less than 0.05 in barcodes. Note that PDB provides the structure information for a single protein and related symmetry operations. Therefore, pentagon-shaped protein complexes and pentagon-shaped protein complexes, as well as the virus capsid, are all constructed using the symmetry information in the PDB for protein 1DYL.
For the virus capsid structure, the topology at the multiprotein scale reflects 12 pentagons and 30 hexagons. There are about 20 triangle circles formed between pentagon rings and hexagon rings. Each of these triangle circles can evolve into 4 smaller circles in different rigidity density isosurfaces when suitable resolutions are employed. All the above information can be derived from the careful observation of β1 panels in Figure 10. Especially, in Figures 10(g) and 10(h), we can see that 12 β1 bars emerge first during the density filtration. Additionally, there are 30 long persisting bars in the β1 panels due to 30 hexagonal rings. Furthermore, there are 19 short bars, which are originated from 20 triangle circles, as the whole surface is connected and one β1 bar is removed. Finally, the 60 more β1 bars are added as each triangle transforms into 4 circles. It is interesting to analyze β0 barcodes as well. In Figures 10(g) and 10(h), there are roughly three sets of 60 β0 bars appearing according to their generation time during the filtration process. From the above analysis, we know that 12 pentagon complexes contribute 60 identical β0 bars. Due to the dimerization, 30 hexagons complexes contribute two types of β0 bars, each having 60 bars. Furthermore, from the birth and death time of the first and second sets of β0 bars, we can tell that the only the second set of 60 β0 bars is due to the pentagon protein complexes, as 12 β1 bars appear at exactly the same time.
FIG. 10.
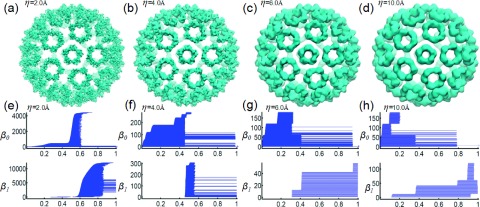
Multiresolution analysis of virus capsid structure generated from protein 1DYL. It can be seen from (e) and (f) that topological invariants generated from the structure details within the protein are captured. Small scale topological details quickly disappear as the resolution parameter increases. Instead global topological invariants that capture the loops within or between protein-protein complex appear. In (g), at the beginning of the filtration, 12 long and 30 short β1 bars can be identified, which indicates 12 pentagon rings and 30 hexagon rings in the multiprotein complex. Later, 19 more β1 bars emerge, corresponding to 20 loops formed between hexagon and pentagon protein complexes, with 1 loop being left uncounted because of a sphere-like surface.34 The 20 loops further evolve into 80 loops as demonstrated in (h). For the reason stated above, one loop is not accounted. More interestingly, by examining birth and death times during the filtration, when β1 bars emerge and β0 bars disappear in (g) and (h), one can find that hexagonal protein complexes contribute the first 60 β0 bars. Only after a short while during the filtration, the second 60 β0 bars from the pentagonal protein complexes appear. Finally, the third 60 β0 bars come out. They are from the short bars in hexagonal protein complexes as shown in the supplementary material.1
Figure 11 shows 2D persistence in the virus capsid structure. The density profiles are generated using the pdb2vol module in software Situs.33 The Gaussian kernel is used and the resolution parameter is defined in the region [5 Å, 65 Å]. We use grid spacing 1.5 Å. The PBN diagram demonstrates the multiscale properties within the protein.
FIG. 11.

2D persistent homology analysis of virus capsid structure generated from protein 1DYL. (a)-(c) The logarithm plots of 2D persistent barcode numbers for β0, β1, and β2, respectively. The horizontal axes denote the rescaled rigidity density value. Vertical axes are resolution η (Å).
C. Multiresolution topology based protein domain classification
A protein domain is a relatively conserved part of a protein structure and has its own independent functions and structural shape. Protein domains serve as main building blocks for many large proteins and play an important role in protein design. For a given protein, identification and classification of protein domains is a crucial task. Gaussian network model (GNM),2 FRI, and graph theory can be used for protein domain analysis. In this work, we illustrate the use of the proposed multiresolution persistent homology for protein domain classification, together with two other methods. To our knowledge, it is the first time that persistent homology is used for practical protein domain identification.
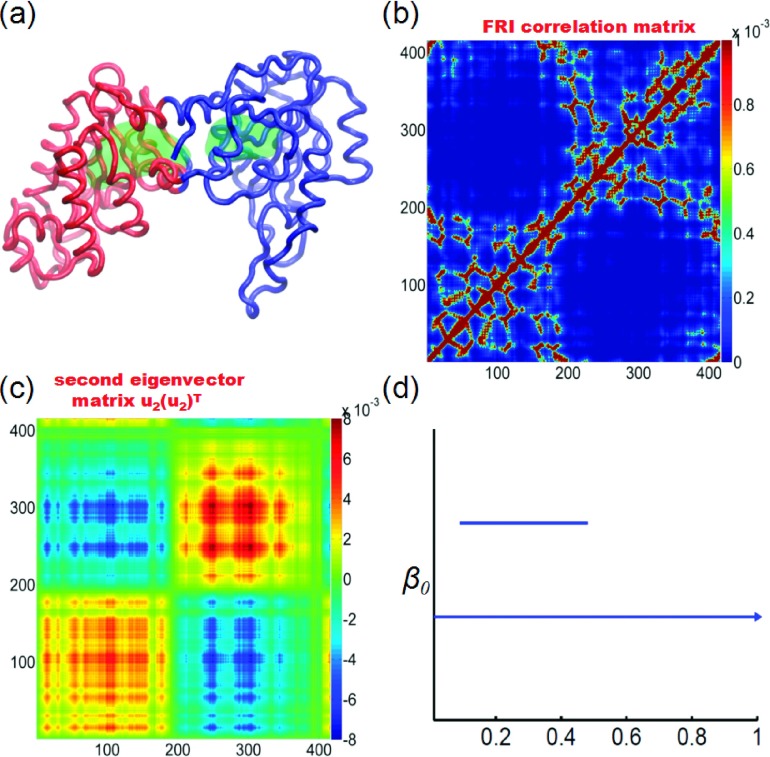
Figure 12 illustrates the domain predictions by three methods. Protein 3PGK has two domains as shown in Figure 12(a). The FRI correlation map {Cij}i,j=1,…,N generated by Cij = Φ(rij; η) is shown in Figure 12(b). Clearly, first 200 residues form one domain and the rest residues belong to another one. Two domains are linked through an alpha helix. In Figure 12(c), we plot the domain prediction from the second eigenvector of the FRI matrix
| (11) |
In this approach, we plot matrix , where u2 is the second eigenvector of {Γij(Φ)}i,j=1,…,N and T denotes the transpose. This matrix shows a clear separation of two domains as well. Finally, the β0 panel of present persistent homology gives rise to two distinct bars, indicating the existence of two domains as well.
FIG. 12.
The domain partition of protein 3PGK. The coarse-grained Cα model is used. In our FRI correlation map, FRI matrix, and rigidity density, the Lorentz kernel is employed with υ = 2 and η = 5 Å. (a) The domain partition using the second smallest eigenvalue of our FRI matrix. The two domains are colored in red and blue, respectively. It should be noticed that two green surfaces within the protein are extracted from our rigidity density map, indicating two isolated components in topological analysis. (b) The FRI correlation map constructed by Cij = Φ(rij; η). (c) FRI matrix constructed by the tensor product of the second eigenvector. (d) The β0 barcodes for the FRI rigidity density. It can be seen that using our multiresolution representation, we can identify two different domains in the protein.
IV. CONCLUSION REMARKS
Persistent homology is a promising tool for capturing the multiscale feature in data. However, persistent homology does not automatically create a multiscale representation on the data that have multiscale trait. Instead, it applies a uniform resolution on all scales in the radius based filtration. Since cross-scale filtration with a fine resolution is computationally unreachable, current persistent homology fails to work for large multiscale data, such as multiprotein complexes, which typically have atomic, residual, domain, protein, and protein-complex scales and may consist of millions of atoms in the data. In this work, we introduce multiresolution persistent homology to overcome this difficulty. Our essential idea is to choose appropriate resolution to match the scale of interest in topological analysis. Therefore, in our approach, low resolution is applied to the analysis of large scale features whereas high resolution is reserved for small scale details. As a result, by tuning the resolution, we can focus the topological lens on the scale of interest in a large dataset.
We construct the multiresolution persistent homology by extending FRI originally proposed for biomolecular data to general data.23,35 The FRI method incorporates resolution-tunable kernel functions to measure the topological connectivity of a data set via a generalized distance and thus gives rise to a rigidity function for the underlying data. Such a rigidity function provides a matrix or volumetric density representation of the data set. Therefore, by an appropriate selection of the resolution, FRI based density filtration generates resolution-matched persistent homology analysis at any specified scale. Additionally, the present FRI method also provides a multiresolution geometric representation of the data set to match the scale of interest.
We validate the proposed multiresolution topological method by a hexagonal fractal image which has a three-scale structure. We show that by an appropriate choice of resolution, the proposed method is able to capture the topology at each of the three scales. We further illustrate the proposed multiresolution geometric and topological analysis by a few biomolecules. Multiscale persistent homology analysis is carried out by using a DNA molecule with all-atom, all-atom without hydrogen, and coarse-grained (nucleic acid) representations. The topological fingerprints generated from these representations differ from each other, implying the potential complication and inconsistency in multiscale persistent analysis. In contrast to the multiscale persistent homology analysis, the proposed multiresolution persistent homology analysis is achieved based on the all-atom data. In this approach, resolution based continuous coarse-grained representation at any desirable scale can be constructed. The utility of the proposed method is also investigated by using a DNA molecule and a virus complex consisting of 240 protein monomers, which is too large to be computed by point cloud methods. The desirable topological fingerprints of the virus multiprotein complex are revealed in our numerical experiments. Finally, we apply the proposed multiresolution topological method to the protein domain identification. We show that by selecting the resolution to match the size of protein domains, the present method can effectively distinguish domains in a protein complex.
We also discuss the relation between the voxel spacing and the resolution. Generally, due to the limited computational resource, the grid spacing cannot be arbitrarily small, especially for microproteins or protein complexes. On the other hand, the resolution parameter is limited by the grid spacing. It is suggested that the resolution should not be smaller than about three times the size of the grid spacing in a cryo-EM fitting process. From our persistent homology analysis, we found that when the resolution is about the same as the grid spacing, many local details are lost. In our DNA examples, at a low resolution, the same sized grid spacing cannot distinguish between different types of atoms within the molecule, even through accuracy is good enough to discern individual atoms and preserve the total atom number. Therefore, one should be very careful in selection of the suitable grid spacing and resolution value. Also it is always helpful to cross-validate one’s results with the related multiscale models.
We believe that proposed multiresolution persistent homology provides a general and practical approach for the topological simplification of big data in point cloud, pixel, and voxel formats. The present multiresolution approach can be directly applied to the geometric and topological analysis of general data sets, such as social networks, biological networks, image, and graphs.
Acknowledgments
This work was supported in part by NSF Grant Nos. DMS-1160352 and IIS-1302285, NIH Grant No. R01GM-090208, and MSU Center for Mathematical Molecular Biosciences initiative. The authors acknowledge the Mathematical Biosciences Institute for hosting valuable workshops.
REFERENCES
- 1.See supplementary material at http://dx.doi.org/10.1063/1.4931733 E-JCPSA6-143-024537 for the multiresolution persistent homology analysis of pentagon-shaped and hexagon-shaped protein complexes in the virus capsid.
- 2.Bahar I., Atilgan A. R., and Erman B., “Direct evaluation of thermal fluctuations in proteins using a single-parameter harmonic potential,” Folding Des. 2, 173–181 (1997). 10.1016/S1359-0278(97)00024-2 [DOI] [PubMed] [Google Scholar]
- 3.Bendich P., Edelsbrunner H., and Kerber M., “Computing robustness and persistence for images,” IEEE Trans. Visualization Comput. Graphics 16, 1251–1260 (2010). 10.1109/TVCG.2010.139 [DOI] [PubMed] [Google Scholar]
- 4.Carlsson G., “Topology and data,” Bull. Am. Math. Soc. 46(2), 255–308 (2009). 10.1090/S0273-0979-09-01249-X [DOI] [Google Scholar]
- 5.Carlsson G., Ishkhanov T., Silva V., and Zomorodian A., “On the local behavior of spaces of natural images,” Int. J. Comput. Vision 76(1), 1–12 (2008). 10.1007/s11263-007-0056-x [DOI] [Google Scholar]
- 6.Dey T. K., Li K. Y., Sun J., and David C. S., “Computing geometry aware handle and tunnel loops in 3D models,” ACM Trans. Graphics 27(3), 45 (2008). 10.1145/1360612.1360644 [DOI] [Google Scholar]
- 7.Dey T. K. and Wang Y. S., “Reeb graphs: Approximation and persistence,” Discrete Comput. Geom. 49(1), 46–73 (2013). 10.1007/s00454-012-9463-z [DOI] [Google Scholar]
- 8.Di Fabio B. and Landi C., “A mayer-vietoris formula for persistent homology with an application to shape recognition in the presence of occlusions,” Found. Comput. Math. 11, 499–527 (2011). 10.1007/s10208-011-9100-x [DOI] [Google Scholar]
- 9.Edelsbrunner H., Letscher D., and Zomorodian A., “Topological persistence and simplification,” Discrete Comput. Geom. 28, 511–533 (2002). 10.1007/s00454-002-2885-2 [DOI] [Google Scholar]
- 10.Edelsbrunner H. and Harer J., Computational Topology: An Introduction (American Mathematical Society, 2010). [Google Scholar]
- 11.Frosini P. and Landi C., “Size theory as a topological tool for computer vision,” Pattern Recognition and Image Analysis 9(4), 596–603 (1999). [Google Scholar]
- 12.Frosini P. and Landi C., “Persistent betti numbers for a noise tolerant shape-based approach to image retrieval,” Pattern Recognit. Lett. 34, 863–872 (2013). 10.1016/j.patrec.2012.10.015 [DOI] [Google Scholar]
- 13.Gameiro M., Hiraoka Y., Izumi S., Kramar M., Mischaikow K., and Nanda V., “Topological measurement of protein compressibility,” Jpn. J. Indust. Appl. Math. 32(1), 1–17 (2015). 10.1007/s13160-014-0153-5 [DOI] [Google Scholar]
- 14.Ghrist R., “Barcodes: The persistent topology of data,” Bull. Am. Math. Soc. 45, 61–75 (2008). 10.1090/S0273-0979-07-01191-3 [DOI] [Google Scholar]
- 15.Horak D., Maletic S., and Rajkovic M., “Persistent homology of complex networks,” J. Stat. Mech.: Theory Exp. 2009(3), P03034. 10.1088/1742-5468/2009/03/P03034 [DOI] [Google Scholar]
- 16.Kaczynski T., Mischaikow K., and Mrozek M., Computational Homology (Springer-Verlag, 2004). [Google Scholar]
- 17.Kasson P. M., Zomorodian A., Park S., Singhal N., Guibas L. J., and Pande V. S., “Persistent voids a new structural metric for membrane fusion,” Bioinformatics 23, 1753–1759 (2007). 10.1093/bioinformatics/btm250 [DOI] [PubMed] [Google Scholar]
- 18.Lee H., Kang H., Chung M. K., Kim B., and Lee D. S., “Persistent brain network homology from the perspective of dendrogram,” IEEE Trans. Med. Imaging 31(12), 2267–2277 (2012). 10.1109/TMI.2012.2212450 [DOI] [PubMed] [Google Scholar]
- 19.Liu X., Xie Z., and Yi D., “A fast algorithm for constructing topological structure in large data,” Homol., Homotopy Appl. 14, 221–238 (2012). 10.4310/HHA.2012.v14.n1.a11 [DOI] [Google Scholar]
- 20.Mischaikow K., Mrozek M., Reiss J., and Szymczak A., “Construction of symbolic dynamics from experimental time series,” Phys. Rev. Lett. 82, 1144–1147 (1999). 10.1103/PhysRevLett.82.1144 [DOI] [Google Scholar]
- 21.Mischaikow K. and Nanda V., “Morse theory for filtrations and efficient computation of persistent homology,” Discrete Comput. Geom. 50(2), 330–353 (2013). 10.1007/s00454-013-9529-6 [DOI] [Google Scholar]
- 22.Niyogi P., Smale S., and Weinberger S., “A topological view of unsupervised learning from noisy data,” SIAM J. Comput. 40, 646–663 (2011). 10.1137/090762932 [DOI] [Google Scholar]
- 23.Opron K., Xia K. L., and Wei G. W., “Fast and anisotropic flexibility-rigidity index for protein flexibility and fluctuation analysis,” J. Chem. Phys. 140, 234105 (2014). 10.1063/1.4882258 [DOI] [PMC free article] [PubMed] [Google Scholar]
- 24.Opron K., Xia K. L., and Wei G. W., “Communication: Capturing protein multiscale thermal fluctuations,” J. Chem. Phys. 142, 211101 (2015). 10.1063/1.4922045 [DOI] [PMC free article] [PubMed] [Google Scholar]
- 25.Pachauri D., Hinrichs C., Chung M. K., Johnson S. C., and Singh V., “Topology-based kernels with application to inference problems in Alzheimer’s disease,” IEEE Trans. Med. Imaging 30(10), 1760–1770 (2011). 10.1109/TMI.2011.2147327 [DOI] [PMC free article] [PubMed] [Google Scholar]
- 26.Rieck B., Mara H., and Leitte H., “Multivariate data analysis using persistence-based filtering and topological signatures,” IEEE Trans. Visualization Comput. Graphics 18, 2382–2391 (2012). 10.1109/TVCG.2012.248 [DOI] [PubMed] [Google Scholar]
- 27.Robins V., “Towards computing homology from finite approximations,” Topol. Proc. 24(1), 503–532 (1999). [Google Scholar]
- 28.de Silva V., Ghrist R., and Muhammad A., “Blind swarms for coverage in 2-D,” Proc. Robotics: Systems and Science (2005), pp. 335-342. [Google Scholar]
- 29.Singh G., Memoli F., Ishkhanov T., Sapiro G., Carlsson G., and Ringach D. L., “Topological analysis of population activity in visual cortex,” J. Vision 8(8), 11.1–18 (2008). 10.1167/8.8.11 [DOI] [PMC free article] [PubMed] [Google Scholar]
- 30.Wang B. and Wei G. W., “Object-oriented persistent homology,” J. Comp. Phys. (to be published). [DOI] [PMC free article] [PubMed]
- 31.Wang B., Summa B., Pascucci V., and Vejdemo-Johansson M., “Branching and circular features in high dimensional data,” IEEE Trans. Visualization Comput. Graphics 17, 1902–1911 (2011). 10.1109/TVCG.2011.177 [DOI] [PubMed] [Google Scholar]
- 32.Wei G. W., “Wavelets generated by using discrete singular convolution kernels,” J. Phys. A: Math. Gen. 33, 8577–8596 (2000). 10.1088/0305-4470/33/47/317 [DOI] [Google Scholar]
- 33.Wriggers W., Milligan R. A., and McCammon J. A., “Situs: A package for docking crystal structures into low-resolution maps from electron microscopy,” J. Struct. Biol. 125, 185–195 (1999). 10.1006/jsbi.1998.4080 [DOI] [PubMed] [Google Scholar]
- 34.Xia K. L., Feng X., Tong Y. Y., and Wei G. W., “Persistent homology for the quantitative prediction of fullerene stability,” J. Comput. Chem. 36, 408–422 (2015). 10.1002/jcc.23816 [DOI] [PMC free article] [PubMed] [Google Scholar]
- 35.Xia K. L., Opron K., and Wei G. W., “Multiscale multiphysics and multidomain models—Flexibility and rigidity,” J. Chem. Phys. 139, 194109 (2013). 10.1063/1.4830404 [DOI] [PMC free article] [PubMed] [Google Scholar]
- 36.Xia K. L. and Wei G. W., “Persistent homology analysis of protein structure, flexibility and folding,” Int. J. Numer. Methods Biomed. Eng. 30, 814–844 (2014). 10.1002/cnm.2655 [DOI] [PMC free article] [PubMed] [Google Scholar]
- 37.Xia K. L. and Wei G. W., “Multidimensional persistence in biomolecular data,” J. Comput. Chem. 36, 1502–1520 (2015). 10.1002/jcc.23953 [DOI] [PMC free article] [PubMed] [Google Scholar]
- 38.Xia K. L. and Wei G. W., “Persistent topology for cryo-EM data analysis,” Int. J. Numer. Methods Biomed. Eng. 31, e02719 (2015). 10.1002/cnm.2719 [DOI] [PubMed] [Google Scholar]
- 39.Yao Y., Sun J., Huang X. H., Bowman G. R., Singh G., Lesnick M., Guibas L. J., Pande V. S., and Carlsson G., “Topological methods for exploring low-density states in biomolecular folding pathways,” J. Chem. Phys. 130, 144115 (2009). 10.1063/1.3103496 [DOI] [PMC free article] [PubMed] [Google Scholar]
- 40.Yu Z. Y., Holst M., Cheng Y., and McCammon J. A., “Feature-preserving adaptive mesh generation for molecular shape modeling and simulation,” J. Mol. Graphics Model. 26, 1370–1380 (2008). 10.1016/j.jmgm.2008.01.007 [DOI] [PubMed] [Google Scholar]
- 41.Zomorodian A. and Carlsson G., “Computing persistent homology,” Discrete Comput. Geom. 33, 249–274 (2005). 10.1007/s00454-004-1146-y [DOI] [Google Scholar]
Associated Data
This section collects any data citations, data availability statements, or supplementary materials included in this article.
Data Citations
- See supplementary material at http://dx.doi.org/10.1063/1.4931733 E-JCPSA6-143-024537 for the multiresolution persistent homology analysis of pentagon-shaped and hexagon-shaped protein complexes in the virus capsid.


