

Abstract
Background
Genome-wide association studies (GWAS) have so far reported 12 loci associated with serous epithelial ovarian cancer (EOC) risk. We hypothesized that some of these loci function through nearby transcription factor (TF) genes and that putative target genes of these TFs as identified by co-expression may also be enriched for additional EOC risk associations.
Methods
We selected TF genes within 1 Mb of the top signal at the 12 genome-wide significant risk loci. Mutual information, a form of correlation, was used to build networks of genes strongly co-expressed with each selected TF gene in the unified microarray data set of 489 serous EOC tumors from The Cancer Genome Atlas. Genes represented in this data set were subsequently ranked using a gene-level test based on results for germline SNPs from a serous EOC GWAS meta-analysis (2,196 cases/4,396 controls).
Results
Gene set enrichment analysis identified six networks centered on TF genes (HOXB2, HOXB5, HOXB6, HOXB7 at 17q21.32 and HOXD1, HOXD3 at 2q31) that were significantly enriched for genes from the risk-associated end of the ranked list (P<0.05 and FDR<0.05). These results were replicated (P<0.05) using an independent association study (7,035 cases/21,693 controls). Genes underlying enrichment in the six networks were pooled into a combined network.
Conclusion
We identified a HOX-centric network associated with serous EOC risk containing several genes with known or emerging roles in serous EOC development.
Impact
Network analysis integrating large, context-specific data sets has the potential to offer mechanistic insights into cancer susceptibility and prioritize genes for experimental characterization.
Keywords: ovarian cancer, network analysis, GWAS, gene expression, transcription factors
Introduction
The genetic architecture of inherited susceptibility to epithelial ovarian cancer (EOC) appears similar to other hormone-related cancers, but fewer EOC risk loci have been discovered compared to breast and prostate cancer, probably due to restricted sample size (1). Genome-wide association studies (GWAS) have so far identified 12 risk loci associated with serous EOC, the most common subtype of EOC (1–7). These account for 4 per cent of the excess familial risk of EOC, while rare, high-penetrance mutations in genes such as BRCA1 and BRCA2 explain about 40 per cent (8). This suggests that many undiscovered common serous EOC risk variants exist.
Very stringent statistical thresholds are generally used to declare common variant susceptibility alleles at so-called genome-wide significance (P < 5×10⁻⁸). However, when there is limited statistical power, hundreds or thousands of single nucleotide polymorphisms (SNPs) with small effect sizes will not reach genome-wide significance (9). A key challenge in genetic epidemiology is to identify these risk SNPs with small effects. One approach is ever-larger studies allied to better coverage of common variation across the genome to increase statistical power. However, even a case-control study with 100,000 samples has just 23 per cent power to detect at genome-wide significance an allele of frequency 5 per cent that confers a per-allele relative risk of 1.1.
GWAS pathway analysis has emerged as a complement to imputation, single-variant testing and meta-analysis for the discovery of true genetic associations in the pool of SNPs that are below genome-wide significance (10). Pathway studies are guided by the hypothesis that true risk associations are more likely to cluster in genes that share a common biological function potentially dysregulated in disease pathogenesis. However, incomplete annotation and canonical representation of pathways in the literature are major limiting factors (11).
One approach to overcome this limitation is by analyzing GWAS signals within the reduced search space of dynamic networks constructed from pairwise interactions observed in large, independent, tissue-specific transcriptomic data sets (12). Further, GWAS of cancer and other diseases increasingly suggest that at least some genome-wide significant risk loci act through nearby transcription factor (TF) genes (13–15). Target genes of these TFs in turn have been found to be enriched for SNPs that fail to reach genome-wide significance but are nominally associated with the disease (16,17). Therefore, we adopted a risk locus TF gene-centric approach to integrating serous EOC transcriptomic and GWAS data sets. Seven of the 12 known genome-wide significant serous EOC risk loci harbor at least one TF gene in the 2 Mb interval centered on the top SNP at the locus. This includes nine members of the HOXD cluster and 10 members of the HOXB cluster at the 2q31 and 17q21.32 loci, respectively. The target genes of most homeobox (HOX) TFs remain largely unknown due to their promiscuous DNA binding properties in vitro (18). Since genes highly co-expressed with TF genes are more likely to represent their targets (19), and co-expression has been linked to shared function (20), we used the genes highly co-expressed with each TF in The Cancer Genome Atlas (TCGA) high-grade serous EOC microarray data set to build hub-and-spoke type TF-target gene networks (21). We then systematically interrogated these networks for overrepresentation of genes containing SNPs ranked high for their association with serous EOC risk in a GWAS meta-analysis. Our aims were to prioritize hub TF genes whose networks demonstrated such overrepresentation as candidates for post-GWAS functional characterization and to use these networks to identify novel pathways and potential sub-genome-wide significant risk loci involved in serous EOC development. Most GWAS SNPs lie outside protein-coding regions of the genome and may affect cancer susceptibility by regulating a gene or genes up to a megabase away making such integrative genomic approaches to prioritizing genes in these 1 Mb regions imperative (22,23).
Materials and Methods
Ranking genes based on GWAS results for serous EOC risk
This study used P-values for association with serous EOC risk from a published meta-analysis of a North American and UK GWAS for 2,508,744 SNPs that were either genotyped or imputed in a total of 2,196 serous EOC cases and 4,396 controls (1). The meta-analysis was restricted to subjects of European descent and the HapMap II (release 22) CEU panel served as reference for imputation. The North American and UK GWAS together with the replication data set described below are summarized in Supplementary Table S1. All participants provided written informed consent and each contributing study was approved by the appropriate local institutional ethical review board. A complete list of genes annotated with start and end positions of each gene was downloaded via the Bioconductor package TxDb.Hsapiens.UCSC.hg19.knownGene (v2.8.0). After removing genes with ambiguous location, all SNPs were mapped to genes with boundaries defined by the start and end positions. The genes were ranked in descending order of the negative logarithm (base 10) of the minimum P-value among all SNPs in each gene after adjusting this P-value for the number of SNPs in the gene using a modification of the Sidak correction (24). This accounts for linkage disequilibrium (LD) between SNPs while reducing the effect of gene size on the minimum P-value (25). Pearson’s r between gene size and minimum P-value improved from −0.3 to +0.1. Adequacy of correction was further confirmed by quantile-quantile plots (Supplementary Figure S1). In all, 10,693 genes that were also represented in the TCGA gene expression data set (described below) were ranked based on the GWAS results for subsequent analysis.
Constructing serous EOC-specific co-expression networks with TF genes at risk loci as hubs
We selected genes with experimentally confirmed transcription factor activity as described in Vaquerizas et al. (26) that were less than 1 Mb from the most significant SNP at each of the 12 loci (1–7) known to be associated with serous EOC risk at genome-wide significance (Table 1). The SNPs listed in Table 1 were obtained from the Collaborative Oncological Gene-environment Study Primer (27). Nineteen of the 29 TF genes selected belonged to either the HOXB or the HOXD cluster. We relied on co-expression in serous EOC tissue to define possible context-specific target genes of the TFs.
Table 1.
Summary of 12 genome-wide significant serous EOC risk loci
| Locus | SNP | Chr | Position | OR | 95% CI | TF genes < 1 Mb away from SNP |
|---|---|---|---|---|---|---|
| 2q31 | rs711830 | 2 | 177,037,311 | 1.12 | 1.08–1.15 | HOXD1, HOXD3, HOXD4a, HOXD8a, HOXD9b, HOXD10, HOXD11b, HOXD12b, HOXD13b |
| 3q25 | c3_pos157917010 | 3 | 157,917,010 | 1.44 | 1.35–1.54 | SHOX2 |
| 4q32c | rs4691139 | 4 | 165,908,721 | 1.2 | 1.17–1.38 | |
| 5p15 | rs10069690 | 5 | 1,279,790 | 1.09 | 1.05–1.13 | IRX4b |
| 8q21 | rs11782652 | 8 | 82,653,644 | 1.19 | 1.12–1.26 | |
| 8q24 | rs7814937 | 8 | 129,541,475 | 1.18 | 1.13–1.24 | MYC |
| 9p22 | rs3814113 | 9 | 16,915,021 | 1.21 | 1.17–1.25 | |
| 10p12 | rs7084454 | 10 | 21,821,274 | 1.1 | 1.06–1.14 | |
| 17q12 | rs7405776 | 17 | 36,093,022 | 1.12 | 1.08–1.17 | HNF1Bb |
| 17q21.31 | rs2077606 | 17 | 43,529,293 | 1.15 | 1.12–1.19 | |
| 17q21.32 | rs7218345 | 17 | 46,502,917 | 1.12 | 1.08–1.16 |
HOXB1b, HOXB2, HOXB3, HOXB4a, HOXB5, HOXB6, HOXB7 HOXB8b, HOXB9b, HOXB13b, SP2, SP6a, TBX21, NFE2L1 |
| 19p13 | rs8170 | 19 | 17,389,704 | 1.14 | 1.09–1.17 | KLF2b, NR2F6 |
Transcription factor gene was not represented in the TCGA data set.
Transcription factor gene excluded because it was the hub of a co-expression network with < 15 or > 500 genes.
Associated with serous EOC risk in BRCA1 mutation carriers only (7).
Abbreviations: Chr: chromosome; OR: odds ratio; CI: confidence intervals.
Genes co-expressed with each selected TF gene were identified in the “unified expression” data set downloaded from TCGA (28). The data set contains expression measurements from three different microarray platforms unified into a single estimate for 11,864 genes in 489 high-grade serous ovarian adenocarcinoma samples (21). Four of the 29 TF genes were not represented in this data set and were therefore excluded. Co-expression was measured by mutual information (MI), a form of correlation, estimated using the adaptive partitioning method implemented in the Algorithm for the Reconstruction of Accurate Cellular Networks (ARACNE) (29). A threshold of P < 0.01 after Bonferroni correction for 11,864 pairwise tests was set in ARACNE to retain only the genes most strongly co-expressed with each TF gene.
Gene set enrichment analysis (GSEA)
Each TF gene and the genes co-expressed with it were treated as a single hub-and-spoke network. GSEA (30) was used to determine overrepresentation of genes from the serous EOC-associated end of the ranked list generated on the basis of the GWAS meta-analysis, in each network. Before evaluating each network by GSEA, its parent hub TF gene was excluded from the network. Ten thousand permutations were performed with the number increased to 50,000 for networks with P = 0 at 10,000. Genes in the ranked list that were not among the 11,864 genes in the TCGA data set were excluded before GSEA as their co-expression with the TFs could not be evaluated. GSEA is optimized for gene sets/networks containing 15 to 500 genes (30). Applying this cut-off led to the exclusion of 11 of the 25 networks from the primary GSEA. We also conducted a secondary GSEA run allowing for networks with more than 10 genes. This enabled evaluation of 24 out of the 25 co-expression networks. Only the network centered on HOXD9 was excluded in the second GSEA run since it contained just six genes. Networks with GSEA P < 0.05 and FDR < 0.05 were considered significant. We also reported fold enrichment as the ratio of the number of genes from the top 5% of the ranked list that were observed in each network to the number expected. Cytoscape (v2.8.3) was used for network visualization (31).
Replication analyses
First, we examined the effect of LD between SNPs in closely spaced genes. The frequent co-expression of genes co-localized on the genome coupled with LD between SNPs in such genes has the potential to inflate the GSEA signal (25). We subjected all SNPs in genes that were in the ranked list input to GSEA to LD-based clumping using PLINK (v1.07) (32) and CEU LD information from HapMap II (release 22). Starting from the most significant SNP, all SNPs with r2 > 0.7 within 250 kb of it were removed and the step repeated for the next best available SNP. Using the LD-thinned SNP list, SNP-to-gene mapping, gene ranking and GSEA were repeated as described above.
Second, to replicate significant findings from our primary analysis, we used an independent data set from the Collaborative Oncological Gene-environment Study (COGS). The COGS data set included 7,035 serous EOC cases and 21,693 controls of European descent after exclusion of overlap with the samples used in the primary analysis (Supplementary Table S1). These were genotyped using the iCOGS custom array (1) and imputed into the 1000 Genomes March 2012 EUR reference panel (Kuchenbaecker et al., under review). The imputed data set was filtered to retain 7,768,381 SNPs with minor allele frequency > 0.03 for consistency with the GWAS meta-analysis. SNP-to-gene mapping (without LD-based clumping), gene ranking and GSEA were repeated as described above.
Analysis of combined network
The “leading-edge” subsets of genes from all co-expression networks that were significant in the primary analysis were combined into a single network. The leading-edge subset is the core of a gene set or network that drives its enrichment signal. It is defined as those members of the network that are ranked higher than the position in the ranked gene list where the network enrichment score is maximum (30). Subsequent analyses were conducted on genes in the combined network.
First, we input the genes to the Disease Association Protein-Protein Link Evaluator (DAPPLE, v1.0) (33). DAPPLE uses a database of 169,810 well-established pairwise interactions between 12,793 proteins to connect input proteins (genes) directly or indirectly via a single protein not in the input. Biologically meaningful networks are more connected than random ones and DAPPLE tests the significance of indirect connectivity in the resultant network using permutation.
Second, we measured co-expression between each TF gene that was the hub of a significant network in the primary analysis and 17,255 other genes with expression levels profiled in the 245-sample Australian Ovarian Cancer Study (AOCS) serous EOC microarray data set (GSE9899) (34,35) using MI calculated by ARACNE. All 17,255 genes were ranked based on the strength of their co-expression with each hub TF. For each hub TF, we then counted the number of genes co-expressed with it in the combined network that were also observed among the top (strongest) 1% and top 10% of co-expression interactions for the TF in the AOCS data set as arbitrary estimates of tissue-specific replication of these co-expression-derived interactions.
Third, we used PSCAN (v1.2.2) (36) to test overrepresentation of known TF binding motifs from TRANSFAC (Human) (37) up to 1 kb upstream of transcription start sites of genes in the combined network. HOXB and HOXD motifs were absent in PSCAN but some homeodomain motifs were represented.
Results
The network-based analytical strategy we used to integrate serous EOC GWAS and gene expression data sets is outlined in Figure 1. A total of 29 TF genes were located within 1 Mb of the top risk-associated SNP at seven of the 12 known genome-wide significant serous EOC risk loci (Table 1). Of these, four TFs were not represented in the TCGA data set used in this study and could not be evaluated further (Table 1). Computing pairwise mutual information between the somatic expression levels of each remaining TF gene (fixed as a hub) and the 11,863 other genes in the TCGA data set using an adaptive partitioning procedure with a Bonferroni-adjusted threshold of P < 0.01 to retain only the most strongly co-expressed genes yielded 25 hub-and-spoke type networks ranging in size from 6 to 1,953 genes. Fourteen TF genes from five risk loci were hubs of co-expression networks that included between 17 and 368 genes placing them in the gene set size range (15 to 500 genes) optimal for GSEA (Tables 1 and 2). A total of 689,882 of the approximately 2.5 million SNPs from the serous EOC GWAS meta-analysis were located within the boundaries of 10,693 of the 11,864 genes represented in the TCGA data. These genes were ranked in descending order using the negative logarithm (base 10) of the modified Sidak-corrected minimum P-value among all SNPs in each gene.
Figure 1.

Outline of steps involved in the integrated analysis of GWAS and tissue-specific expression data sets to identify, replicate and computationally follow-up gene networks associated with serous EOC susceptibility.
Table 2.
GSEA results for 14 serous EOC risk locus TF-centric gene co-expression networksa
| Serous EOC risk locus | Network hub TF gene | Co-expression network size | Normalized enrichment | Nominal P-value | FDR q-value | Top 5% fold enrichment |
|---|---|---|---|---|---|---|
| 17q21.32 | HOXB2 | 17 | 1.64 | 2.0E-05b | 4.0E-05b | 8.00 |
| 17q21.32 | HOXB7 | 31 | 1.62 | 0b | 5.0E-05b | 4.50 |
| 17q21.32 | HOXB6 | 33 | 1.43 | 5.0E-04 | 3.0E-03 | 4.50 |
| 2q31 | HOXD3 | 52 | 1.39 | 5.0E-04 | 4.9E-03 | 3.67 |
| 17q21.32 | HOXB5 | 30 | 1.37 | 4.0E-03 | 5.1E-03 | 3.00 |
| 2q31 | HOXD1 | 69 | 1.25 | 8.1E-03 | 0.04 | 1.50 |
| 17q21.32 | SP2 | 134 | 1.18 | 7.7E-03 | 0.09 | 1.57 |
| 17q21.32 | HOXB3 | 103 | 1.18 | 0.02 | 0.08 | 2.17 |
| 17q21.32 | TBX21 | 46 | 1.10 | 0.19 | 0.22 | 1.33 |
| 17q21.32 | NFE2L1 | 315 | 1.06 | 0.12 | 0.35 | 1.06 |
| 19p13 | NR2F6 | 312 | 1.04 | 0.23 | 0.43 | 1.50 |
| 8q24 | MYC | 130 | 1.02 | 0.37 | 0.45 | 0.71 |
| 3q25 | SHOX2 | 368 | 1.00 | 0.53 | 0.56 | 0.95 |
| 2q31 | HOXD10 | 85 | 1.00 | 0.52 | 0.52 | 0.80 |
Hub-and-spoke networks containing 15 to 500 genes constructed from serous EOC TCGA data.
For 50,000 permutations, since nominal P-value = 0 at the default number of 10,000 permutations.
Six of the 14 networks tested by GSEA (with hubs HOXB2, HOXB7, HOXB6, and HOXB5 at 17q21.32, and hubs HOXD3 and HOXD1 at 2q31) were significantly enriched for genes that ranked high for their association with serous EOC risk (GSEA P < 0.05 and FDR < 0.05; Table 2). The significant networks demonstrated between 1.5- and 8-fold enrichment for genes from the top 5% of the ranked list as compared to expectation (Table 2). Supplementary Table S2 lists the genes in each significant network.
The six networks identified by the primary analysis remained significant in replication analysis using the linkage disequilibrium-thinned SNP list indicating that the primary GSEA signals were not being driven by strongly correlated SNPs in closely spaced genes (Supplementary Table S3). All six networks were also significantly associated (P = 0.03 to 4×10⁻⁴) with serous EOC risk in replication analysis using the independent COGS data set (Supplementary Table S4). Next, we observed that 33 genes were shared by more than one of the six networks. Further, 18 genes across the six networks were located less than 1 Mb from the most significantly-associated SNPs at the 2q31 and 17q21.32 risk loci. To eliminate potential inflation of the GSEA signal due to genes co-expressed locally with the hub TF genes anchoring the significant networks, we pooled the 249 genes in the six original networks and removed the 18 genes at 2q31 and 17q21.32. We also counted the overlapping genes only once in the pooled network. The result was a set of 174 genes of which 170 were covered by SNPs in the COGS data set. This filtered set was also significantly associated with serous EOC risk in GSEA using the ranked gene list derived from the COGS data (P = 0.007). A secondary GSEA run with less stringent parameters that allowed inclusion of the 24 co-expression networks with more than 10 genes (including the 10 previously excluded networks containing > 500 genes) did not identify any additional significant networks at the P < 0.05 and FDR < 0.05 threshold (Supplementary Table S5). Supplementary Table S6 shows differences in the number of genes from the TCGA data set covered by intragenic SNPs in the ranked lists generated from the GWAS meta-analysis, LD-thinned, and COGS data sets.
Given that all networks significant in the primary analysis were centered on hub TFs from the HOX gene family and the observation that some of their targets were shared, we merged the leading edge subsets (i.e., the genes underlying the GSEA signal) from each of the six networks. This yielded a combined network of 50 non-redundant genes most strongly associated with serous EOC risk and 81 interactions between them (Figure 2). The 50 genes were submitted as input to the web-based tool, DAPPLE, to determine if they demonstrate significant connectivity at the protein-protein interaction (PPI) level, a frequent characteristic of disease associated networks (38). DAPPLE connected the proteins encoded by the genes using a database of high-confidence PPIs, allowing for connections between input genes/proteins that were either direct or indirect via a single intermediate protein not in the input group. Two PPI networks were formed (Supplementary Figure S2), with the larger network involving 29 of the 50 input genes/proteins. Compared to 10,000 permuted networks with similar underlying topology, the input proteins were more likely to be connected to each other indirectly (through a single intermediate protein) than expected by chance alone (P = 0.01). Next, we evaluated whether the genes co-expressed with the hub TF genes in the combined network were more likely to be among the genes most strongly co-expressed with the same TFs in an independent microarray data set from the Australian Ovarian Cancer Study. All interactions in the combined network between a hub TF gene and another HOX cluster gene and 25/44 (57%) hub TF and non-HOX cluster gene interactions were among the top 10% of interactions for the corresponding hub TF in the AOCS data set (for HOX non-HOX interactions, binomial test P = 2×10⁻¹⁴). In fact, 32/37 (86%) HOX-HOX and 13/44 (30%) HOX-non-HOX interactions were seen at a more stringent top 1% level (for HOX non-HOX interactions, binomial test P = 4×10⁻¹⁶). HOX-HOX interactions were analyzed separately since HOX cluster members are already known to interact with each other (39). Finally, we assessed enrichment of known TF binding motifs up to 1 kb upstream of the 40 non-HOX cluster genes in the combined network using the online tool PSCAN to look for possible overrepresentation of the few homeodomain motifs that are well established. The binding motif for the cooperative homeodomain TFs, HOX-A9-MEIS1, was the second most overrepresented among the 40 non-HOX cluster genes in the combined network (P = 0.008), second only to the motif for SPZ1 (P = 0.006). Thus, the AOCS data set and the PSCAN tool further supported the TF-target gene interactions observed in the combined network.
Figure 2.
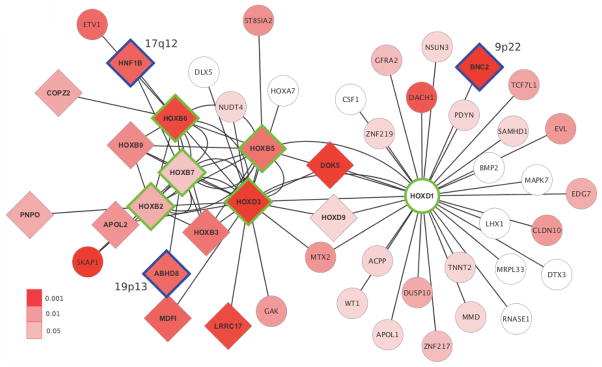
Cytoscape visualization of the combined network. Hub TF genes of the six significant networks underlying the combined network are outlined in green. Candidate genes at genome-wide significant risk loci other than the input hub loci (2q31 and 17q21.32) are outlined in blue. Nodes are colored according to the P-value of the most significant intragenic SNP in the GWAS meta-analysis (uncorrected for the number of intragenic SNPs). Diamond shaped genes have P < 0.05 after applying the modified Sidak correction.
Discussion
In this study, we used network analysis to integrate TCGA gene expression data with GWAS meta-analysis summary findings to identify six networks significantly associated with serous EOC risk and replicated our results using the independent COGS data set. Network construction was guided by the premise that TF genes near genome-wide significant serous EOC risk SNPs may be the functional targets of these SNPs. The TFs may regulate pathways of target genes, represented by genes strongly co-expressed with each TF gene that are, in turn, enriched for SNPs nominally associated with serous EOC susceptibility. The product of the multi-step analysis presented here is a combined network of 50 genes and 81 interactions (Figure 2). A significant proportion of these interactions were further supported by co-expression analysis in the independent AOCS microarray data set.
Hub TF genes of the six significant networks and the genes in their combined network suggest that specific members of the HOXD and HOXB clusters potentially mediate the effects of the 2q31 and 17q21.32 serous EOC risk loci, respectively. While this analysis was ongoing, a parallel comprehensive functional follow-up of the 2q31 locus revealed that SNPs at this locus impact serous EOC development through HOXD9 (Lawrenson et al., submitted). HOXD9 could not be evaluated as a hub TF using GSEA since its network contained just six genes (including HOXD1 and HOXD3) at the stringent cut-off we used for identifying only the most strongly co-expressed genes. However, it is worth noting that HOXD9 is a leading edge or core member of two of the significant networks identified (centered on HOXD1 and HOXD3) and therefore appears in the combined network uncovered by this analysis (Figure 2). Thus, HOXD9 may have a putative master regulatory role upstream of HOXD1 and HOXD3 in serous EOC development. At 17q21.32, HOXB5, HOXB6 and HOXB7 have collectively been implicated in early carcinogenic reprogramming of transcription in epithelial cells (40). HOXB7 is also known to be involved in DNA repair catalyzed by poly(ADP-ribose) polymerase (41). HOXB7 expression is elevated in ovarian cancer and overexpression is associated with marked proliferation of immortalized normal ovarian surface epithelial cells by upregulation of basic fibroblast growth factor (42). Hypermethylation of HOXB5, a possible tumor suppressor, is also a frequent somatic change reported in ovarian cancer and corresponding in vitro models (43). Overall, the identification of a novel HOX-centric pathway is consistent with the emerging role of developmental genes in ovarian carcinogenesis (44). Other members of the HOX gene family have previously been shown to guide both reproductive tract patterning during early development and epithelial ovarian cancer cellular morphology (45).
A striking feature of the combined network is that it connects genes at five of the 12 genome-wide significant serous EOC risk loci. This is particularly compelling because only TF genes from two of these loci (2q31 and 17q21.32) were used as seed hubs for the six significant networks that underlie the combined network. The other three were picked up by the combination of co-expression and enrichment analysis, that is, without any a priori input. A small number of genes contribute to the combined network from the three non-hub loci in this group of five: BNC2 (HOXD1 network member) at 9p22; HNF1B (HOXB6 and HOXB7 networks) and LHX1 (HOXD1 network) at 17q12; and ABHD8 (HOXB7 network) at 19p13. Serous EOC risk SNPs at 17q12 have previously been associated with significantly higher HNF1B methylation (46). Likewise, the SNPs at the 9p22 risk locus are likely to represent multiple transcriptional regulatory elements acting on BNC2 based on an integrated functional analysis (Buckley et al., in preparation). Finally, functional work on 19p13 indicates that ABHD8 is the most likely target of serous EOC and breast cancer risk SNPs at this locus (Lawrenson et al., in preparation) (4,47). Taken together, these findings for ABHD8, HNF1B and BNC2 underscore the power of integrating GWAS with tissue-specific gene expression data in a network paradigm to prioritize the genes likely to be regulated by genome-wide significant risk variants for downstream functional characterization (23).
The addition of orthogonal biological priors to statistical evidence from GWAS may also unravel interesting targets at loci that are nominally significant but fail to reach genome-wide significance. For example, the oncogene WT1 that appears in the combined network is a highly specific serous ovarian lineage marker (48). The top SNP in this gene has P = 0.012 in the GWAS meta-analysis that strengthens to P = 0.0078 in the COGS data set. However, while it is intriguing to identify such possible functional targets associated with serous EOC susceptibility, it will require extensive experimental validation to confirm their role in disease predisposition. Profiling of the relevant HOXB and HOXD transcription factor binding in fallopian tube and ovarian surface epithelial cells and in ovarian cancer cells may identifying binding sites containing serous EOC risk SNPs analogous to what has been done to establish the role of other TFs in breast cancer susceptibility (49,50). The emergence of genome editing technologies such as the CRISPR-Cas9 system may further enable modification of risk SNPs in these HOX binding sites to modulate and confirm the role of the HOX target genes in cellular models that reflect early stages of ovarian cancer (51).
The observation that 29 of the 50 genes in the combined network were also part of a protein-protein interaction network with significant indirect connectivity suggests that this gene network is biologically coherent. The failure to capture the remaining 21 co-expressed genes in the PPI network also hints that some interactions are perhaps tissue-specific and/or specific to the transcriptome since DAPPLE, the tool used for the PPI network analysis, relies on protein interactions found in different tissues (33).
There are limitations inherent in this study. GSEA is optimized to detect enrichment in gene sets or networks containing between 15 and 500 genes. Although we applied it to the 10 networks containing more than 500 genes in a secondary analysis, our failure to detect any additional significant networks among the very large networks does not rule out the presence of genuine enrichment in these networks. Co-expression is likely not the perfect proxy for defining TF targets and the risk locus-TF gene and TF-target gene interactions suggested by this analysis warrant follow-up.
In conclusion, by identifying a HOX-centric gene co-expression network associated with serous EOC risk, this report highlights the potential of network analysis to combine GWAS with other molecular data to offer insights into the mechanisms linking population studies with cancer biology.
Supplementary Material
Acknowledgments
Financial Support
Funding for the Collaborative Oncological Gene-environment Study (COGS) infrastructure came from a European Commission’s Seventh Framework Programme grant (agreement number 223175-HEALTH-F2-2009-223175). The scientific development and funding for this project were in part supported by the US National Cancer Institute GAME-ON Post-GWAS Initiative (U19-CA148112). Funding for the Ovarian Cancer Association Consortium (OCAC) GWAS infrastructure came from the Ovarian Cancer Research Fund thanks to donations by the family and friends of Kathryn Sladek Smith (PPD/RPCI.07). D.F. Easton is supported by a Cancer Research UK Principal Research Fellowship. G. Chenevix-Trench is supported by the National Health and Medical Research Council of Australia. B.Y. Karlan is supported by an American Cancer Society Early Detection Professorship (SIOP-06-258-01-COUN). L.E. Keleman was supported by a Canadian Institutes of Health Research Investigator award (MSH-87734). A.W. Lee is supported by a T32 grant from the US National Institute of Environmental Health Sciences (T32ES013678). K. Lawrenson is supported by a K99/R00 grant from the US National Cancer Institute (1K99CA184415-01). S.P. Kar is supported by a Gates Cambridge Scholarship.
The following authors would like to acknowledge specific grant support from the NIH: J.A. Doherty (R01-CA168758), R.P. Edwards (R13-CA165638), K. Odunsi (P50-CA159981), C.L. Pearce (R03-CA115195), J. Permuth-Wey (R01-CA114343), C.M. Phelan (R01-CA149429), E.M. Poole (T32-CA009001), S.J. Ramus (R01-CA172404), H.A. Risch (R01-CA074850), J.H. Rothstein (P30-CA124435), W. Sieh (K07-CA143047), L.E. Sucheston-Campbell (P50-CA159981), Rachel Palmieri Weber (R01-CA076016); and from Cancer Research UK: A. Gentry-Maharaj (C315/A2621) and P.D.P. Pharoah (C490/A10119). Funding of the constituent studies of the OCAC GWAS and COGS are listed by funding agency with each grant number in parentheses: American Cancer Society (CRTG-00-196-01-CCE); the California Cancer Research Program (00-01389V-20170, N01-CN25403, 2II0200); the Canadian Institutes for Health Research (MOP-86727); Cancer Council Victoria; Cancer Council Queensland; Cancer Council New South Wales; Cancer Council South Australia; Cancer Council Tasmania; Cancer Foundation of Western Australia; the Cancer Institute of New Jersey; Cancer Research UK (C490/A6187, C490/A10119, C490/A10124, C536/A13086, C536/A6689); the Celma Mastry Ovarian Cancer Foundation ; the Danish Cancer Society (94-222-52); the ELAN Program of the University of Erlangen-Nuremberg; the Eve Appeal; the Helsinki University Central Hospital Research Fund; Helse Vest; Imperial Experimental Cancer Research Centre (C1312/A15589); the Norwegian Cancer Society; the Norwegian Research Council; the Ovarian Cancer Research Fund; Nationaal Kankerplan of Belgium; Grant-in-Aid for the Third Term Comprehensive 10-Year Strategy for Cancer Control from the Ministry of Health Labour and Welfare of Japan; the L & S Milken Foundation; the Polish Ministry of Science and Higher Education (4 PO5C 028 14, 2 PO5A 068 27); Malaysian Ministry of Higher Education (UM.C/HlR/MOHE/06) and Cancer Research Initiatives Foundation; the Roswell Park Cancer Institute Alliance Foundation; the US National Cancer Institute (K07-CA095666, K07-CA143047, K22-CA138563, N01-CN55424, N01-PC067010, N01-PC035137, P01-CA017054, P01-CA087696, P30-CA15083, P50-CA105009, P50-CA136393, R01-CA014089, R01-CA016056, R01-CA017054, R01-CA049449, R01-CA050385, R01-CA054419, R01-CA058598, R01-CA058860, R01-CA061107, R01-CA061132, R01-CA063682, R01-CA064277, R01-CA067262, R01-CA071766, R01-CA074850, R01-CA076016, R01-CA080742, R01-CA080978, R01-CA083918, R01-CA087538, R01-CA092044, R01-095023, R01-CA106414, R01-CA122443, R01-CA112523, R01-CA114343, R01-CA126841, R01-CA136924, R01-CA149429, R03-CA113148, R03-CA115195, R37-CA070867, R37-CA70867, U01-CA069417, U01-CA071966 and Intramural research funds); the US Army Medical Research and Material Command (DAMD17-98-1-8659, DAMD17-01-1-0729, DAMD17-02-1-0666, DAMD17-02-1-0669, W81XWH-10-1-0280); the National Health and Medical Research Council of Australia (199600 and 400281); the German Federal Ministry of Education and Research of Germany Programme of Clinical Biomedical Research (01 GB 9401); the state of Baden-Württemberg through Medical Faculty of the University of Ulm (P.685); the Minnesota Ovarian Cancer Alliance; the Mayo Foundation; the Fred C. and Katherine B. Andersen Foundation; the Lon V. Smith Foundation (LVS-39420); the Oak Foundation; the OHSU Foundation; the Mermaid I project; the Rudolf-Bartling Foundation; the UK National Institute for Health Research Biomedical Research Centres at the University of Cambridge, Imperial College London, University College Hospital “Womens Health Theme” and the Royal Marsden Hospital; WorkSafeBC.
This study would not have been possible without the contributions of the following: A. M. Dunning, P. Hall (COGS); D. C. Tessier, F. Bacot, D. Vincent, S. LaBoissière and F. Robidoux and the staff of the genotyping unit, (Genome Quebec); D. C. Whiteman, P. M. Webb, A. C. Green, N. K. Hayward, P. G. Parsons, D. M. Purdie, B. M. Smithers, D. Gotley, A. Clouston, I. Brown, S. Moore. K. Harrap, T. Sadkowski, S. O’Brien, E. Minehan, D. Roffe, S. O’Keefe, S. Lipshut, G. Connor, H. Berry, F. Walker, T. Barnes, J. Thomas, M. Connard, L. Bowes, M-R. Malt, J. White, C. Mosse, N. Tait, C. Bambach, A. Biankan, R. Brancatisano, M. Coleman, M. Cox, S. Deane, G. L. Falk, J. Gallagher, M. Hollands, T. Hugh, D. Hunt, J. Jorgensen, C. Martin, M. Richardson, G. Smith, R. Smith, D. Storey, J. Avramovic, J. Croese, J. D’Arcy, S. Fairley, J. Hansen, J. Masson, L. Nathanson, B. O’Loughlin, L. Rutherford, R. Turner, M. Windsor, J. Bessell, P. Devitt, G. Jamieson, D. Watson, S. Blamey, A. Boussioutas, R. Cade, G. Crosthwaite, I. Faragher, J. Gribbin, G. Hebbard, G. Kiroff, B. Mann, R. Millar, P. O’Brien, R. Thomas, S. Wood, S. Archer, K. Faulkner, J. Hamdorf (ACS); R. Stuart-Harris, F. Kirsten, J. Rutovitz, P. Clingan, A.Glasgow, A. Proietto, S. Braye, G. Otton, J. Shannon, T. Bonaventura, J. Stewart, S. Begbie, M. Friedlander, D. Bell, S. Baron-Hay, G. Gard, D. Nevell, N. Pavlakis, S. Valmadre, B. Young, C Camaris, R. Crouch, L. Edwards, N. Hacker, D. Marsden, G. Robertson, P. Beale, J. Beith, J. Carter, C. Dalrymple, R. Houghton, P. Russell, L. Anderson, M. Links, J. Grygiel, J. Hill, A. Brand, K. Byth, R. Jaworski, P. Harnett, R. Sharma, .G Wain, D. Purdie, D. Whiteman, B. Ward, D. Papadimos, A. Crandon, M. Cummings, K. Horwood. A. Obermair, L. Perrin, D. Wyld, J. Nicklin, M. Davy, M. K. Oehler, C. Hall, T. Dodd, T. Healy, K. Pittman, D. Henderson, J. Miller, J. Pierdes, A. Achan, P. Blomfield, D. Challis, R. McIntosh, A. Parker, B. Brown, R. Rome, D. Allen, P. Grant, S. Hyde, R. Laurie, M. Robbie, D. Healy, T. Jobling, T. Manolitsas, J. McNealage, P Rogers, B. Susil, E. Sumithran, I. Simpson, I. Haviv, K. Phillips, D. Rischin, S. Fox, D. Johnson, S. Lade, P. Waring, M. Loughrey, N. O’Callaghan, B. Murray, L. Mileshkin, P. Allan; V. Billson, J. Pyman, D. Neesham, M. Quinn, A. Hamilton, C. Underhill, R. Bell, L. F Ng, R. Blum, V. Ganju, I. Hammond, C. Stewart, Y. Leung, M. Buck, N. Zeps (ACS); G. Peuteman, T. Van Brussel and D. Smeets (BEL); U. Eilber and T. Koehler (GER); L. Gacucova (HMO); P. Schürmann, F. Kramer, T.-W. Park-Simon, K. Beer-Grondke and D. Schmidt (HJO); G.S. Keeney, S. Windebank, C. Hilker and J. Vollenweider (MAY); Fiona Bruinsma; the state cancer registries of AL, AZ, AR, CA, CO, CT, DE, FL, GA, HI, ID, IL, IN, IA, KY, LA, ME, MD, MA, MI, NE, NH, NJ, NY, NC, ND, OH, OK, OR, PA, RI, SC, TN, TX, VA, WA, and WYL (NHS); L. Paddock, M. King, U. Chandran, A. Samoila, and Y. Bensman (NJO); M. Sherman, A. Hutchinson, N. Szeszenia-Dabrowska, B. Peplonska, W. Zatonski, A. Soni, P. Chao and M. Stagner (POL); ); C. Luccarini, the SEARCH team and ECRIC (SEA); the Scottish Gynaecological Clinical Trails group and SCOTROC1 investigators (SRO); W-H. Chow (SWH); Information about TCGA and the investigators and institutions who constitute the TCGA research network can be found at http://cancergenome.nih.gov/(TCGA); I. Jacobs, M. Widschwendter, E. Wozniak, N. Balogun, A. Ryan and J. Ford (UKO); Carole Pye (UKR); a full list of the investigators who contributed to the generation of the WTCCC data is available from http://www.wtccc.org.uk/(WTCCC).
Footnotes
Disclosure of Potential Conflicts of Interest
Dr. Fasching reports receiving commercial research support from Amgen and Novartis and honoraria from speakers’ bureaus from Amgen, Novartis, Pfizer, Celgene, Roche, and GSK. Dr. Menon reports having a commercial research grant from and ownership interest in Abcodia.
References
- 1.Pharoah PDP, Tsai Y-Y, Ramus SJ, Phelan CM, Goode EL, Lawrenson K, et al. GWAS meta-analysis and replication identifies three new susceptibility loci for ovarian cancer. Nat Genet. 2013;45:362–70. 370e1–2. doi: 10.1038/ng.2564. [DOI] [PMC free article] [PubMed] [Google Scholar]
- 2.Permuth-Wey J, Lawrenson K, Shen HC, Velkova A, Tyrer JP, Chen Z, et al. Identification and molecular characterization of a new ovarian cancer susceptibility locus at 17q21.31. Nat Commun. 2013;4:1627. doi: 10.1038/ncomms2613. [DOI] [PMC free article] [PubMed] [Google Scholar]
- 3.Bojesen SE, Pooley KA, Johnatty SE, Beesley J, Michailidou K, Tyrer JP, et al. Multiple independent variants at the TERT locus are associated with telomere length and risks of breast and ovarian cancer. Nat Genet. 2013;45:371–84. 384e1–2. doi: 10.1038/ng.2566. [DOI] [PMC free article] [PubMed] [Google Scholar]
- 4.Bolton KL, Tyrer J, Song H, Ramus SJ, Notaridou M, Jones C, et al. Common variants at 19p13 are associated with susceptibility to ovarian cancer. Nat Genet. 2010;42:880–4. doi: 10.1038/ng.666. [DOI] [PMC free article] [PubMed] [Google Scholar]
- 5.Goode EL, Chenevix-Trench G, Song H, Ramus SJ, Notaridou M, Lawrenson K, et al. A genome-wide association study identifies susceptibility loci for ovarian cancer at 2q31 and 8q24. Nat Genet. 2010;42:874–9. doi: 10.1038/ng.668. [DOI] [PMC free article] [PubMed] [Google Scholar]
- 6.Song H, Ramus SJ, Tyrer J, Bolton KL, Gentry-Maharaj A, Wozniak E, et al. A genome-wide association study identifies a new ovarian cancer susceptibility locus on 9p22.2. Nat Genet. 2009;41:996–1000. doi: 10.1038/ng.424. [DOI] [PMC free article] [PubMed] [Google Scholar]
- 7.Couch FJ, Wang X, McGuffog L, Lee A, Olswold C, Kuchenbaecker KB, et al. Genome-wide association study in BRCA1 mutation carriers identifies novel loci associated with breast and ovarian cancer risk. PLoS Genet. 2013;9:e1003212. doi: 10.1371/journal.pgen.1003212. [DOI] [PMC free article] [PubMed] [Google Scholar]
- 8.Antoniou AC, Easton DF. Risk prediction models for familial breast cancer. Futur Oncol. 2006;2:257–74. doi: 10.2217/14796694.2.2.257. [DOI] [PubMed] [Google Scholar]
- 9.Michailidou K, Hall P, Gonzalez-Neira A, Ghoussaini M, Dennis J, Milne RL, et al. Large-scale genotyping identifies 41 new loci associated with breast cancer risk. Nat Genet. 2013;45:353–61. 361e1–2. doi: 10.1038/ng.2563. [DOI] [PMC free article] [PubMed] [Google Scholar]
- 10.Fridley BL, Biernacka JM. Gene set analysis of SNP data: benefits, challenges, and future directions. Eur J Hum Genet. 2011;19:837–43. doi: 10.1038/ejhg.2011.57. [DOI] [PMC free article] [PubMed] [Google Scholar]
- 11.Khatri P, Sirota M, Butte AJ. Ten years of pathway analysis: current approaches and outstanding challenges. PLoS Comput Biol. 2012;8:e1002375. doi: 10.1371/journal.pcbi.1002375. [DOI] [PMC free article] [PubMed] [Google Scholar]
- 12.Califano A, Butte AJ, Friend S, Ideker T, Schadt E. Leveraging models of cell regulation and GWAS data in integrative network-based association studies. Nat Genet. 2012;44:841–7. doi: 10.1038/ng.2355. [DOI] [PMC free article] [PubMed] [Google Scholar]
- 13.Li Q, Seo J-H, Stranger B, McKenna A, Pe’er I, Laframboise T, et al. Integrative eQTL-based analyses reveal the biology of breast cancer risk loci. Cell. 2013;152:633–41. doi: 10.1016/j.cell.2012.12.034. [DOI] [PMC free article] [PubMed] [Google Scholar]
- 14.Smemo S, Tena JJ, Kim K-H, Gamazon ER, Sakabe NJ, Gómez-Marín C, et al. Obesity-associated variants within FTO form long-range functional connections with IRX3. Nature. 2014;507:371–5. doi: 10.1038/nature13138. [DOI] [PMC free article] [PubMed] [Google Scholar]
- 15.Sur IK, Hallikas O, Vähärautio A, Yan J, Turunen M, Enge M, et al. Mice lacking a Myc enhancer that includes human SNP rs6983267 are resistant to intestinal tumors. Science. 2012;338:1360–3. doi: 10.1126/science.1228606. [DOI] [PubMed] [Google Scholar]
- 16.Small KS, Hedman AK, Grundberg E, Nica AC, Thorleifsson G, Kong A, et al. Identification of an imprinted master trans regulator at the KLF14 locus related to multiple metabolic phenotypes. Nat Genet. 2011;43:561–4. doi: 10.1038/ng.833. [DOI] [PMC free article] [PubMed] [Google Scholar]
- 17.Wang C, Sandling JK, Hagberg N, Berggren O, Sigurdsson S, Karlberg O, et al. Genome-wide profiling of target genes for the systemic lupus erythematosus-associated transcription factors IRF5 and STAT4. Ann Rheum Dis. 2013;72:96–103. doi: 10.1136/annrheumdis-2012-201364. [DOI] [PubMed] [Google Scholar]
- 18.Parker HJ, Piccinelli P, Sauka-Spengler T, Bronner M, Elgar G. Ancient Pbx-Hox signatures define hundreds of vertebrate developmental enhancers. BMC Genomics. 2011;12:637. doi: 10.1186/1471-2164-12-637. [DOI] [PMC free article] [PubMed] [Google Scholar]
- 19.Faith JJ, Hayete B, Thaden JT, Mogno I, Wierzbowski J, Cottarel G, et al. Large-scale mapping and validation of Escherichia coli transcriptional regulation from a compendium of expression profiles. PLoS Biol. 2007;5:e8. doi: 10.1371/journal.pbio.0050008. [DOI] [PMC free article] [PubMed] [Google Scholar]
- 20.Allocco DJ, Kohane IS, Butte AJ. Quantifying the relationship between co-expression, co-regulation and gene function. BMC Bioinformatics. 2004;5:18. doi: 10.1186/1471-2105-5-18. [DOI] [PMC free article] [PubMed] [Google Scholar]
- 21.The Cancer Genome Atlas Research Network. Integrated genomic analyses of ovarian carcinoma. Nature. 2011;474:609–15. doi: 10.1038/nature10166. [DOI] [PMC free article] [PubMed] [Google Scholar]
- 22.Sur I, Tuupanen S, Whitington T, Aaltonen LA, Taipale J. Lessons from functional analysis of genome-wide association studies. Cancer Res. 2013;73:4180–4. doi: 10.1158/0008-5472.CAN-13-0789. [DOI] [PubMed] [Google Scholar]
- 23.Freedman ML, Monteiro ANA, Gayther SA, Coetzee GA, Risch A, Plass C, et al. Principles for the post-GWAS functional characterization of cancer risk loci. Nat Genet. 2011;43:513–8. doi: 10.1038/ng.840. [DOI] [PMC free article] [PubMed] [Google Scholar]
- 24.Saccone SF, Hinrichs AL, Saccone NL, Chase GA, Konvicka K, Madden PAF, et al. Cholinergic nicotinic receptor genes implicated in a nicotine dependence association study targeting 348 candidate genes with 3713 SNPs. Hum Mol Genet. 2007;16:36–49. doi: 10.1093/hmg/ddl438. [DOI] [PMC free article] [PubMed] [Google Scholar]
- 25.Segrè AV, Groop L, Mootha VK, Daly MJ, Altshuler D. Common inherited variation in mitochondrial genes is not enriched for associations with type 2 diabetes or related glycemic traits. PLoS Genet. 2010;6:e1001058. doi: 10.1371/journal.pgen.1001058. [DOI] [PMC free article] [PubMed] [Google Scholar]
- 26.Vaquerizas JM, Kummerfeld SK, Teichmann SA, Luscombe NM. A census of human transcription factors: function, expression and evolution. Nat Rev Genet. 2009;10:252–63. doi: 10.1038/nrg2538. [DOI] [PubMed] [Google Scholar]
- 27.Bahcall O. Shared susceptibility loci for breast, prostate and ovarian cancers. Nat Genet. 2013 [Google Scholar]
- 28.The Cancer Genome Atlas. Data Portal: Integrated Genomic Analyses of Ovarian Carcinoma. [cited: 2015 Apr 15] Available from: https//tcga-data.nci.nih.gov/docs/publications/ov_2011.
- 29.Margolin AA, Nemenman I, Basso K, Wiggins C, Stolovitzky G, Dalla Favera R, et al. ARACNE: an algorithm for the reconstruction of gene regulatory networks in a mammalian cellular context. BMC Bioinformatics. 2006;7:S7. doi: 10.1186/1471-2105-7-S1-S7. [DOI] [PMC free article] [PubMed] [Google Scholar]
- 30.Subramanian A, Tamayo P, Mootha VK, Mukherjee S, Ebert BL, Gillette MA, et al. Gene set enrichment analysis: a knowledge-based approach for interpreting genome-wide expression profiles. Proc Natl Acad Sci U S A. 2005;102:15545–50. doi: 10.1073/pnas.0506580102. [DOI] [PMC free article] [PubMed] [Google Scholar]
- 31.Smoot ME, Ono K, Ruscheinski J, Wang P-L, Ideker T. Cytoscape 2.8: new features for data integration and network visualization. Bioinformatics. 2011;27:431–2. doi: 10.1093/bioinformatics/btq675. [DOI] [PMC free article] [PubMed] [Google Scholar]
- 32.Purcell S, Neale B, Todd-Brown K, Thomas L, Ferreira MAR, Bender D, et al. PLINK: a tool set for whole-genome association and population-based linkage analyses. Am J Hum Genet. 2007;81:559–75. doi: 10.1086/519795. [DOI] [PMC free article] [PubMed] [Google Scholar]
- 33.Rossin EJ, Lage K, Raychaudhuri S, Xavier RJ, Tatar D, Benita Y, et al. Proteins encoded in genomic regions associated with immune-mediated disease physically interact and suggest underlying biology. PLoS Genet. 2011;7:e1001273. doi: 10.1371/journal.pgen.1001273. [DOI] [PMC free article] [PubMed] [Google Scholar]
- 34.Tothill RW, Tinker AV, George J, Brown R, Fox SB, Lade S, et al. Novel molecular subtypes of serous and endometrioid ovarian cancer linked to clinical outcome. Clin Cancer Res. 2008;14:5198–208. doi: 10.1158/1078-0432.CCR-08-0196. [DOI] [PubMed] [Google Scholar]
- 35.The Cancer Genome Atlas. Data Portal: Prognostically relevant gene signatures of high-grade serous ovarian carcinoma. doi: 10.1172/JCI65833. [cited: 2015 Apr 15] Available from: https//tcga-data.nci.nih.gov/tcgafiles/ftp_auth/distro_ftpusers/anonymous/other/publications/ov_exp. [DOI] [PMC free article] [PubMed]
- 36.Zambelli F, Pesole G, Pavesi G. Pscan: finding over-represented transcription factor binding site motifs in sequences from co-regulated or co-expressed genes. Nucleic Acids Res. 2009;37:W247–52. doi: 10.1093/nar/gkp464. [DOI] [PMC free article] [PubMed] [Google Scholar]
- 37.Matys V, Kel-Margoulis OV, Fricke E, Liebich I, Land S, Barre-Dirrie A, et al. TRANSFAC and its module TRANSCompel: transcriptional gene regulation in eukaryotes. Nucleic Acids Res. 2006;34:D108–10. doi: 10.1093/nar/gkj143. [DOI] [PMC free article] [PubMed] [Google Scholar]
- 38.Goh K-I, Cusick ME, Valle D, Childs B, Vidal M, Barabási A-L. The human disease network. Proc Natl Acad Sci U S A. 2007;104:8685–90. doi: 10.1073/pnas.0701361104. [DOI] [PMC free article] [PubMed] [Google Scholar]
- 39.Svingen T, Tonissen KF. Hox transcription factors and their elusive mammalian gene targets. Heredity (Edinb) 2006;97:88–96. doi: 10.1038/sj.hdy.6800847. [DOI] [PubMed] [Google Scholar]
- 40.Di Pietro M, Lao-Sirieix P, Boyle S, Cassidy A, Castillo D, Saadi A, et al. Evidence for a functional role of epigenetically regulated midcluster HOXB genes in the development of Barrett esophagus. Proc Natl Acad Sci U S A. 2012;109:9077–82. doi: 10.1073/pnas.1116933109. [DOI] [PMC free article] [PubMed] [Google Scholar]
- 41.Rubin E, Wu X, Zhu T, Cheung JCY, Chen H, Lorincz A, et al. A role for the HOXB7 homeodomain protein in DNA repair. Cancer Res. 2007;67:1527–35. doi: 10.1158/0008-5472.CAN-06-4283. [DOI] [PubMed] [Google Scholar]
- 42.Naora H, Yang YQ, Montz FJ, Seidman JD, Kurman RJ, Roden RB. A serologically identified tumor antigen encoded by a homeobox gene promotes growth of ovarian epithelial cells. Proc Natl Acad Sci U S A. 2001;98:4060–5. doi: 10.1073/pnas.071594398. [DOI] [PMC free article] [PubMed] [Google Scholar]
- 43.Wu Q, Lothe RA, Ahlquist T, Silins I, Tropé CG, Micci F, et al. DNA methylation profiling of ovarian carcinomas and their in vitro models identifies HOXA9, HOXB5, SCGB3A1, and CRABP1 as novel targets. Mol Cancer. 2007;6:45. doi: 10.1186/1476-4598-6-45. [DOI] [PMC free article] [PubMed] [Google Scholar]
- 44.Perets R, Wyant GA, Muto KW, Bijron JG, Poole BB, Chin KT, et al. Transformation of the fallopian tube secretory epithelium leads to high-grade serous ovarian cancer in Brca;Tp53;Pten models. Cancer Cell. 2013;24:751–65. doi: 10.1016/j.ccr.2013.10.013. [DOI] [PMC free article] [PubMed] [Google Scholar]
- 45.Cheng W, Liu J, Yoshida H, Rosen D, Naora H. Lineage infidelity of epithelial ovarian cancers is controlled by HOX genes that specify regional identity in the reproductive tract. Nat Med. 2005;11:531–7. doi: 10.1038/nm1230. [DOI] [PubMed] [Google Scholar]
- 46.Shen H, Fridley BL, Song H, Lawrenson K, Cunningham JM, Ramus SJ, et al. Epigenetic analysis leads to identification of HNF1B as a subtype-specific susceptibility gene for ovarian cancer. Nat Commun. 2013;4:1628. doi: 10.1038/ncomms2629. [DOI] [PMC free article] [PubMed] [Google Scholar]
- 47.Antoniou AC, Wang X, Fredericksen ZS, McGuffog L, Tarrell R, Sinilnikova OM, et al. A locus on 19p13 modifies risk of breast cancer in BRCA1 mutation carriers and is associated with hormone receptor-negative breast cancer in the general population. Nat Genet. 2010;42:885–92. doi: 10.1038/ng.669. [DOI] [PMC free article] [PubMed] [Google Scholar]
- 48.Köbel M, Kalloger SE, Lee S, Duggan MA, Kelemen LE, Prentice L, et al. Biomarker-based ovarian carcinoma typing: a histologic investigation in the ovarian tumor tissue analysis consortium. Cancer Epidemiol Biomarkers Prev. 2013;22:1677–86. doi: 10.1158/1055-9965.EPI-13-0391. [DOI] [PMC free article] [PubMed] [Google Scholar]
- 49.Cowper-Sal lari R, Zhang X, Wright JB, Bailey SD, Cole MD, Eeckhoute J, et al. Breast cancer risk-associated SNPs modulate the affinity of chromatin for FOXA1 and alter gene expression. Nat Genet. 2012;44:1191–8. doi: 10.1038/ng.2416. [DOI] [PMC free article] [PubMed] [Google Scholar]
- 50.Fletcher MNC, Castro MAA, Wang X, de Santiago I, O’Reilly M, Chin S-F, et al. Master regulators of FGFR2 signalling and breast cancer risk. Nat Commun. 2013;4:2464. doi: 10.1038/ncomms3464. [DOI] [PMC free article] [PubMed] [Google Scholar]
- 51.Lawrenson K, Grun B, Gayther SA. Heterotypic three-dimensional in vitro modeling of stromal-epithelial interactions during ovarian cancer initiation and progression. J Vis Exp. 2012:e4206. doi: 10.3791/4206. [DOI] [PMC free article] [PubMed] [Google Scholar]
Associated Data
This section collects any data citations, data availability statements, or supplementary materials included in this article.