Abstract
Hypothesis
We hypothesize that surface plasmon resonance imaging (SPRi) of interactions between small organic compounds and gold is influenced by the refractive index and chemical structures of the compounds.
Experiments
For the first time we imaged the SPR signals upon interaction of a gold surface with seven compounds representing aromatic, cyclic, short chain, and long chain carbon structures using an array format.
Findings
The refractive index and chemical structures of the tested compounds influenced the sensitivity of detection of the SPR microarray imager. Thus, the array methodology presented herein is suitable for studying interactions of small molecules with a gold surface.
Keywords: Surface plasmon resonance, Gold microarray, Refractive index, Small organic compounds, Adsorption
Graphical abstract
1. Introduction
Adsorption of small organic compounds (SOCs) with gold can facilitate catalyzing certain unique chemical reactions and also help understand the nature of electronic (conductivity) and plasmonic properties of gold for sensitive detection of SOCs.1–6 The objective of the present investigation was to understand the influence of refractive index (RI) and chemical structures of SOCs on adsorption with gold and on detection by an optical imaging microarray system. Results of this study will help with the development of an innovative analytical platform for disease diagnostics and environmental pollution monitoring based on small molecules.
SPRi is an advanced version of conventional SPR that features array-based detection of pixel intensity changes. SPRi offers relatively better throughput than SPR, and image-based analysis and interpretation of results are technically less challenging for molecular screening and sensing applications.7 These features translate to decreased assay time and increased analytical precision from several replicate data points available in a single measurement.8–11 Furthermore, the SPRi technique can be easily scaled up to high density arrays. The simplicity and better throughput of SPRi are also advantageous over methods such as gas chromatography-mass spectrometry.12
Detecting large biomolecules and macromolecules using SPR sensors poses no problem. The challenge lies in the detection of small molecules due to sensitivity limitations, as small molecules cannot induce sufficient changes in RI upon binding to the SPR sensor surface. In this study, we show that depending on the RIs and chemical structures of compounds one can obtain varying extent of detection capabilities controlled by the type and extent of secondary interactions of small molecules with gold surface plasmons.
The SPR technique using polyethylene glycol drop-coated onto a thin silver film on a prism surface has been used to detect hydrocarbons, aldehydes, and alcohols.13 Compounds with a greater number of carbon atoms exhibited better sensitivity than their smaller carbon counterparts. In another study, a nanometric polyimide film was exposed to ethanol. and SPR was measured to detect its presence.14 Construction of gold or silver nanoparticles coated on glass slides (so called “localized SPR”) and their use for sensing vapors of toluene, n-octane, chlorobenzene, m-xylene, and pentanol with limits of detection (LODs) of a few tens of parts per million (ppm) has also been described.2
In this study we examined the influence of direct physical adsorption of certain SOCs onto gold surface plasmons on the resulting detection levels by SPRi. Although SPRi has been preferentially used to study large biomolecular interactions (e.g., protein, antigen, and DNA),15,16 in this study we evaluated the performance characteristics of the gold surface featuring adsorbed small molecules to determine if they could be useful for developing sensing platforms applicable to environmental screening of small molecule exposomes. A future goal is to advance this method for detection of SOCs at clinically and environmentally relevant low levels in complex and real sample matrices, and results of this study provide the basis and fundamental insights needed to move forward.17–19
2. Experimental
2.1 Chemicals, reagents, and apparatus
Seven SOCs with different RIs and chemical structures were analyzed in this study. Ortho-dichlorobenzene (O-DCB), 1-pentanol (P-OH), ethanol (EtOH), and formaldehyde (HCHO) were purchased from Sigma-Aldrich. Acetone (Ac) was purchased from Pharmaco-AAPER. Cyclohexanol (CyHex-OH) and hexanal (Hex-al) were purchased from Fisher Scientific. All solutions of SOCs were prepared in ultrapure water. All experiments were performed using an SPRimager®II array instrument (GWC Technologies, Madison, WI, USA) at room temperature. Glass chips (18 × 18 mm2) coated with 16 gold spots plus a reference spot were used (700 μm spot size, GWC-1000-016). All SPRi difference images (pixel intensities of SOC-adsorbed array spots minus the pixel intensities of water-treated spots containing no SOC) were collected using the software package Digital Optics V++ provided with the instrument. The solubility of O-DCB in water is 140 mg L−1 at 25 °C, and the other compounds are highly water soluble. The LOD was calculated using the following formula20: LOD = Mblank + 3 Sblank, where M is the mean of the blank signals (i.e., ultrapure water with no SOC present) and S is the standard deviation of the blank.
2.2 SOC adsorption and detection procedures
SPRi gold array chips were used without any surface modification to adsorb SOCs. On control spots, only ultrapure water with no added SOC was used. The chip was assembled on a SPRi prism layered with an index matching fluid (GWC Technologies) between the prism and chip. Deionized water was added to all gold spots and a reference image was taken. The water was removed and a solution of SOC was spotted on each array spot (~0.5 μL) and adsorbed for 30 min. During adsorption, array chips were covered with a moisturized beaker to avoid drying of SOC solutions. The SOC-treated array spots were rinsed with water before capturing an image using a charge-coupled-device camera built into the SPRi instrument.
The difference between the two images (before and after SOC adsorption) was calculated to obtain the net increase in SPRi pixel intensity caused by the SOC, which is the extent of the height of each array spot in a 3D image representation. In some experiments, both the control water spots and SOC spots were analyzed within a single array chip. Moreover, SPRi array procedure to measure a range of concentrations of an analyte in a single microarray chip was tested using O-DCB in the concentration range of 0 to 50 ppm. In addition, four compounds, O-DCB, P-OH, HCHO, and Ac, are compared in a single array to demonstrate the multi-analyte detection feature of the SPRi approach for SOCs, which is not available in the conventional SPR that operates either on a single or a dual channel. The average intensity differences and standard deviations for all concentrations were calculated by repeating the measurements three times.
3. Results and Discussion
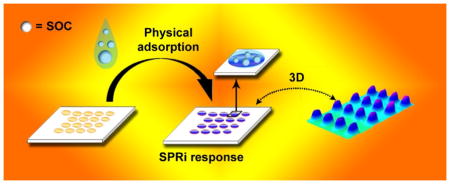
Scheme 1 is a cartoon illustration of the pixel intensity increase when an SOC is adsorbed onto a SPRi gold microarray.
Scheme 1.
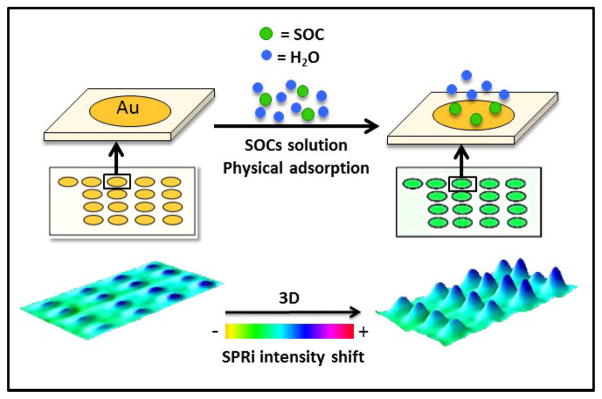
Cartoon representation of an SOC adsorption onto gold microarray spots and imaging of the pixel intensity increase.
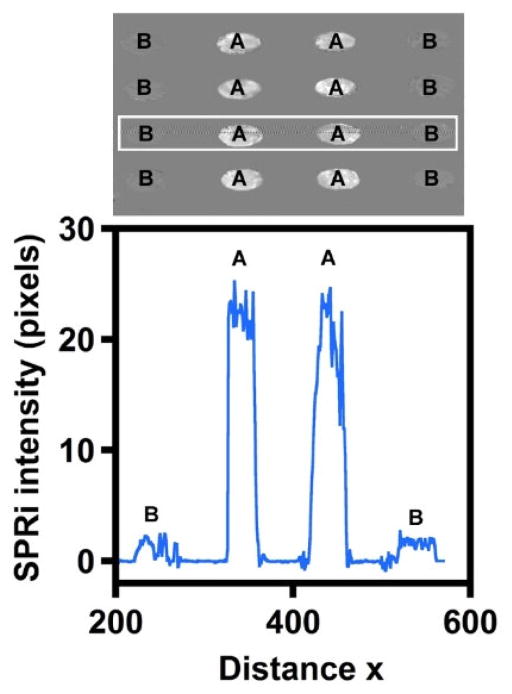
Figure 1 shows the raw difference image data of the microarray adsorbed with either 50 ppm O-DCB (spots A) or pure water (spots B). The intensity of array spots adsorbed with 50 ppm O-DCB is greater than that of the pure water-adsorbed spots. Good reproducibility across the spots is clearly evident from the image. In the line profile plot presented below the image, the x coordinate position corresponds to the position of the spots along the third row in the difference image. The line profile data show a nearly 10-times pixel intensity increase for the adsorption of 50 ppm O-DCB compared to water.
Figure 1.
Representative SPRi difference image and the line profile for the third row in the microarray that shows the intensity increase in the x direction after exposing gold spots to (A) 50 ppm O-DCB and (B) pure water.
Figure 2 shows the 3D representation of SPRi difference images when the chip was exposed to 100, 500, and 1000 ppm concentrations of the HCHO solution. The intensity of microarray spots increased with the increase in concentration of HCHO used for adsorption. The net increase in SPRi pixel intensity (height) with SOC concentration is indicative of the proportionately higher levels of SOC molecules adsorbed on the gold surface.
Figure 2.
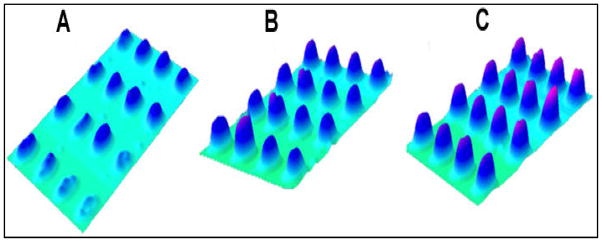
SPRi difference image showing the 3D representation of pixel intensity increase of microarray spots exposed to (A) 100, (B) 500, and (C) 1000 ppm HCHO.
To demonstrate the ability of SPRi to analyze multiple concentrations of an SOC within one assay, we carried out experiments with various concentrations of O-DCB adsorbed onto spots in one microarray chip. Figure 3 shows the 3D difference image for various concentrations of O-DCB detected together in an array and the line profile of SPRi pixel intensity for the second row in the image. The image and the line profile of SPRi responses demonstrate that pixel intensity increases with the concentration of O-DCB from 10 to 50 ppm.
Figure 3.
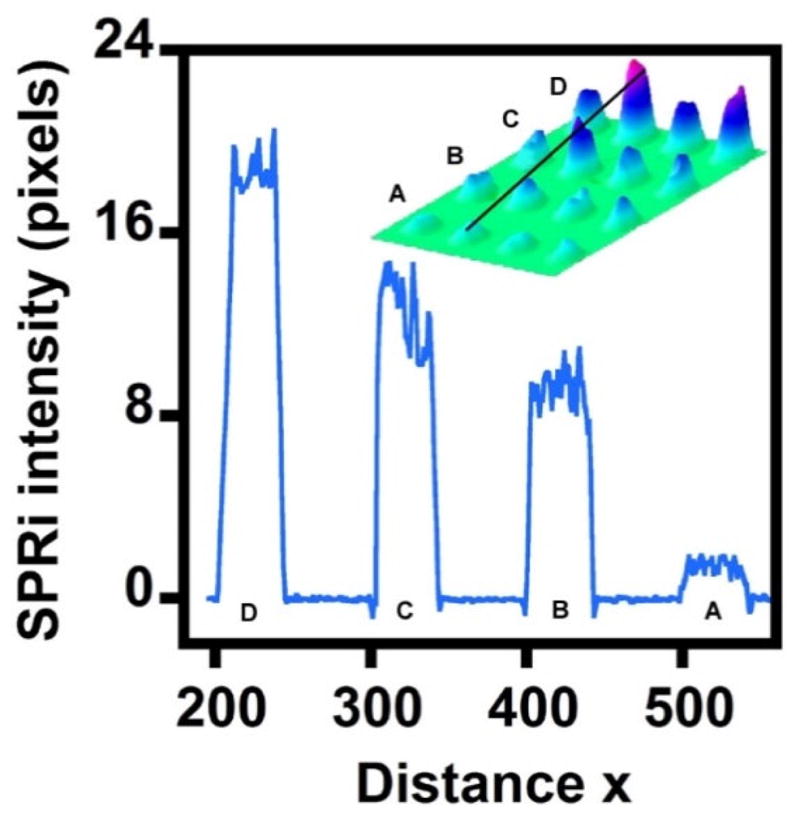
Representative SPRi 3D difference image and the line profile of the second row in the image after exposing gold spots to (A) 0 ppm (only water), (B) 10 ppm, (C) 25 ppm, and (D) 50 ppm O-DCB in the chip.
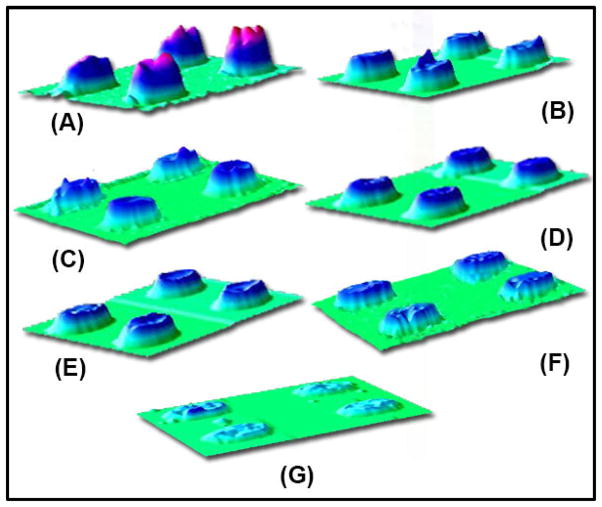
Our next objective was to show the feasibility of detecting multiple SOC analytes in one experiment in the microarray. Figure 4 illustrates the 3D images of signals from seven SOCs. Of these, O-DCB, P-OH, HCHO, and Ac were detected on a single gold array chip, while CyHex-OH, Hex-al, and EtOH were detected on a separate chip. The height of each spot represents the relative extent of pixel intensity increase. Different concentrations of tested SOCs show the differences in the detection sensitivity depending on the SOC type. O-DCB shows the highest intensity at 50 ppm, followed by 100 ppm CyHex-OH, 200 ppm of 1-pentanol, 250 ppm Hex-al, and 1000 ppm for HCHO, Ac, and EtOH. This result suggests that the tested SOC compounds have different sensitivity characteristics.
Figure 4.
3D representations of SPRi gold arrays after adsorption of (A) 50 ppm O-DCB (20.2 pixels), (B) 200 ppm P-OH (13.7 pixels), (C) 100 ppm CyHex-OH (13.2 pixels), (D) 1000 ppm HCHO (10.7 pixels), (E) 1000 ppm Ac (9.6 pixels), (F) 250 ppm Hex-al (8.0 pixels), and (G) 1000 ppm EtOH (5.3 pixels).
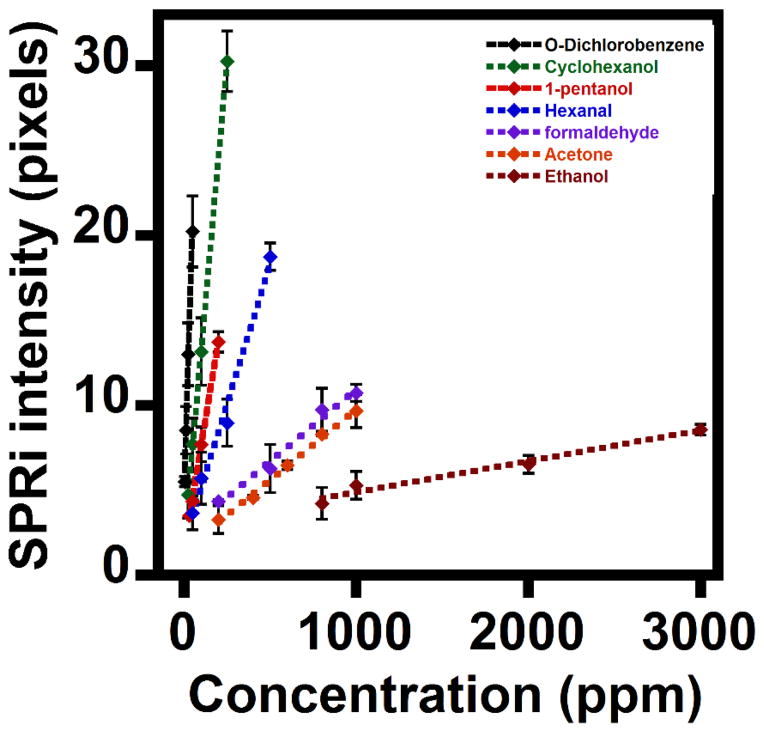
Figure 5 shows the SPRi response plots of all SOCs, which demonstrate the characteristic increases in SPRi pixel intensities with increasing concentrations of SOCs adsorbed onto gold array spots. As the concentration of an SOC increases, the number of adsorbed molecules can increase, thereby enhancing the resulting SPR pixel intensity. The sensitivity (slope of the plot) of the examined SOCs decreased but LOD increased in the following order: O-DCB > CyHex-OH > P-OH > Hex-al > HCHO ≈ Ac > EtOH.
Figure 5.
Plots of SPRi responses upon adsorption of different concentrations of O-DCB, CyHex-OH, P-OH, Hex-al, HCHO, Ac, and EtOH directly onto gold microarray spots (mean ± standard deviation for three replicates).
Table 1 presents the refractive index, molecular weight, LOD, and sensitivity parameters of the tested SOCs adsorbed on the gold array surface. The sensitivity of SPRi even for small variations in the refractive index is clearly evident when comparing HCHO and Ac with EtOH. The following three main conclusions were drawn from the observed SPR signals for the tested compounds: (1) The greater refractive index of O-DCB led to larger pixel intensity changes compared to the other compounds with relatively smaller refractive indices. Similarly, compounds with larger refractive indices could be detected at significantly lower concentrations with higher sensitivity. This reflects the dependency of SPRi responses mainly on the analyte’s refractive index; (2) Among compounds with similar molecular weights but different structures (CyHex-OH vs. Hex-al; cyclic vs. linear), the cyclic structure offered better sensitivity than the linear chain; and (3) Long chain carbon structures showed better sensitivity than the corresponding short chain counterparts (P-OH vs. EtOH, Hex-al vs. HCHO).
Table 1.
Molecular weight, refractive index (Rf) values, LOD, and sensitivity data of the tested SOCs.
| SOC | Molecular weight (g/mol) | Rf | LOD (ppm) | Sensitivity (pixel ppm−1)× 103 |
|---|---|---|---|---|
| O-DCB | 147.01 | 1.551 | 5 | 131.5 |
| CyHex-OH | 100.16 | 1.465 | 23 | 113.2 |
| P-OH | 88.15 | 1.409 | 27 | 61.2 |
| Hex-al | 100.16 | 1.403 | 50 | 32.4 |
| HCHO | 30.03 | 1.375 | 100 | 8.4 |
| Ac | 58.08 | 1.359 | 190 | 8.3 |
| EtOH | 46.07 | 1.361 | 533 | 1.7 |
Thus, in addition to refractive index values, other factors such as the nature and the extent of various possible secondary interactions of SOCs with the gold surface need to be considered, which are controlled by the chemical structures of SOCs. In this regard, aromatic and cyclic compounds and long chain aliphatic groups seem to undergo predominant interactions with the gold surface. Miwa and Arakawa showed that aldehydes with longer carbon chains exhibited better sensitivity than their shorter chain counterparts.13 This implies that the extent of interaction and the inherent refractive index of an adsorbed SOC can synergistically affect the incident SPR wave and associated pixel intensity changes. Figure 5 illustrates that certain levels of selectivity is obtainable for the interaction of gold with certain SOCs, and this property can be exploited further to develop highly sensitive sensors for SOCs that will be useful for environmental and clinical applications. In the case of water insoluble SOCs, one can use non-aqueous solvents and subtract signals for the solvent alone in the SPRi. Thus, the procedure in principle is not limited to water soluble compounds.
4. Conclusions
In summary, we studied the analytical adsorption and detection profiles of various SOCs on the surface of gold microarrays using SPRi. We demonstrated the simplicity and advantages of SPRi over conventional SPR for detection of multiple SOC analytes as well as its ability to measure several concentrations of SOCs in one chip. Greater sensitivity and lower LOD correlated well with the relative magnitudes of refractive indices of SOCs. The values also depended on the nature of secondary interactions between the SOCs and the gold surface, which were influenced by the chemical structures of SOCs.
Acknowledgments
Research reported in this publication was supported, in part, by the National Institute of Diabetes and Digestive and Kidney Diseases of the National Institutes of Health (Award Number R15DK103386), and, in part, by the Oklahoma State University (Start-up and Technology Development funds).
Abbreviations
- SPRi
surface plasmon resonance imaging
- SOC
small organic compound
- O-DCB
ortho-dichlorobenzene
- CyHex-OH
cyclohexanol
- Ac
acetone
- HCHO
formaldehyde
- P-OH
1-pentanol
- Hex-al
Hexanal
- EtOH
Ethanol
- RI
refractive index
- LOD
limit of detection
- ppm
parts per million
Footnotes
The content is solely the responsibility of the authors and does not necessarily represent the official views of the National Institutes of Health.
Publisher's Disclaimer: This is a PDF file of an unedited manuscript that has been accepted for publication. As a service to our customers we are providing this early version of the manuscript. The manuscript will undergo copyediting, typesetting, and review of the resulting proof before it is published in its final citable form. Please note that during the production process errors may be discovered which could affect the content, and all legal disclaimers that apply to the journal pertain.
References
- 1.Ibañez FJ, Zamborini FP. Chemiresistive Sensing of Volatile Organic Compounds with Films of Surfactant-Stabilized Gold and Gold–Silver Alloy Nanoparticles. ACS Nano. 2008;2(8):1543–1552. doi: 10.1021/nn800109q. [DOI] [PubMed] [Google Scholar]
- 2.Cheng C-S, Chen Y-Q, Lu C-J. Organic Vapour Sensing Using Localized Surface Plasmon Resonance Spectrum of Metallic Nanoparticles Self Assemble Monolayer. Talanta. 2007;73(2):358–365. doi: 10.1016/j.talanta.2007.03.058. [DOI] [PubMed] [Google Scholar]
- 3.Monkawa A, Nakagawa T, Sugimori H, Kazawa E, Sibamoto K, Takei T, Haruta M. With High Sensitivity and with Wide-dynamic-range Localized Surface-plasmon Resonance Sensor for Volatile Organic compounds. Sensors and Actuators B: Chemical. 2014;196:1–9. [Google Scholar]
- 4.Xu B, Liu X, Haubrich J, Friend CM. Vapour-phase Gold-surface-mediated Coupling of Aldehydes with Methanol. Nat Chem. 2010;2(1):61–65. doi: 10.1038/nchem.467. [DOI] [PubMed] [Google Scholar]
- 5.Xu B, Haubrich J, Freyschlag CG, Madix RJ, Friend CM. Oxygen-assisted Cross-coupling of Methanol with Alkyl Alcohols on Metallic Gold. Chemical Science. 2010;1(3):310–314. [Google Scholar]
- 6.Xu B, Zhou L, Madix RJ, Friend CM. Highly Selective Acylation of Dimethylamine Mediated by Oxygen Atoms on Metallic Gold Surfaces. Angewandte Chemie International Edition. 2010;49(2):394–398. doi: 10.1002/anie.200905642. [DOI] [PubMed] [Google Scholar]
- 7.Wong C, Olivo M. Surface Plasmon Resonance Imaging Sensors: A Review. Plasmonics. 2014;9(4):809–824. [Google Scholar]
- 8.Spoto G, Minunni M. Surface Plasmon Resonance Imaging: What Next? The Journal of Physical Chemistry Letters. 2012;3(18):2682–2691. doi: 10.1021/jz301053n. [DOI] [PubMed] [Google Scholar]
- 9.Brockman JM, Nelson BP, Corn RM. Surface Plasmon Resonance Imaging Mmeasurements of Ultrathin Organic Filmes. Annual Review of Physical Chemistry. 2000;51(1):41–63. doi: 10.1146/annurev.physchem.51.1.41. [DOI] [PubMed] [Google Scholar]
- 10.Fasoli JB, Corn RM. Surface Enzyme Chemistries for Ultrasensitive Microarray Biosensing with SPR Imaging. Langmuir. 2015 doi: 10.1021/la504797z. [DOI] [PMC free article] [PubMed] [Google Scholar]
- 11.Wong C, Dinish US, Buddharaju K, Schmidt M, Olivo M. Surface-enhanced Raman Scattering (SERS)-based Volatile Organic Compounds (VOCs) Detection Using Plasmonic Bimetallic Nanogap Substrate. Appl Phys A. 2014;117(2):687–692. [Google Scholar]
- 12.Ashley DL, Bonin MA, Cardinali FL, McCraw JM, Holler JS, Needham LL, Patterson DG. Determining Volatile Organic Compounds in Human Blood from a Large Sample Population by Using Purge and trap gas chromatography/mass spectrometry. Analytical Chemistry. 1992;64(9):1021–1029. doi: 10.1021/ac00033a011. [DOI] [PubMed] [Google Scholar]
- 13.Miwa S, Arakawa T. Selective Gas Detection by Means of Surface Plasmon Resonance Sensors. Thin Solid Films. 1996;281–282(0):466–468. [Google Scholar]
- 14.Manera MG, de Julián Fernández C, Maggioni G, Mattei G, Carturan S, Quaranta A, Della Mea G, Rella R, Vasanelli L, Mazzoldi P. Surface Plasmon Resonance Study on the Optical Sensing Properties of Nanometric Polyimide Films to Volatile Organic Vapours. Sensors and Actuators B: Chemical. 2007;120(2):712–718. [Google Scholar]
- 15.Rahn JR, Hallock RB. Antibody Binding to Antigen-coated Substrates Studied with Surface Plasmon Oscillations. Langmuir. 1995;11(2):650–654. [Google Scholar]
- 16.Nilsson P, Persson B, Uhlen M, Nygren PA. Real-Time Monitoring of DNA Manipulations Using Biosensor Technology. Analytical Biochemistry. 1995;224(1):400–408. doi: 10.1006/abio.1995.1057. [DOI] [PubMed] [Google Scholar]
- 17.Miekisch W, Schubert JK, Noeldge-Schomburg GFE. Diagnostic Potential of Breath Analysis—Focus on Volatile Organic Compounds. Clinica Chimica Acta. 2004;347(1–2):25–39. doi: 10.1016/j.cccn.2004.04.023. [DOI] [PubMed] [Google Scholar]
- 18.Queralto N, Berliner AN, Goldsmith B, Martino R, Rhodes P, Lim SH. Detecting Cancer by Breath Volatile Organic Compound Analysis: A Review of Array-based Sensors. Journal of Breath Research. 2014;8(2):027112. doi: 10.1088/1752-7155/8/2/027112. [DOI] [PubMed] [Google Scholar]
- 19.Mølhave L, Clausen G, Berglund B, De Ceaurriz J, Kettrup A, Lindvall T, Maroni M, Pickering AC, Risse U, Rothweiler H, Seifert B, Younes M. Total Volatile Organic Compounds (TVOC) in Indoor Air Quality Investigations. Indoor Air. 1997;7(4):225–240. [Google Scholar]
- 20.Long GL, Winefordner JD. Limit of Detection. A Closer Look at the IUPAC Definition. Analytical Chemistry. 1983;55(7):712A–724A. [Google Scholar]


