

Abstract
Biological soil crusts (biocrusts) colonize plant interspaces in many drylands and are critical to soil nutrient cycling. Multiple climate change and land use factors have been shown to detrimentally impact biocrusts on a macroscopic (i.e., visual) scale. However, the impact of these perturbations on the bacterial components of the biocrusts remains poorly understood. We employed multiple long-term field experiments to assess the impacts of chronic physical (foot trampling) and climatic changes (2°C soil warming, altered summer precipitation [wetting], and combined warming and wetting) on biocrust bacterial biomass, composition, and metabolic profile. The biocrust bacterial communities adopted distinct states based on the mechanism of disturbance. Chronic trampling decreased biomass and caused small community compositional changes. Soil warming had little effect on biocrust biomass or composition, while wetting resulted in an increase in the cyanobacterial biomass and altered bacterial composition. Warming combined with wetting dramatically altered bacterial composition and decreased Cyanobacteria abundance. Shotgun metagenomic sequencing identified four functional gene categories that differed in relative abundance among the manipulations, suggesting that climate and land use changes affected soil bacterial functional potential. This study illustrates that different types of biocrust disturbance damage biocrusts in macroscopically similar ways, but they differentially impact the resident soil bacterial communities, and the communities' functional profiles can differ depending on the disturbance type. Therefore, the nature of the perturbation and the microbial response are important considerations for management and restoration of drylands.
INTRODUCTION
Dryland ecosystems naturally experience low precipitation, large diel and seasonal temperature fluctuations, and high climatic variability (1). Although adapted to widely varying conditions, components of these ecosystems are sensitive to small environmental changes and may be slow to recover from disturbances (2). Predicting the response of dryland ecosystems to a changing environment is a significant challenge because multiple perturbations, such as land use changes and regional climate shifts, occur simultaneously. Increased herbivory, recreation, and energy/mining activities have altered surface soil conditions in drylands, with significant ecological impacts (2–4). In addition, climate and land use change can act in concert to affect these regions. For example, drylands across the southwestern United States are currently experiencing shrub expansion at the expense of local grasses, a situation attributed to a combination of increased herbivory and rising temperatures (5, 6). Precipitation patterns in the region, particularly the summer monsoons that deliver up to 35% of annual precipitation, are also changing (7, 8). Thus, alterations in land use, coupled with regional climate changes, will likely push dryland ecosystems into new ecological states of unknown composition and function.
Biological soil crusts (biocrusts) are surface soil microbial mats that are dominated by photosynthetic and diazotrophic Cyanobacteria and can account for up to 70% of surface cover of dryland soils (9). These communities provide many important ecosystem services, such as carbon and nitrogen fixation, soil stabilization, and water retention (10–12). Long-term field experiments established on the Colorado Plateau, UT, USA, are being used to test the effects of long-term physical disturbance, soil warming, and altered precipitation on surface soil communities (4, 13–16). Studies in drylands have shown that chronic physical disturbances, induced through mechanisms such as increased grazing, have severe detrimental effects on biocrusts (2). The consequences of this reduction in biocrust cover include increased erosion, with up to 35 times more dust production than that from areas with mature biocrusts (17). Deteriorations in biocrust cover can also reduce landscape water retention, even leading to the death of downslope plants (18). Precipitation patterns and soil water loading are also a significant force in shaping biocrusts (19). Rainfall frequency is often the largest predictor of biocrust presence and composition (20), and experimental manipulation of rainfall regimes results in loss of biocrust cover, changes in composition, and decreased photosynthetic performance (15). As biocrusts often occur in ecosystems that experience large temperature variations, biocrusts are generally resilient to small temperature changes (14). However, large temperature shifts, such as those along large latitudinal gradients, have been shown to alter the compositions of the dominant cyanobacterial populations that make up the bulk of the biomass in biocrusts (21). Taken together, these observations suggest that biocrusts are susceptible to a variety of disturbances. Understanding the mechanisms and consequences of these disturbances will be critical to generate effective management and restoration strategies.
Previous work at the sites employed in this study showed that chronic physical disturbance resulted in a loss of biocrust integrity, decreased macroscopic biomass as assessed by visual biocrust cover, and altered soil bacterial composition. Reductions of cyanobacterial abundance were in the range of 25% to 65% as measured by both chlorophyll a concentrations and the relative abundances of Cyanobacteria in 16S rRNA gene sequence libraries (4). Two years of altered precipitation treatment (both alone and in combination with soil warming) had a dramatic negative effect on the biocrust bacteria and mosses (13, 14). Significant declines in Cyanobacteria biomass and soil chlorophyll a pigment concentration were noted in the two manipulations, with patches of visibly bare soils in places that had previously been covered by well-developed biocrusts, representing measured cyanobacterial declines of 75% to 95% (13, 14). While the manifestations of physical trampling and altered precipitation induced large declines in the dominant cyanobacterial populations and the disturbances appeared similar at the visual-assessment scale, it is unclear if these disturbances drive the soil microbial communities to similar or distinct states. A study employing parallel measurements and standardized methods is needed to perform this comparison.
We used these long-term field experiments to compare and contrast the consequences of different physical disturbances and climate manipulations, which appeared to effect similar manifestations at the visual scale on the biomass, bacterial community structure, and functional potential of the biocrust bacterial communities. We employed multiple assays (DNA and chlorophyll a concentration and bacterial 16S rRNA gene and cyanobacterial 16S rRNA gene quantitative PCR [qPCR]) to track shifts in biocrust biomass. Sequencing of bacterial 16S rRNA was used to determine the taxonomic compositions of the biocrust bacterial communities, and shotgun metagenome sequencing was employed to interrogate the functional and metabolic potential of dryland biocrust communities that had been exposed to long-term manipulations.
MATERIALS AND METHODS
Field collection.
Three long-term experiments located in undisturbed natural dryland landscapes were used for this study. The effects of chronic physical disturbance by gentle, annual foot trampling (T) were tested at two sites, one located in Arches National Park (termed Arches here; World Geodetic System 1984 [WGS84], 38°43′35.83″N, 109°32′36.3″W) and one in the Island in the Sky (ISKY) district of Canyonlands National Park (WGS84, 38°27′27.21″N, 109°32′27.93″W), UT, USA. The two study sites were located in Coleogyne ramosissima (blackbrush) shrubland and harbored biocrusts that differed in development and composition of lichens and cyanobacteria, in that cyanobacteria were more abundant and developed at the ISKY site (4). The third site, Castle Valley, UT, USA (termed CV here; WGS84, 38°40′29.5″N, 109°49′58.7″W), was about 10 km from the Arches and ISKY sites. Here, the effects of year-round warming and the altered frequency of summer precipitation were tested in a long-term field experiment in a natural grassland (13, 14, 16). Increased warming with infrared (IR) lamps was delivered to five replicate 5-m2 plots, resulting in an approximately 2°C soil warming to a depth of 5 cm. Altered precipitation (wetting [W]) was delivered as 1.2-mm water pulses (∼half of an average rainfall event) in an average of 35 events during the summer months, resulting in an approximate 4-fold increase in the number of small precipitation events. Separate soil plots received year-round warming and altered precipitation treatments in combination (abbreviated IRW). The manipulations employed in these studies were within the range of climate or land use changes already occurring in these regions or predicted to occur within the next few decades (8). Control plots (C) consisted of untreated plots with a control (nonenergized) IR lamp housing.
Samples were collected from the Arches site on 20 September 2011, 12 days after plots were last trampled, and at the ISKY site on 22 October 2011, 43 days after a trampling event. Both trampled sites (Arches and ISKY) received a cumulative 16 years of annual spring trampling treatments. At the CV site, samples were collected on 21 September 2011 after 6 years of treatment. At each field site, triplicate surface soil samples were collected from each treatment, in each of two of the larger field plots, resulting in a total of six field replicate samples per experimental treatment and eight treatments. Samples were collected away from plant root zones and did not contain visible plant biomass. Soil samples were collected with a small sterile weighing spatula. For plots with well-established biocrusts, samples consisted of the upper ca. 2 cm of soil, defined as the soil bound together by the biocrusts. For plots without developed biocrusts, soil was sampled to a similar depth (ca. 2 cm). Each sample consisted of an approximately 10-cm2 area of soil. Soil sampling was performed in a regular quadrat system to ensure that samples were collected from sites that had not been previously sampled. All soils were stored on dry ice and transported to Los Alamos National Laboratory, where they were stored at −80°C until processing.
Biocrust biomass analyses.
Total extracted DNA was used as a proxy for total biocrust biomass that included bacteria, fungi, and other microbiota. DNA was extracted from duplicate 0.5-g soil samples using the MP Biomedicals FastDNA spin kit (Solon, OH) with standard protocols. Following extraction, DNA aliquots were pooled and quantified using the Quant-iT PicoGreen double-stranded DNA (dsDNA) assay kit (Invitrogen, Carlsbad, CA). Quantitative PCR (qPCR) measured the abundance of bacterial 16S rRNA genes and was used as a proxy for total bacterial biomass. Bacterial qPCR was performed with primers EUB 338 (5′-ACTCCTACGGGAGGCAGCAG-3′) (22) and EUB 518 (5′-ATTACCGCGGCTGCTGG-3′), which target the V2 and V3 variable regions (23), and previously described amplification conditions (24). Chlorophyll a concentrations were used as a measure of Cyanobacteria biomass (25) and were determined by the procedure described by Castle et al. (26). Cyanobacteria qPCR measured the abundance of Cyanobacteria 16S rRNA genes, acting as a secondary measure of cyanobacterial biomass. The Cyanobacteria qPCR was performed with primers that target the V2 to V4 variable regions, using CYA 359 (5′-GGGGAATYTTCCGCAATGGG-3′) and an equimolar mixture of CYA-781RA (5′-GACTACTGGGGTATCTAATCCCATT-3′) and CYA-781RB (5′-GACTACAGGGGTATCTAATCCCTTT-3′) with reaction mixtures, standards, and thermocycling conditions as previously described (27, 28). Analysis of variance (ANOVA) was used for treatment comparisons of the DNA, chlorophyll a, and qPCR data sets, followed by pairwise t tests (Arches or ISKY, where two treatments were performed) or Tukey's honestly significant difference (HSD) mean separation procedure (CV experiment, where four treatments were performed) using the JMP software package. P values from the comparisons at each site are tabulated in Table S1 in the supplemental material.
Biocrust bacterial community taxonomic composition.
The taxonomic composition of the bacterial community was assessed using 16S rRNA gene sequencing. The DNA templates from each sample were normalized to 1 ng μl−1, and gene fragments were amplified with the primers V5-forward (5′-RGGATTAGATACCC-3′) and V6-reverse (5′-CGACRRCCATGCANCACCT-3′) (29), with 8-bp barcodes included on the reverse primer for sample indexing (30). The amplification and cycling conditions were as described previously (24). Amplicon sequencing was performed using 454 FLX titanium chemistry.
The 16S rRNA sequence data sets were processed in the mothur software package (v.1.23.1) (31). Sequences were quality checked and processed according to previously described protocols (32, 33). Taxonomic classification of the 16S rRNA sequences was performed with the Bayesian classifier against the SILVA (34) bacterial taxonomy (31, 32) as implemented in mothur. All classifications (phyla and genus) are based on confidence values of ≥70%. Statistically significant differences in the relative abundances of phylum-level bins were identified in the STAMP software package (35) using ANOVA corrected for multiple tests employing Storey's false discovery rate (FDR) method. Nonmetric multidimensional scaling (NMDS) analyses were performed on genus-level taxonomic bins in the 16S rRNA gene data sets. Relative abundance data were imported into mothur, and NMDS was calculated based on the Bray-Curtis distance metric and 500 NMDS iterations. Analysis of similarity (ANOSIM) statistics was used to test for the significance of pairwise differences between each treatment and its respective control. Volcano plots were generated to illustrate significant differences between individual genera in control and treatment communities, using the relative abundance data from the 16S rRNA gene surveys with the R-code supplied with the METAGENassist software (36).
Shotgun metagenome sequencing.
Prior to sequencing, the three replicate DNA extractions from each plot were pooled at equimolar concentrations (10 μM) and used as the template for metagenome sequencing. This pooling resulted in two metagenomes per treatment derived from replicate plots. Shotgun metagenome sequencing was performed over two lanes of an Illumina HiSeq flow cell using paired-end 2 by 150 sequencing chemistry. Paired-end shotgun metagenome reads were quality checked and assembled using the SOAPdenovo pipeline with default parameters (37). Assembling metagenomes from the same treatments (i.e., duplicate metagenomes) resulted in very poor assembly of paired-end reads, with >90% of sequences not forming contigs (data not shown). Assembling across all the metagenomes produced 415,645 contigs of a mean size of 632 bp (maximum = 55,202; set of contig or scaffold lengths [N50] = 665). Given the relatively poor assemblies, we focused our analysis on the annotations of the individual paired-end reads.
Shotgun metagenome reads were annotated to SEED (http://pubseed.theseed.org/) subsystems using Sequedex with default parameters (38), and annotations in MG-RAST (39) produced nearly identical functional profiles. A comparison of functional profiles was performed within the STAMP software package (35). Functional and metabolic subsystems that were significantly different in relative abundance between data sets were identified using the ANOVA test employing Storey's FDR method to control for false discoveries.
Data set availability and primer sequences.
All sequence data sets are publicly available in MG-RAST. The 16S rRNA gene sequences are indexed under project “Field_site_compare_amplicons; MG-RAST identification numbers 4628763.3 through 4628810.3,” and the shotgun metagenome sequences are in project “Field_site_compare_compiled; MG-RAST identification number 4522082.3.”
RESULTS
Manipulation effects on biocrust cover, soil DNA, and bacterial abundance.
A visual decrease in biocrust cover, appearing as uncrusted sandy soil, was observed in each of the perturbed plots (Fig. 1). Although visually the biocrusts in perturbed plots had lost most of their black pigment and pinnacled formation compared to these features in the well-developed control biocrusts, the total soil biomasses as measured by DNA concentration were similar across most of the experimental plots (Fig. 2A; see also Table S1 in the supplemental material). Total soil DNA concentrations were variable, with large standard deviations in the trampled plots and in the IR treatment at CV. Soil DNA concentration was significantly reduced relative to that of the control only in the IRW treatment (Fig. 2A [P = 0.009 for the IR-W interaction term in a factorial analysis]; see also Table S1). The total 16S rRNA gene qPCR analysis showed that bacterial abundance decreased significantly with T at the two sites (Arches, P = 0.0388; ISKY, P = 0.0031) but that the IR, W, and IRW treatments retained bacterial abundances similar to those of the control plots (Fig. 2B; see also Table S1).
FIG 1.

Visual effects of physical disturbance and climate change perturbations on biocrusts. (A) Effects of chronic trampling at the ISKY site, with darkly pigmented control plots in the foreground and lightly colored trampled plots in the background. (B) Castle Valley field site. The foreground shows a control plot with a wetting treatment plot in the background. (C) Castle Valley control plot. (D) Castle Valley IR warming plot. (E) Castle Valley wetting plot. (F) Castle Valley IR warming and wetting in combination. (C to F) For each of the photos, a 30-cm ruler (pink in color) is provided for scale.
FIG 2.

Changes in biocrust and Cyanobacteria biomass in response to manipulation. (A) Soil DNA concentration; (B) qPCR of bacterial 16S rRNA genes; (C) chlorophyll a concentration; (D) qPCR of Cyanobacteria 16S rRNA genes. Across each panel, the bars represent the means of results from three field replicate samples collected from each of two field plots (n = 6), with the standard errors of the means. Bars labeled with different letters were significantly different at a P value of <0.05. Comparative statistics for each measurement, including interaction terms for the CV factorial experiment, are tabulated in Table S1 in the supplemental material. Statistical tests were performed on data sets collected from the same experimental site and do not represent differences among sites.
Cyanobacteria biomass.
Chlorophyll a concentration and a cyanobacterium-specific qPCR assay were employed to assess the abundance of Cyanobacteria. The T treatment had a negative effect on chlorophyll a concentrations (Fig. 2C) (Arches, P < 0.0001; ISKY, P < 0.0001) and on the abundance of cyanobacterial rRNA genes at both trampled sites (Fig. 2D). The trend was marginally significant at Arches (P = 0.0699) and significant at ISKY (P = 0.019). At CV, the IR treatment did not result in a change in cyanobacterial abundance from that in the control biocrusts (Fig. 2C and D; see also Table S1 in the supplemental material), whereas the W treatment resulted in an increased chlorophyll a concentration and a slight but not significant increase in cyanobacterial 16S rRNA genes (Fig. 2C and D; Table S1). In contrast, the combined IRW treatment showed a significant reduction in cyanobacterial biomass, measured both by determining the chlorophyll a concentration and by cyanobacterial qPCR (Fig. 2C and D; Table S1).
Bacterial community composition.
Sequencing of 16S rRNA genes was used to describe the taxonomic compositions of the soil bacterial communities. Sequences related to 35 different bacterial phyla and to the eukaryotic chloroplasts were identified (see Table S2 in the supplemental material). Only seven bacterial phyla and the chloroplast sequences represented relative abundances of 1% or greater across the majority of the different sequence data sets (Fig. 3). Cyanobacteria was observationally the most abundant bacterial phylum in each of the data sets, with the exception of the IRW treatment data set (Fig. 3). The proportional abundances of cyanobacteria ranged from ca. 4% to 89% (Table S2).
FIG 3.
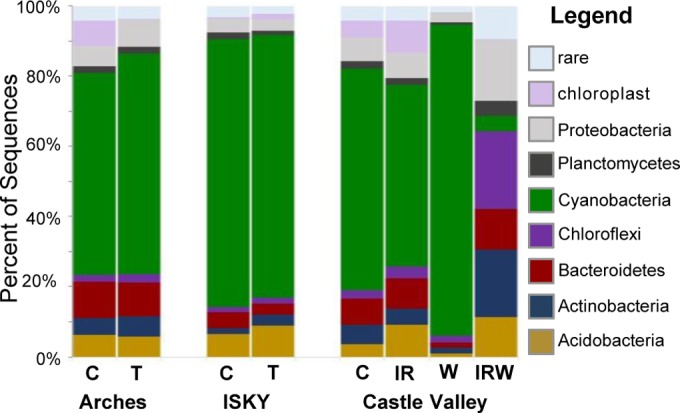
Taxonomic compositions of bacteria in the 16S rRNA gene sequence data sets at the phylum level. Bars represent the average relative abundance of each major phylum across the six replicate sequence data sets. The category “rare” indicates the sum of abundances of phyla that individually accounted for <1% of the sequence library. Phyla that showed statistically significant shifts in relative abundance due to the experimental treatments are displayed in Table S2 in the supplemental material.
No significant difference was found in the relative abundances of any phylum due to trampling (T) at either the Arches or the ISKY site. Similarly, no phylum showed a significant shift in relative abundance in response to IR warming. The wetting (W) experiment resulted in a significant increase in Cyanobacteria compared to their level in the control; this increase was accompanied by significant reductions in phyla such as Acidobacteria, Actinobacteria, Bacteroidetes, and Proteobacteria (Fig. 3; see also Fig. S1A in the supplemental material). In contrast, the combined IRW treatment resulted in a significant decrease in cyanobacterial relative abundance compared to those of the control plots (Fig. 3; Fig. S1B). This was associated with an increased relative abundance of Chloroflexi in the IRW treatment plots. While Chloroflexi accounted for ca. 2% of sequences in the control plots, they increased up to 22% of the sequences in the IRW treatment plots (Fig. S1B). The category “rare,” comprised of phyla that each accounted for <1% of the sequence libraries, also expanded in relative abundance under the IRW treatment (Fig. 3). It is important to note that the rare category is comprised of sequences belonging to a number of phyla that did not all respond similarly to the experimental treatment. For example, sequences belonging to the Firmicutes accounted for 0.3% of sequences in the control plots but increased significantly to 2.1% of sequences in the treatment plots (Fig. S1B). In comparison, sequences belonging to the phylum Verrucomicrobia decreased from 1.3% in the control to 0.6% in the treatment plots (Fig. S1B). In this respect, there was a complex response among the diverse phyla that made up the numerically rare bacterial phyla.
Genus-level shifts in bacterial community composition.
To compare taxonomic levels lower than phyla, the 16S rRNA sequences were classified to the genus level. The proportion of sequences that could be confidently classified ranged from 55% to 68% and belonged to a total of 527 genera. Volcano plots were employed to explore genera that showed large and significant shifts in relative abundance in response to the experimental manipulations. It is important to note that the volcano plots illustrate effect size and not population size. For example, in the results shown in Fig. 4B, the cyanobacterial genus Microcoleus (labeled A) comprised an average of 42% of the sequences in the control plot and 56% of the sequences in the trampled plots, a 1.3-fold change in abundance. In comparison, sequences identified within the Cyanobacteria genus Brasilonema (labeled B in Fig. 4B) accounted for 2.5% of sequences in control plots and 0.2% of sequences in trampled plots, representing a larger (ca. 12-fold) change in relative abundance, hence appearing as a larger point on the x axis of the volcano plot.
FIG 4.

Volcano plots of genus-level taxonomic bins in the 16S rRNA gene data sets. The x axes display the fold changes in relative abundance (log2) between control and treatment data sets. The dashed vertical lines denote a 2-fold change in relative abundance (log22 = 1). The y axes display the −log of the P values of the test statistic. The dashed horizontal line at −log 1.3 corresponds to a P value of 0.05. Therefore, those points that appear outside the enclosed dashed box formed by the x and y axis intercepts are points that show both significant and proportionally large shifts in relative abundance. The number of genera showing significant enrichment in either the control or treatment sample is given in parentheses next to the treatment label. Genera showing significant shifts in relative abundance between the control and treatment samples are color coded by their phylum affiliation (except where the data are too crowded, in which case they are colored dark gray). A full list of genera showing significant shifts in relative abundance is provided in Table S3 in the supplemental material. The points labeled A and B in panel B are discussed in Results.
The volcano plots illustrate two major findings. First, by comparing the “V” shapes created by points radiating out from the x axis zero point, one observes that the four different treatments (T, IR, W, and IRW) each result in a pattern of community compositional shift different from that of the control samples. Second, by comparing the numbers of taxa enriched in each treatment or control and the taxonomic affiliation of those taxa, one can identify community components that shift in proportion in response to the treatments and identify those that demonstrate both highly significant (P ≤ 0.05) and large shifts in proportional abundance in response to the different treatments.
Chronic trampling at the Arches and ISKY sites resulted in similar effects on the biocrust communities. At these sites, similar numbers of genera, predominantly within the phylum Cyanobacteria, were significantly enriched in the control samples and in the T treatment samples (Fig. 4A and B). However, only one of these identified genera, Symploca (Cyanobacteria), was common to both sites (see Table S3 in the supplemental material). The IR warming treatment induced a significant increase in 19 genera spread among multiple phyla (Fig. 4C). No genera were found to be proportionally enriched in the control plots. However, most of these genera showed relatively small fold changes in relative abundance, with none of the identified genera showing greater than 2-fold changes, suggesting that all of the observed changes were relatively small. The wetting (W) experiment affected over 150 genera spread among multiple phyla (Fig. 4D). All of the genera significantly enriched in the W plots were Cyanobacteria, reflecting the increased relative abundance of Cyanobacteria observed in these plots using the phylum-level analysis (Fig. 3). In contrast to Cyanobacteria sequences, sequences related to plant and algal chloroplasts were significantly enriched in the control plots compared to the W plots (Fig. 4D; Table S3), suggesting that biocrust algae and mosses were detrimentally affected by the wetting treatment as documented previously (13). The IRW treatment also caused a large restructuring of the bacterial communities, with ca. 135 genera, and especially members of the Actinobacteria phylum, showing higher relative abundance under the IRW treatment than in the control plots (Fig. 4E; Table S3). Conversely, multiple cyanobacterial genera were significantly reduced in the IRW treatment plots compared to their levels in the control plots (Fig. 4E), reflecting similar differences in the phylum-level bins (Fig. 3)
Similarity in community composition between data sets.
The taxonomic rollups (Fig. 3) and volcano plots (Fig. 4) indicated that each treatment affected the bacterial community differently. Therefore, we employed nonmetric multidimensional scaling (NMDS) to statistically investigate the compositional relationships between the different data sets (Fig. 5A; see also the ANOSIM statistics in Table S4 in the supplemental material). The NMDS illustrated significant differences in the structure of the biocrust bacterial communities among the control plots across the three field sites. The ISKY control plots were significantly different from the control plots at both the Arches and CV sites, indicating biogeographic differences in the community composition of the healthy biocrusts (Fig. 5A; Table S4).
FIG 5.
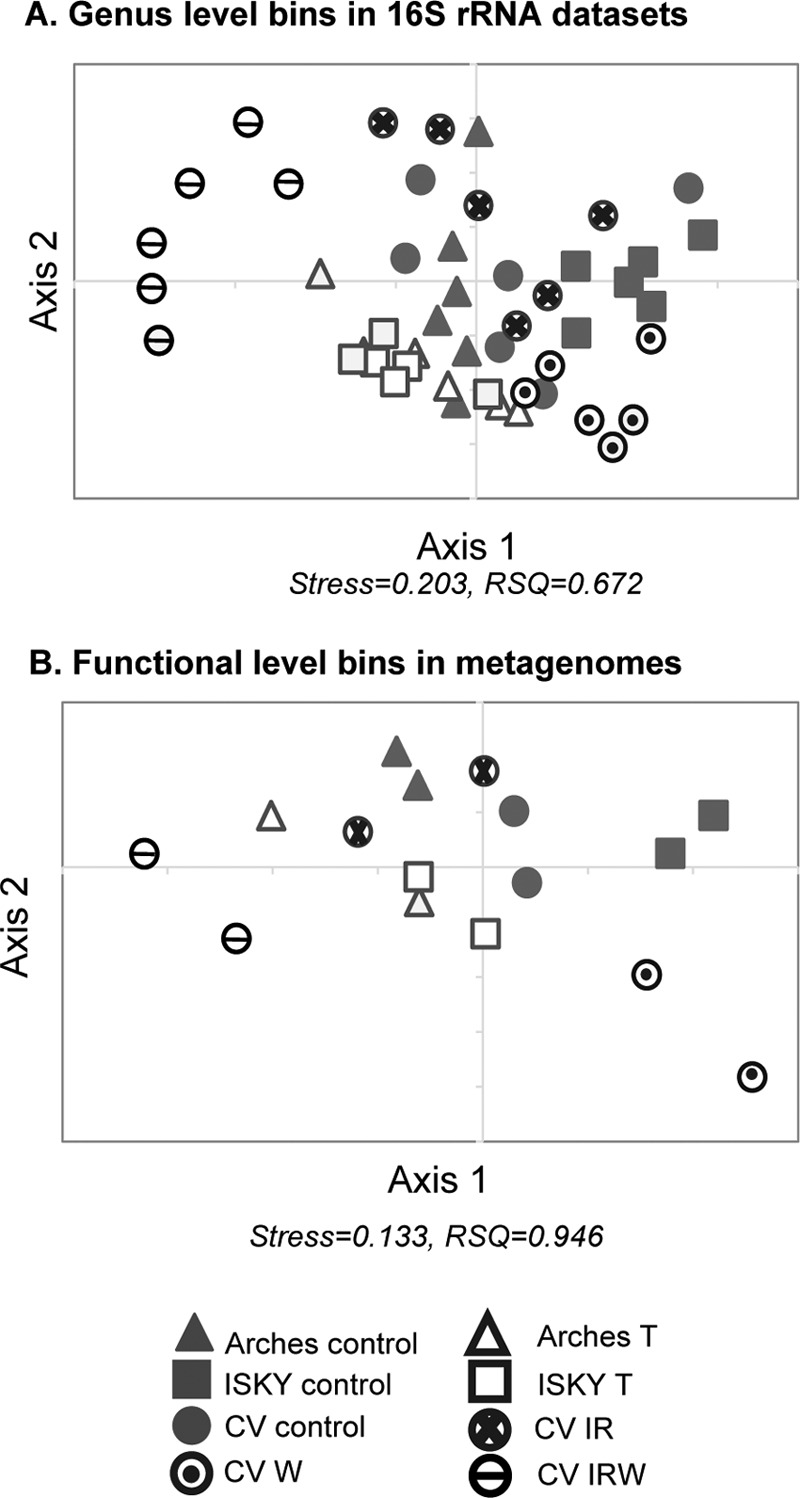
Nonmetric multidimensional scaling (NMDS) plot of compositional relationships of genus-level taxonomic bins in 16S rRNA gene sequence data sets (A) and functional gene annotations in metagenomic data sets (B). Genus-level bins in the 16S rRNA data sets are the same as those employed for the volcano plots (Fig. 4). Distances for both analyses were generated using the Bray-Curtis metric. NMDS stress and RSQ (square of correlation coefficient) are indicated below each plot. ANOSIM statistical results testing the significance of the clustering are presented in Table S4 in the supplemental material.
At each site, except with the IR treatment, the results of all treatments were significantly different than those of their corresponding controls (see Table S4 in the supplemental material). Furthermore, the results of each treatment (T, IR, W, and IRW) were significantly different from those of the other treatments, with communities clustering separately. The T sites at Arches and ISKY were not significantly different from each other (Table S4), indicating that trampling erased the previously established biogeographic difference among the undisturbed plots.
Functional profiles in shotgun metagenomes.
Duplicate shotgun metagenomes were generated from each treatment across the field experiments to investigate how the different manipulations affected the functional potential of the biocrust microbial communities. Sequence reads were annotated to the SEED subsystem-based hierarchy (39), and the reads were investigated by NMDS to test if they showed similar relationships to the taxonomic profiles as revealed by 16S rRNA sequencing (Fig. 5B). The patterns of clustering were similar between taxonomy (Fig. 5A) and function (Fig. 5B), suggesting that trends observed for changes in the 16S rRNA data sets were reflected in the functional gene annotations from the metagenomes.
The majority of the metagenome reads that could be identified mapped to central metabolic pathways or cellular functions that are conserved among all bacteria (e.g., DNA metabolism and ribosomes), resulting in metagenomic profiles that looked qualitatively similar across the data sets (see Fig. S2 in the supplemental material). However, when functional SEED categories were compared individually, four (photosynthesis, cell division/cell cycle, potassium metabolism, and regulation/cell signaling) that showed significant differences (ANOVA, P = 0.01 to P = 0.007) in their proportional representations among some of the different manipulations were identified (Fig. 6).
FIG 6.
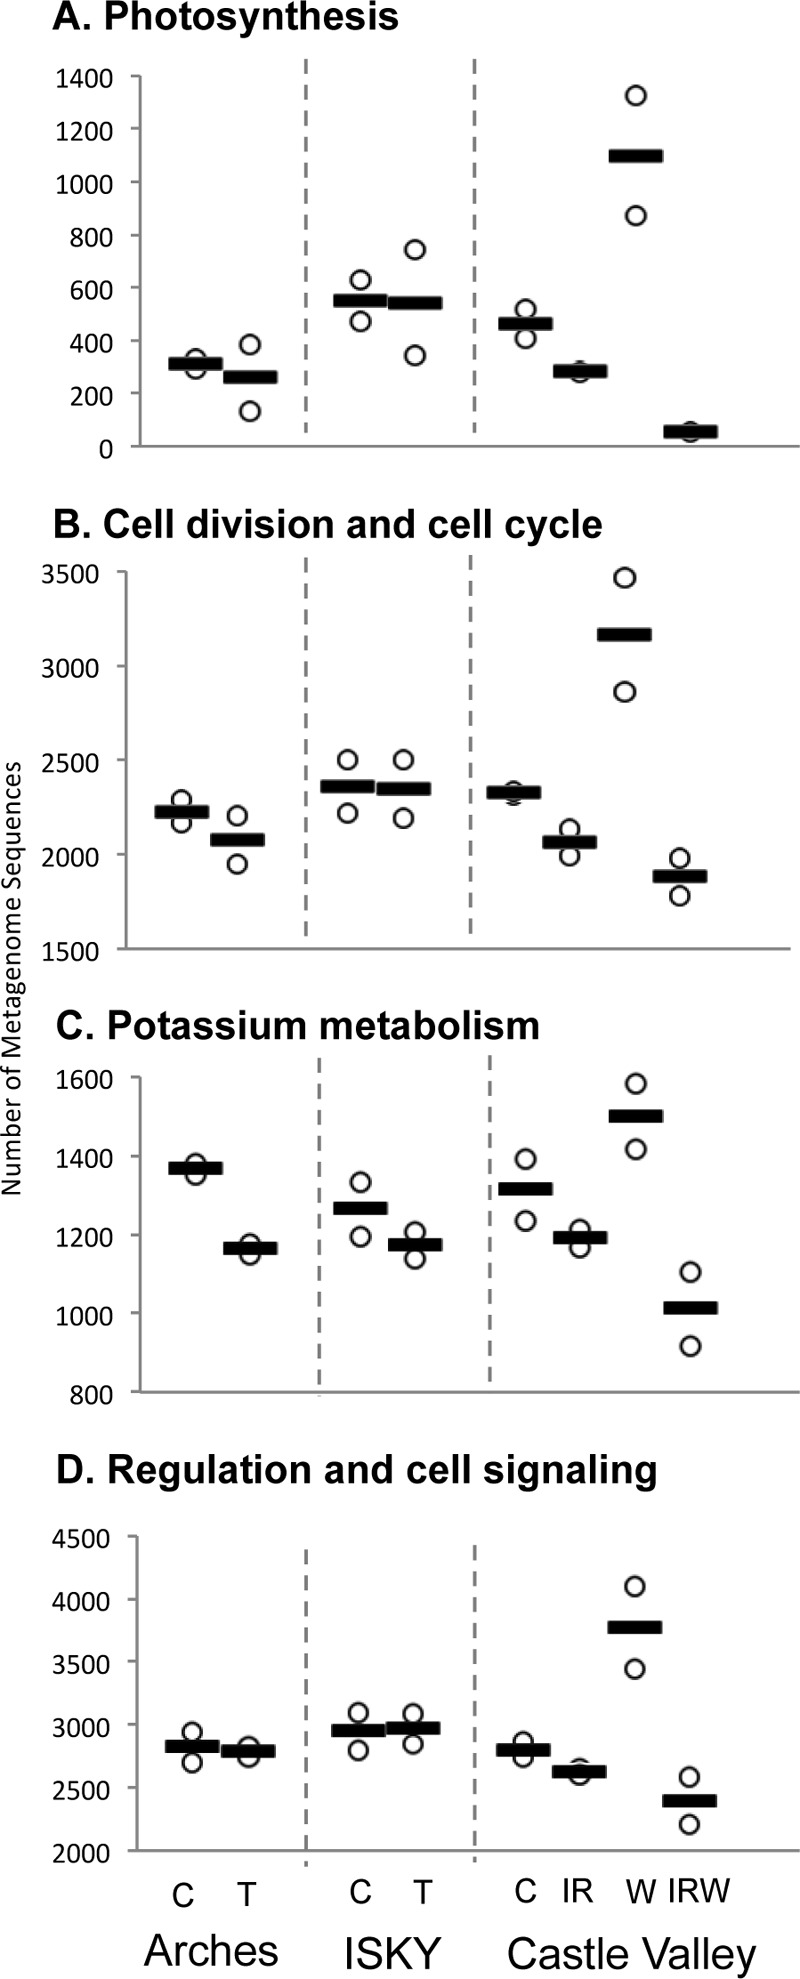
Open box plots displaying the abundances of sequence reads belonging to the four subsystems identified as being significantly different among the metagenome data sets. Only two field replicate metagenomes were sequenced for each treatment, and we did not pursue post hoc statistical tests but present the treatment information as trends to illustrate their conformity to the more highly replicated taxonomic surveys. Individual data sets are plotted as open circles, and each bar represents the average number of sequences in the metagenome surveys between the two field replicates.
Sequence reads from the differentially abundant functional categories were annotated to deeper subsystems (level 2) in the SEED hierarchy to further investigate the consequences for the functional and metabolic profiles of the communities (Fig. 7). Within the photosynthesis category, the majority of the reads were annotated to photosystem II, with the exception of the reads obtained after the IRW treatment, among which the photosynthesis-related reads were identified primarily as proteorhodopsins; although these proteins are light reactive, they do not have a direct role in photosynthesis (Fig. 7A). Within the cell division and cell cycle category, sequence reads could be further classified into six main subsystems. In these six subsystems, genes related to Cyanobacteria circadian clock proteins showed large alterations in relative abundance between the different treatments. Genes in this subsystem are involved in regulating the diurnal regulation of cyanobacterial gene expression (40), and the proportion of sequence reads in this category predictably followed trends in cyanobacterial abundance, being more abundant after the W treatment and less abundant after IRW (Fig. 2D). The categories potassium metabolism and regulation and cell signaling showed similar patterns, in that the differences were due to changes in the category as a whole rather than a restructuring of the subsystems that make up the category. For instance, in the potassium metabolism category, the subsystems that made up the category were present in similar proportions across the treatments. In the category regulation and cell signaling, the cyclic AMP (cAMP) signaling-related genes were consistently the largest subsystem among those reads that could be annotated, whereas the differences between treatments were generally among the rare subsystems that individually accounted for less than 1% of the sequence reads but collectively comprised ∼35% to 50% of the reads in the category (Fig. 7D).
FIG 7.

Annotation of sequence reads within the differentially abundant subsystems shown in Fig. 6. The scale of the x axis indicates the proportion of reads belonging to each function as a percentage of the total reads in each subsystem. Each bar represents the average of the two replicate metagenomes.
DISCUSSION
The results from these long-term field experiments demonstrate that annual trampling, small increases in temperature, alteration in size and frequency of precipitation events, or a combination of warming and altered precipitation regimes result in major, often detrimental impacts on biocrust bacterial communities in arid lands. These results are not surprising in the context of decades of assessments showing biocrust organisms to be fragile and slow to recover from disturbance (41).Yet, these results demonstrate that, under some disturbance regimes, disturbed biocrusts adopt similar structures at the visual scale, predominantly driven by the reduction of cyanobacterial biomass and relative abundance (Fig. 2). The effects of different types of disturbances result in significantly different bacterial communities that have different functional gene profiles.
Chronic trampling (T) had the largest effect on biocrust biomass, reducing total bacterial abundance (Fig. 2B) and cyanobacterial abundance (Fig. 2C and D). In comparison, the IRW manipulation effected a reduction only in cyanobacterial biomass (Fig. 2C and D). The altered precipitation (W) treatment was the only treatment that caused an increase in cyanobacterial biomass, resulting in significantly higher chlorophyll a concentrations than in the control plot (Fig. 2C). Each experimental manipulation, with the exception of IR lamp warming alone, drove the biocrust communities to a composition distinct from those of the control plots at that site. Furthermore, the compositions adopted by all of the communities under manipulation were significantly different (Fig. 5). Clearly, each experimental manipulation induced different changes in the biocrust communities. The specific effects of the different manipulations are discussed below.
Chronic trampling.
The trampling treatment resulted in a significant decrease in total bacterial abundance as measured by qPCR (Fig. 2B), although total biomasses, as assessed by DNA recovery, were not significantly different (Fig. 2A). This may indicate that the maintenance of DNA-based biomass was due to increased abundance of other soil biota, such as fungi, that were not measured in this study. This result also differed from the results of a survey of this site performed 4 years previously, which showed a significant reduction in DNA recovery from trampled soils, suggesting that there may be temporal, seasonal, or year-to-year differences in biomass responses to chronic trampling (4). Trampling was also found to cause a significant decrease in cyanobacterial biomass (Fig. 2B and C), implying that the ability of the soils in the trampled plots to perform photosynthesis is likely significantly reduced.
Although overall Cyanobacteria relative abundances summed from phylum-level assignments in the 16S rRNA sequence data sets were not significantly different between the treatment and control plots (Fig. 3), a small number of Cyanobacteria genera were significantly less abundant in the trampled plots at both trampled sites (Fig. 4A and B). Sequences identified within genera such as Calothrix and Pseudoanabaena, both of which have been identified as nitrogen-fixing components of biocrusts, were significantly less abundant in the trampled plots, indicating a possible reduced potential for nitrogen fixation (42–44). The significant reductions in bacterial and cyanobacterial biomass with subtle shifts in taxonomic composition show that the predominant effect of chronic trampling was a reduction of biomass. Perhaps the biocrust inoculum can survive trampling by evading the disturbance, potentially as small biofilms adhering to soil particles. Alternatively, these communities may have been recruited from neighboring healthy biocrusts in the time since last trampled.
Another effect of chronic trampling was the erasure of biogeographic differences. Previous work showed that biocrust bacterial communities have biogeographic differences based on soil parent material (32). In this study, the control biocrusts at the Arches and ISKY sites were significantly different in composition (ANOSIM comparisons; see also Table S4 in the supplemental material) and clustered independently in NMDS plots (Fig. 5). Yet, chronic trampling resulted in the loss of this difference, as community composition was found to be similar at the two sites after trampling (Fig, 5; Table S4). This suggests that dryland biocrusts adopt similar structures under chronic physical disturbance, even when they begin from different starting compositions.
Soil IR warming.
Six years of the IR treatment resulted in visibly damaged biocrusts (Fig. 1). However, the measured bacterial biomass (Fig. 2) and composition (Fig. 3 and 4C) were not significantly different from those of the controls. A previous study conducted on lichen-dominated biocrusts in Spain, which induced a 2.4°C temperature warming, found a significant decrease in lichenized-biocrust diversity (45). This suggests that the visible damage to the biocrusts documented here may have been due to shifts in lichens or mosses rather than bacteria. However, a recent study demonstrated that temperature shifts can induce ecological replacements within the dominant biocrust Cyanobacteria populations, although this replacement was across a much larger temperature range (13 to 15°C) than that used in this study (21). Taken together, our results suggest that the biocrust bacteria are resilient to relatively small increases in temperature. In line with the limited taxonomic alterations of the bacterial community under warming, the functional profiles of the bacterial communities were also relatively unaffected by the warming treatment (Fig. 6 and 7).
Wetting treatment.
The W treatment increased the frequency of small precipitation events, with an increase in frequency of 1.2-mm summer rainfall events. Wetted plots received an average of 35 such events during the summer months, about four times the average for this region (13). This change in precipitation regimen caused significant alterations in the biocrust community. The W plots showed visibly barren soil with no evidence of structural biocrusts (Fig. 1). Despite this, the primary effects of the W treatment on the bacterial communities were a significant increase in chlorophyll a concentration (Fig. 2C), significantly increased Cyanobacteria relative abundance (Fig. 3), and trends toward increased cyanobacterium-related metabolic genes (Fig. 6). Our results suggest that the W treatment fostered an increase in Cyanobacteria abundance. In contrast, other photosynthetic organisms, as measured by the relative abundance of chloroplast-related sequences, were significantly reduced in the W treatment (Fig. 4D). This coincides with previous observations that the altered precipitation treatment caused significant declines in the mosses after 1 year (13) and suggests that the visual decline in the biocrusts is likely largely due to the negative effects on the noncyanobacterial components of the community.
The results reported here, indicating an increase in Cyanobacteria biomass and relative abundance of Cyanobacteria after 6 years of manipulation, contrast with similar measurements made after 2 years, where there were significant reductions in cyanobacterial abundance (75% to 95% of biomass loss) (14). The apparent recovery of the cyanobacterial populations in this study may suggest that some cyanobacterial populations have adapted to the altered precipitation regimen or that the plots have begun to be recolonized. The Cyanobacteria genera Pseudanabaena and Calothrix were enriched in the W plots relative to their levels in the control plots (Fig. 4D), reflecting differences in the structures of the Cyanobacteria populations under this treatment. Because Cyanobacteria differ in their abilities to establish in unstabilized sandy soils and to fix nitrogen, such compositional changes may have impacts on long-term soil stability and fertility. Further studies documenting the activities and biochemistry of the Cyanobacteria populations in the W plots compared to those of the well-established biocrusts in the control plots may shed light on the development, recovery, and function of biocrust Cyanobacteria populations.
Warming and precipitation in combination.
When combined, the IR warming and wetting treatments clearly showed an interactive effect, driving the biocrust communities to a state significantly different from that of either manipulation alone (Fig. 2 and 4; see Tables S2 and S5 in the supplemental material). Whereas the IR treatment alone had little appreciable effect on the biocrust communities and the W treatment led to an increase in cyanobacterial abundance, the IRW treatment combination resulted in a biocrust community where hundreds of genera shifted in proportion and where the Cyanobacteria populations collapsed (Fig. 2 and 3). This result suggests that the biocrust bacterial communities are generally resilient to relatively small shifts in temperature but that warming can dramatically influence soil bacterial community response when combined with altered precipitation.
In the metagenomes, members of all four SEED subsystems identified as significantly different between the data sets were reduced in number after the IRW treatments (Fig. 6), following the trends observed for Cyanobacteria abundance (Fig. 2D and 3). Interestingly, the four functional metagenome categories whose members were found to be reduced in number in the IRW treatment plots were the same as those found in a previous study documenting the differences in bacterial communities in biocrusts and uncrusted soils in creosote bush root zones (24). This suggests that the functional effects of reductions in Cyanobacteria abundance are similar whether the reductions were induced by environmental perturbations or natural variance due to their proximity to local vegetation. Several of the differences in the functional profiles were directly attributable to the reductions in Cyanobacteria. For example, proteorhodopsins and their archaeal counterparts, bacteriorhodopsins, function as light-driven proton pumps and are believed to function in environmental sensing or supplementary metabolism (46, 47). These genes accounted for the majority of the photosynthesis-related subsystems in the IRW treatment plots, as opposed to genes of photosystem II, the primary photosynthetic machinery of Cyanobacteria (48), which made up the majority of genes in photosynthesis-related subsystems after the other treatments (Fig. 7). Other categories were not as easily associated with changes in Cyanobacteria. Members of the category potassium metabolism tended toward large decreases after the IRW treatment in comparison to those of the other data sets (Fig. 6). The role for potassium in biocrust development and functioning has not been established, although elevated soil potassium has been associated with increased biocrust abundance (49, 50). These data support potassium uptake and cycling being integral to biocrust functioning.
Previous work on the biocrust mosses may shed light on the causes of the cyanobacterial population collapse after the IRW combined treatment. Physiological studies of biocrust mosses in this experiment suggested that the mortality was due to a negative carbon balance under small precipitation events (13). In this scenario, a precipitation event is associated with an early respiration burst, followed by photosynthesis and carbon fixation. However, the organism needs to stay hydrated long enough to recuperate the respiratory carbon loss. If the precipitation events are particularly small or warm temperatures induce increased evaporation, a carbon deficit can result (51). Over repeated cycles, this deficit can become lethal (13). It is possible that for Cyanobacteria, this carbon starvation mechanism resulted in the mortality of the Cyanobacteria after the IRW treatment, while the W treatment was able to support the recolonization and potential restoration of biocrust cyanobacterial populations (Fig. 3). These results highlight how environmental disturbances can act in concert to drive microbial communities to states that would not be predicted from studying individual perturbations alone.
Conclusions.
Biocrust surface cover has been employed as a useful metric to assess the health of dryland ecosystems (52, 53). However, this metric may have severe limitations for predicting altered ecosystem stability, productivity, or capacity to cycle nutrients. Our study clearly shows that disturbed biocrusts that appear similar at a macroscopic scale can differ significantly in underlying microbiology. This has important implications for the management and restoration strategies of dryland ecosystems, demonstrating that the mechanism of disturbance needs to be considered when assessing the health and functioning of biocrust communities. The impacts of climate and land use changes will involve a combination of increasing temperatures, changing weather patterns, and increased anthropogenic disturbance (54). To provide useful and robust predictions of ecosystem responses to climate and land use change, multiple stressors alone and in combination must be taken into account. Furthermore, the finding that unique combinations of bacterial genera were affected by each of the manipulations offers the possibility of tracking particular bacterial taxa to monitor the status of biocrust communities. This may be the first step toward developing molecular diagnostic tools to apprise land managers of the health of local biocrust communities and identifying the mechanisms and consequences of various disturbances. Taken together, these results highlight the importance of taking a microbial view of dryland soils and employing long-term multifactorial experiments to understand how these systems will respond to a changing environment.
Supplementary Material
ACKNOWLEDGMENTS
This study was supported by the U.S. Department of Energy, Office of Science, Biological and Environmental Research, through a Science Focus Area grant to C.R.K. DNA sequencing was provided by the Los Alamos National Laboratory through their Laboratory Directed Research and Development program. Field experiments were initiated and maintained through U.S. DOE Terrestrial Ecosystem Science grants to J.B. and S.C.R. and the National Park Service. J.B. thanks the USGS Climate and Land Use and Ecosystem programs for support.
Any use of trade names is for descriptive purposes only and does not imply endorsement by the U.S. Government.
Footnotes
Supplemental material for this article may be found at http://dx.doi.org/10.1128/AEM.01443-15.
REFERENCES
- 1.Sheppard PR, Comrie AC, Packin GD, Angersbach K, Hughes MK. 2002. The climate of the US Southwest. Clim Res 21:219–238. doi: 10.3354/cr021219. [DOI] [Google Scholar]
- 2.Belnap J, Eldridge D. 2001. Disturbance and recovery of biological soil crusts, p 363–383. In Belnap J, Lange OL (ed), Biological soil crusts: structure, function, and management. Springer, Berlin, Germany. [Google Scholar]
- 3.Belnap J, Gillette DA. 1998. Vulnerability of desert biological soil crusts to wind erosion: the influences of crust development, soil texture, and disturbance. J Arid Environ 39:133–142. doi: 10.1006/jare.1998.0388. [DOI] [Google Scholar]
- 4.Kuske CR, Yeager CM, Johnson S, Ticknor LO, Belnap J. 2012. Response and resilience of soil biocrust bacterial communities to chronic physical disturbance in arid shrublands. ISME J 6:886–897. doi: 10.1038/ismej.2011.153. [DOI] [PMC free article] [PubMed] [Google Scholar]
- 5.Auken OWV. 2000. Shrub invasions of North American semiarid grasslands. Annu Rev Ecol Syst 31:197–215. doi: 10.1146/annurev.ecolsys.31.1.197. [DOI] [Google Scholar]
- 6.Chylek P, Dubey MK, Lesins G, Li J, Hengartner N. 2013. Imprint of the Atlantic multi-decadal oscillation and Pacific decadal oscillation on southwestern US climate: past, present, and future. Clim Dyn 43:119–129. doi: 10.1007/s00382-013-1933-3. [DOI] [Google Scholar]
- 7.Hu Q, Feng S. 2007. Decadal variation of the Southwest U.S. summer monsoon circulation and rainfall in a regional model. J Clim 20:4702–4716. doi: 10.1175/JCLI4270.1. [DOI] [Google Scholar]
- 8.Wang J, Anderson BT, Salvucci GD. 2007. Stochastic modeling of daily summertime rainfall over the Southwestern United States. Part II: intraseasonal variability. J Hydrometeorol 8:938–951. doi: 10.1175/JHM592.1. [DOI] [Google Scholar]
- 9.Belnap J, Büdel B, Lange OL. 2001. Biological soil crusts: characteristics and distribution, p 3–30. In Belnap J, Lange OL (ed), Biological soil crusts: structure, function, and management. Springer, Berlin, Germany. [Google Scholar]
- 10.Billings S, Schaeffer S, Evans R. 2003. Nitrogen fixation by biological soil crusts and heterotrophic bacteria in an intact Mojave Desert ecosystem with elevated CO2 and added soil carbon. Soil Biol Biochem 35:643–649. doi: 10.1016/S0038-0717(03)00011-7. [DOI] [Google Scholar]
- 11.Belnap J. 2002. Nitrogen fixation in biological soil crusts from southeast Utah, USA. Biol Fertil Soils 35:128–135. doi: 10.1007/s00374-002-0452-x. [DOI] [Google Scholar]
- 12.Evans RD, Lange OL. 2001. Biological soil crusts and ecosystem nitrogen and carbon dynamics, p 263–279. In Belnap J, Lange OL (ed), Biological soil crusts: structure, function, and management. Springer, Berlin, Germany. [Google Scholar]
- 13.Reed SC, Coe KK, Sparks JP, Housman DC, Zelikova TJ, Belnap J. 2012. Changes to dryland rainfall result in rapid moss mortality and altered soil fertility. Nat Clim Change 2:752–755. doi: 10.1038/nclimate1596. [DOI] [Google Scholar]
- 14.Johnson SL, Kuske CR, Carney TD, Housman DC, Gallegos-Graves LV, Belnap J. 2012. Increased temperature and altered summer precipitation have differential effects on biological soil crusts in a dryland ecosystem. Glob Change Biol 18:2583–2593. doi: 10.1111/j.1365-2486.2012.02709.x. [DOI] [Google Scholar]
- 15.Belnap J, Phillips SL, Miller ME. 2004. Response of desert biological soil crusts to alterations in precipitation frequency. Oecologia 141:306–316. doi: 10.1007/s00442-003-1438-6. [DOI] [PubMed] [Google Scholar]
- 16.Zelikova TJ, Housman DC, Grote EE, Neher DA, Belnap J. 2012. Warming and increased precipitation frequency on the Colorado Plateau: implications for biological soil crusts and soil processes. Plant Soil 355:265–282. doi: 10.1007/s11104-011-1097-z. [DOI] [Google Scholar]
- 17.Belnap J. 2003. The world at your feet: desert biological soil crusts. Front Ecol Environ 1:181–189. doi: 10.1890/1540-9295(2003)001[0181:TWAYFD]2.0.CO;2. [DOI] [Google Scholar]
- 18.Eldridge D, Zaady E, Shachak M. 2000. Infiltration through three contrasting biological soil crusts in patterned landscapes in the Negev, Israel. Catena 40:323–326. [Google Scholar]
- 19.Steven B, Lionard M, Kuske CR, Vincent WF. 2013. High bacterial diversity of biological soil crusts in water tracks over permafrost in the high Arctic polar desert. PLoS One 8:e71489. doi: 10.1371/journal.pone.0071489. [DOI] [PMC free article] [PubMed] [Google Scholar]
- 20.Büdel B, Darienko T, Deutschewitz K, Dojani S, Friedl T, Mohr KI, Salisch M, Reisser W, Weber B. 2009. Southern African biological soil crusts are ubiquitous and highly diverse in drylands, being restricted by rainfall frequency. Microb Ecol 57:229–247. doi: 10.1007/s00248-008-9449-9. [DOI] [PubMed] [Google Scholar]
- 21.Garcia-Pichel F, Loza V, Marusenko Y, Mateo P, Potrafka RM. 2013. Temperature drives the continental-scale distribution of key microbes in topsoil communities. Science 340:1574–1577. doi: 10.1126/science.1236404. [DOI] [PubMed] [Google Scholar]
- 22.Lane DJ, Pace B, Olsen GJ, Stahl DA, Sogin ML, Pace NR. 1985. Rapid determination of 16S ribosomal RNA sequences for phylogenetic analyses. Proc Natl Acad Sci U S A 82:6955–6959. doi: 10.1073/pnas.82.20.6955. [DOI] [PMC free article] [PubMed] [Google Scholar]
- 23.Muyzer G, De Waal EC, Uitterlinden AG. 1993. Profiling of complex microbial populations by denaturing gradient gel electrophoresis analysis of polymerase chain reaction-amplified genes coding for 16S rRNA. Appl Environ Microbiol 59:695–700. [DOI] [PMC free article] [PubMed] [Google Scholar]
- 24.Steven B, Gallegos-Graves LV, Yeager CM, Belnap J, Kuske CR. 2014. Common and distinguishing features of the bacterial and fungal communities in biological soil crusts and shrub root zone soils. Soil Biol Biochem 69:302–312. doi: 10.1016/j.soilbio.2013.11.008. [DOI] [Google Scholar]
- 25.Bowker MA, Belnap J, Miller ME. 2006. Spatial modeling of biological soil crusts to support rangeland assessment and monitoring. Rangel Ecol Manag 59:519–529. doi: 10.2111/05-179R1.1. [DOI] [Google Scholar]
- 26.Castle SC, Morrison CD, Barger NN. 2011. Extraction of chlorophyll a from biological soil crusts: a comparison of solvents for spectrophotometric determination. Soil Biol Biochem 43:853–856. doi: 10.1016/j.soilbio.2010.11.025. [DOI] [Google Scholar]
- 27.Steven B, Gallegos-Graves LV, Yeager CM, Belnap J, Evans RD, Kuske CR. 2012. Dryland biological soil crust Cyanobacteria show unexpected decreases in abundance under long-term elevated CO2. Environ Microbiol 14:3247–3258. doi: 10.1111/1462-2920.12011. [DOI] [PubMed] [Google Scholar]
- 28.Nübel U, Garcia-Pichel F, Muyzer G. 1997. PCR primers to amplify 16S rRNA genes from Cyanobacteria. Appl Environ Microbiol 63:3327–3332. [DOI] [PMC free article] [PubMed] [Google Scholar]
- 29.Claesson MJ, Wang Q, O'Sullivan O, Greene-Diniz R, Cole JR, Ross RP, O'Toole PW. 2010. Comparison of two next-generation sequencing technologies for resolving highly complex microbiota composition using tandem variable 16S rRNA gene regions. Nucleic Acids Res 38:e200. doi: 10.1093/nar/gkq873. [DOI] [PMC free article] [PubMed] [Google Scholar]
- 30.Frank DN. 2009. BARCRAWL and BARTAB: software tools for the design and implementation of barcoded primers for highly multiplexed DNA sequencing. BMC Bioinformatics 10:362. doi: 10.1186/1471-2105-10-362. [DOI] [PMC free article] [PubMed] [Google Scholar]
- 31.Schloss PD, Westcott SL, Ryabin T, Hall JR, Hartmann M, Hollister EB, Lesniewski RA, Oakley BB, Parks DH, Robinson CJ, Sahl JW, Stres B, Thallinger GG, Horn DJV, Weber CF. 2009. Introducing mothur: open-source, platform-independent, community-supported software for describing and comparing microbial communities. Appl Environ Microbiol 75:7537–7541. doi: 10.1128/AEM.01541-09. [DOI] [PMC free article] [PubMed] [Google Scholar]
- 32.Steven B, Gallegos-Graves LV, Belnap J, Kuske CR. 2013. Dryland soil microbial communities display spatial biogeographic patterns associated with soil depth and soil parent material. FEMS Microbiol Ecol 86:101–113. doi: 10.1111/1574-6941.12143. [DOI] [PubMed] [Google Scholar]
- 33.Steven B, Gallegos-Graves LV, Starkenburg SR, Chain PS, Kuske CR. 2012. Targeted and shotgun metagenomic approaches provide different descriptions of dryland soil microbial communities in a manipulated field study. Environ Microbiol Rep 4:248–256. doi: 10.1111/j.1758-2229.2012.00328.x. [DOI] [PubMed] [Google Scholar]
- 34.Quast C, Pruesse E, Yilmaz P, Gerken J, Schweer T, Yarza P, Peplies J, Glöckner FO. 2013. The SILVA ribosomal RNA gene database project: improved data processing and web-based tools. Nucleic Acids Res 41:D590–D596. [DOI] [PMC free article] [PubMed] [Google Scholar]
- 35.Parks DH, Beiko RG. 2010. Identifying biologically relevant differences between metagenomic communities. Bioinformatics 26:715–721. doi: 10.1093/bioinformatics/btq041. [DOI] [PubMed] [Google Scholar]
- 36.Arndt D, Xia J, Liu Y, Zhou Y, Guo AC, Cruz JA, Sinelnikov I, Budwill K, Nesbø CL, Wishart DS. 2012. METAGENassist: a comprehensive web server for comparative metagenomics. Nucleic Acids Res 40:W88–W95. doi: 10.1093/nar/gks497. [DOI] [PMC free article] [PubMed] [Google Scholar]
- 37.Simpson JT, Durbin R. 2012. Efficient de novo assembly of large genomes using compressed data structures. Genome Res 22:549–556. doi: 10.1101/gr.126953.111. [DOI] [PMC free article] [PubMed] [Google Scholar]
- 38.Berendzen J, Bruno WJ, Cohn JD, Hengartner NW, Kuske CR, McMahon BH, Wolinsky MA, Xie G. 2012. Rapid phylogenetic and functional classification of short genomic fragments with signature peptides. BMC Res Notes 5:460. doi: 10.1186/1756-0500-5-460. [DOI] [PMC free article] [PubMed] [Google Scholar]
- 39.Meyer F, Paarmann D, D'Souza M, Olson R, Glass EM, Kubal M, Paczian T, Rodriguez A, Stevens R, Wilke A, Wilkening J, Edwards RA. 2008. The metagenomics RAST server—a public resource for the automatic phylogenetic and functional analysis of metagenomes. BMC Bioinformatics 9:386. doi: 10.1186/1471-2105-9-386. [DOI] [PMC free article] [PubMed] [Google Scholar]
- 40.Golden SS, Ishiura M, Johnson CH, Kondo T. 1997. Cyanobacterial circadian rhythms. Annu Rev Plant Physiol Plant Mol Biol 48:327–354. doi: 10.1146/annurev.arplant.48.1.327. [DOI] [PubMed] [Google Scholar]
- 41.Belnap J, Eldridge D. 2003. Disturbance and recovery of biological soil crusts, p 363–383. In Belnap J, Lange OL (ed), Biological soil crusts: structure, function, and management. Springer, Berlin, Germany. [Google Scholar]
- 42.Yeager CM, Kornosky JL, Housman DC, Grote EE, Belnap J, Kuske CR. 2004. Diazotrophic community structure and function in two successional stages of biological soil crusts from the Colorado Plateau and Chihuahuan Desert. Appl Environ Microbiol 70:973–983. doi: 10.1128/AEM.70.2.973-983.2004. [DOI] [PMC free article] [PubMed] [Google Scholar]
- 43.Garcia-Pichel F, López-Cortés A, Nübel U. 2001. Phylogenetic and morphological diversity of Cyanobacteria in soil desert crusts from the Colorado Plateau. Appl Environ Microbiol 67:1902–1910. doi: 10.1128/AEM.67.4.1902-1910.2001. [DOI] [PMC free article] [PubMed] [Google Scholar]
- 44.Yeager CM, Kornosky JL, Morgan RE, Cain EC, Garcia-Pichel F, Housman DC, Belnap J, Kuske CR. 2007. Three distinct clades of cultured heterocystous Cyanobacteria constitute the dominant N2-fixing members of biological soil crusts of the Colorado Plateau, USA. FEMS Microbiol Ecol 60:85–97. doi: 10.1111/j.1574-6941.2006.00265.x. [DOI] [PubMed] [Google Scholar]
- 45.Escolar C, Martínez I, Bowker MA, Maestre FT. 2012. Warming reduces the growth and diversity of biological soil crusts in a semi-arid environment: implications for ecosystem structure and functioning. Philos Trans R Soc Lond B Biol Sci 367:3087–3099. doi: 10.1098/rstb.2011.0344. [DOI] [PMC free article] [PubMed] [Google Scholar]
- 46.Spudich JL. 2006. The multitalented microbial sensory rhodopsins. Trends Microbiol 14:480–487. doi: 10.1016/j.tim.2006.09.005. [DOI] [PubMed] [Google Scholar]
- 47.Sharma AK, Spudich JL, Doolittle WF. 2006. Microbial rhodopsins: functional versatility and genetic mobility. Trends Microbiol 14:463–469. doi: 10.1016/j.tim.2006.09.006. [DOI] [PubMed] [Google Scholar]
- 48.Bryant DA, Frigaard NU. 2006. Prokaryotic photosynthesis and phototrophy illuminated. Trends Microbiol 14:488–496. doi: 10.1016/j.tim.2006.09.001. [DOI] [PubMed] [Google Scholar]
- 49.Li X-R, He M-Z, Zerbe S, Li X-J, Liu L-C. 2010. Micro-geomorphology determines community structure of biological soil crusts at small scales. Earth Surf Process Landf 35:932–940. doi: 10.1002/esp.1963. [DOI] [Google Scholar]
- 50.Bowker MA, Belnap J, Davidson DW, Goldstein H. 2006. Correlates of biological soil crust abundance across a continuum of spatial scales: support for a hierarchical conceptual model: scale-dependent soil crust distribution. J Appl Ecol 43:152–163. doi: 10.1111/j.1365-2664.2006.01122.x. [DOI] [Google Scholar]
- 51.Coe KK, Belnap J, Sparks JP. 2012. Precipitation-driven carbon balance controls survivorship of desert biocrust mosses. Ecology 93:1626–1636. doi: 10.1890/11-2247.1. [DOI] [PubMed] [Google Scholar]
- 52.Ustin SL, Valko PG, Kefauver SC, Santos MJ, Zimpfer JF, Smith SD. 2009. Remote sensing of biological soil crust under simulated climate change manipulations in the Mojave Desert. Remote Sens Environ 113:317–328. doi: 10.1016/j.rse.2008.09.013. [DOI] [Google Scholar]
- 53.Maestre FT, Escolar C, de Guevara ML, Quero JL, Lázaro R, Delgado-Baquerizo M, Ochoa V, Berdugo M, Gozalo B, Gallardo A. 2013. Changes in biocrust cover drive carbon cycle responses to climate change in drylands. Glob Change Biol 19:3835–3847. doi: 10.1111/gcb.12306. [DOI] [PMC free article] [PubMed] [Google Scholar]
- 54.Sancho LG, Maestre FT, Büdel B. 2014. Biological soil crusts in a changing world: introduction to the special issue. Biodivers Conserv 23:1611–1617. doi: 10.1007/s10531-014-0727-1. [DOI] [Google Scholar]
Associated Data
This section collects any data citations, data availability statements, or supplementary materials included in this article.