

Abstract
Faecalibacterium prausnitzii depletion in intestinal diseases has been extensively reported, but little is known about intraspecies variability. This work aims to determine if subjects with gastrointestinal disease host mucosa-associated F. prausnitzii populations different from those hosted by healthy individuals. A new species-specific PCR-denaturing gradient gel electrophoresis (PCR-DGGE) method targeting the 16S rRNA gene was developed to fingerprint F. prausnitzii populations in biopsy specimens from 31 healthy control (H) subjects and 36 Crohn's disease (CD), 23 ulcerative colitis (UC), 6 irritable bowel syndrome (IBS), and 22 colorectal cancer (CRC) patients. The richness of F. prausnitzii subtypes was lower in inflammatory bowel disease (IBD) patients than in H subjects. The most prevalent operational taxonomic units (OTUs) consisted of four phylotypes (OTUs with a 99% 16S rRNA gene sequence similarity [OTU99]), which were shared by all groups of patients. Their distribution and the presence of some disease-specific F. prausnitzii phylotypes allowed us to differentiate the populations in IBD and CRC patients from that in H subjects. At the level of a minimum similarity of 97% (OTU97), two phylogroups accounted for 98% of the sequences. Phylogroup I was found in 87% of H subjects but in under 50% of IBD patients (P = 0.003). In contrast, phylogroup II was detected in >75% of IBD patients and in only 52% of H subjects (P = 0.005). This study reveals that even though the main members of the F. prausnitzii population are present in both H subjects and individuals with gut diseases, richness is reduced in the latter and an altered phylotype distribution exists between diseases. This approach may serve as a basis for addressing the suitability of F. prausnitzii phylotypes to be quantified as a putative biomarker of disease and depicting the importance of the loss of these subtypes in disease pathogenesis.
INTRODUCTION
Metagenomic studies have shown that the human gut microbiota is constituted by a relatively limited number of dominating bacterial phyla. While in healthy adults Bacteroidetes and Firmicutes are the most abundant phyla, Proteobacteria, Verrucomicrobia, Actinobacteria, and Fusobacteria are relatively scarce (1–3). The firmicute Faecalibacterium prausnitzii (Ruminococcaceae) is one of the three most abundant species, representing approximately 6 to 8% of the gut microbial community in healthy subjects, although it can reach up to 20% in some individuals (1, 4–11). In contrast, depletion of F. prausnitzii has been reported to occur in several pathological disorders (for a review, see reference 12 and references therein), such as Crohn's disease (CD) (12–19), ulcerative colitis (UC) (11, 14, 15, 17, 20–26), irritable bowel syndrome (IBS) of alternating type (27), colorectal cancer (CRC) (28, 29), and diabetes (30–32).
Many studies have shown the potential role of F. prausnitzii in promoting gut health through the secretion of anti-inflammatory compounds, such as butyrate (16, 33–36), and in reducing the severity of colitis induced in mice (16, 37). Despite being a relatively abundant bacterium capable of regulating gut homeostasis (38, 39) and interacting in several host pathways (40), few studies have paid attention to the distribution of phylotypes within Faecalibacterium populations in the human gut. Random amplified polymorphic DNA-PCR (RAPD-PCR) fingerprinting of 18 isolates from fecal samples from 10 healthy subjects showed that an individual can have up to four different F. prausnitzii strains and that these are grouped by individual (35). In addition, 16S rRNA gene analysis of these isolates indicated that each strain has a unique sequence but that the isolates group into two F. prausnitzii phylogroups that have 97% 16S rRNA gene sequence similarity. These two phylogroups coexist in healthy individuals (35) and comprise approximately 97% of F. prausnitzii 16S rRNA sequences found in feces (10, 41). However, it remains to be elucidated how many different F. prausnitzii strains are hosted by patients with gut diseases, and it is still unknown if the F. prausnitzii population found in patients suffering from intestinal disorders differs from that found in healthy subjects.
This work describes the F. prausnitzii populations present in inflammatory bowel disease (IBD), CRC, and IBS patients. The populations were determined by using a species-specific PCR followed by denaturing gradient gel electrophoresis (DGGE) and then sequencing of the bands. The main objective, therefore, was to determine if the phylotype profiles correlate with certain intestinal disorders. We also investigated whether or not certain phylotypes are associated with patients' clinical characteristics in order to reveal biomarkers potentially useful for diagnostic support and/or in establishment of a prognosis.
MATERIALS AND METHODS
Patients, clinical data, and sampling.
A Spanish cohort consisting of 118 volunteers (36 CD, 23 UC, 6 IBS, and 22 CRC patients and 31 healthy control [H] subjects) was included (Table 1). Subjects were recruited by the Gastroenterology Services of the Hospital Universitari Dr. Josep Trueta (Girona, Spain) and the Hospital Santa Caterina (Salt, Spain). Patients were gender and age matched for all groups except CRC patients, who were significantly older than all the other groups (P < 0.001), and H subjects, who were older than those with IBD (P ≤ 0.013). IBD was diagnosed according to standard clinical, pathological, and endoscopic criteria and categorized as stated in the Montreal classification (42). Rome III criteria (available at http://www.romecriteria.org/criteria/) were used to diagnose IBS. A CRC diagnosis was established by colonoscopy and biopsy. The control group (H subjects) consisted of subjects with normal colonoscopy findings who underwent this procedure for reasons such as rectorrhagia (n = 9), a familial history of colorectal cancer (n = 11), and abdominal pain (n = 11). None of the subjects had received antimicrobial treatment for at least 2 months before the colonoscopy.
TABLE 1.
Sample size and clinical characteristics of subjectsa
| Characteristic | Value for the following: |
P valuec | ||||
|---|---|---|---|---|---|---|
| H subjectsb | IBS patients | IBD patients |
CRC patients | |||
| UC | CD | |||||
| No. of patients | 31 | 6 | 23 | 36 | 22 | |
| Mean ± SD age (yr) | 49.2 ± 16.3 | 42.4 ± 11.4 | 38.4 ± 14.0 | 34.5 ± 12.8 | 70.1 ± 10.3 | <0.001d |
| No. (%) of male patients | 15 (48.4) | 2 (20.0) | 15 (65.2) | 21 (58.3) | 11 (50.0) | 0.538e |
| No. (%) of patients with active disease | NA | NA | 17 (73.9) | 23 (63.8) | NA | 0.365e |
| No. (%) of patients with previous surgery | 0 | ND | 2 (8.7) | 7 (19.4) | ND | 0.145e |
| No. (%) smokers | 0 | 0 | 2 (8.7) | 4 (11.1) | 1 (4.5) | 0.386e |
| No. (%) of patients receiving the following treatmentf: | 0.520e | |||||
| No treatment | NA | NA | 10 (43.5) | 11 (30.6) | NA | |
| Mesalazine | NA | NA | 2 (16.7) | 3 (8.3) | NA | |
| Moderate immunosuppressant | NA | NA | 4 (17.4) | 11 (30.6) | NA | |
| Anti-TNF-α (infliximab, adalimumab) | NA | NA | 4 (17.4) | 7 (19.4) | NA | |
| No. (%) of patients with the following UC classificationg: | NA | |||||
| Ulcerative proctitis (E1) | NA | NA | 4 (17.4) | NA | NA | |
| Distal UC (E2) | NA | NA | 12 (52.2) | NA | NA | |
| Extensive UC or pancolitis (E3) | NA | NA | 4 (17.4) | NA | NA | |
| CD Montreal classification | ||||||
| No. (%) of patients with the following age at diagnosish: | 0.309d | |||||
| ≤16 yr (A1) | NA | NA | 1 (4.3) | 3 (8.3) | ND | |
| 17–40 yr (A2) | NA | NA | 11 (47.8) | 23 (63.8) | ND | |
| ≥41 yr (A3) | NA | NA | 7 (30.4) | 7 (19.4) | ND | |
| No. (%) of patients with CD at the following location: | NA | |||||
| Ileum (L1) | NA | NA | NA | 11 (30.5) | NA | |
| Colon (L2) | NA | NA | NA | 11 (30.5) | NA | |
| Ileocolon (L3) | NA | NA | NA | 9 (25.0) | NA | |
| No. (%) of patients with the following disease behaviori: | NA | |||||
| Nonstricturing, nonpenetrating (B1) | NA | NA | NA | 20 (55.6) | NA | |
| Stricturing (B2) | NA | NA | NA | 4 (11.1) | NA | |
| No. (%) of patients with the following CRC subtypej: | NA | |||||
| Sporadic | NA | NA | NA | NA | 11 (50.0) | |
| Hereditaryk | NA | NA | NA | NA | 1 (4.5) | |
H, healthy control; IBS, irritable bowel syndrome; IBD, inflammatory bowel disease; UC, ulcerative colitis; CD, Crohn's disease; CRC, colorectal cancer; TNF-α, tumor necrosis factor alpha; ND, not determined; NA, not applicable.
Controls consisted of subjects who underwent colonoscopy for different reasons: 9/31 for rectorrhagia, 11/31 for a familial history of colorectal cancer, and 11/31 for abdominal pain.
Groups were compared by nonparametric statistical tests, and a P value of ≤0.05 was considered significant.
Mann-Whitney U test.
χ2 test.
Medical treatment at the time of sampling was available in 33/36 CD patients and 20/23 UC patients.
Maximal disease extent at the time of sampling was available for 20/23 UC patients and 31/36 CD patients.
Age of disease onset was available for 33/36 CD patients and 19/23 UC patients.
Disease behavior at last follow-up before the time of sampling was available in 24/36 CD patients, and none had penetrating CD (B3).
The presence or absence of relatives with CRC could be clearly tracked in only 12/22 CRC patients.
Patients were included within this category if a first-grade relative had also had CRC.
Prior to colonoscopy, patients were subjected to cleansing of the gastrointestinal tract using an osmotic laxative (Casenglicol) following the manufacturer's guidelines. During routine colonoscopy, a biopsy sample from the transverse colon was collected from each subject following standard procedures. When it was not technically possible to collect a biopsy sample from the transverse colon, rectal biopsy samples were taken instead, because the mucosa-associated community profile is rather stable along the gut (15, 43). All biopsy specimens were immediately placed in sterile tubes without any buffer and stored at −80°C following completion of the whole endoscopic procedure and upon analysis.
Ethical consideration.
This work was approved by the Ethics Committee of Clinical Research of the Hospital Universitari Dr. Josep Trueta (Girona, Spain) and the Institut d'Assistència Sanitària of Girona (Salt, Spain) on 24 February 2009 and 21 April 2009, respectively. Informed consent was obtained from the subjects before enrollment.
Sample treatment and DNA extraction.
Prior to DNA extraction, the biopsy specimens were subjected to two mild ultrasound wash cycles as previously reported (15) to discard transient and loosely attached bacteria. DNA was extracted using a NucleoSpin Tissue kit (Macherey-Nagel GmbH & Co., Germany). The support protocol for Gram-positive bacteria and the RNase treatment step were carried out. Genomic DNA was stored at −80°C until use. The DNA concentration and the purity of the extracts were determined with a NanoDrop ND-100 spectrophotometer (NanoDrop Technologies, USA).
Design of primers to study F. prausnitzii populations.
A conventional PCR assay consisting of a species-specific primer set targeting the 16S rRNA gene was designed. 16S rRNA gene sequences from F. prausnitzii and from other Ruminococcaceae (see Table S1 in the supplemental material) were recovered from GenBank and aligned using the ClustalW program (44). Specific primers targeting DNA regions exclusive to F. prausnitzii were manually designed and further checked using Primer Express (version 3.0) software (Applied Biosystems, Foster City, CA, USA) and NetPrimer software (Premier Biosoft International, CA, USA) to check for primer-dimer structures, hairpins, and possible cross-dimer interactions between oligonucleotides.
The final primer set designed for use in this study consisted of primers Fpra 427F (5′-TAAACTCCTGTTGTTGAGGAAGAT-3′) and Fpra 1127R (5′-TTTGTCAACGGCAGTCYKG-3′), whose sequences flank an ∼700-bp fragment that includes variable regions V3 to V6.
Oligonucleotide specificity was tested in silico by comparing the sequences with those in the Ribosomal Database Project II (45) and GenBank databases through the use of the Seq Match and BLAST (46) tools, respectively. Additionally, an in vitro inclusivity-exclusivity test was performed (see Table S2 in the supplemental material for details). Primer set coverage was evaluated using the Silva TestPrime (version 1.0) program (available at http://www.arb-silva.de/search/testprime/). A sensitivity test to determine the detection limit of the reaction (i.e., the lowest concentration at which 95% of the positive samples were detected [47]) was performed (see the text in the supplemental material).
PCR amplification and DGGE fingerprinting.
For F. prausnitzii population profiling, the 16S rRNA gene was partially amplified from extracted genomic DNA using the new primer set designed in this study. To obtain PCR products suitable for DGGE analysis, a GC-rich sequence was attached to the 5′ end of the forward primer (5′-CGCCCGCCGCGCCCCGCGCCCGGCCCGCCGCCCCCGCCCC-3′) as described by Muyzer et al. (48). All primers were obtained from Metabion (Steinkirchen, Germany).
PCR was optimized by testing different concentrations of MgCl2 (0.25 to 15 mM), deoxyribonucleoside triphosphates (dNTPs; 0.1 to 3 mM), and primers (50 to 900 nM each primer). The optimized reaction mixture was used with all samples and was composed of 1× buffer (II) (10×; Applied Biosystems, Foster City, CA, USA), 2.5 mM MgCl2 (25 mM; Applied Biosystems), 0.2 mM dNTPs (10 mM; Applied Biosystems), 0.2 μM the GC-Fpra 427F primer and 0.2 μM the Fpra 1127R primer (10 pmol/ml each), 0.05 U/μl of AmpliTaq DNA polymerase (5 U/ml; Applied Biosystems), and 1 μl of genomic DNA as a template in a total volume of 50 μl.
All PCRs were performed in a GeneAmp PCR system 2700 thermocycler (Applied Biosystems, PerkinElmer, CA, USA). PCR conditions were optimized by testing different annealing temperatures (52°C to 70°C). The optimized cycling program was used and consisted of 10 min at 95°C for initial denaturation and DNA polymerase activation, followed by 35 cycles of 30 s at 95°C (denaturation), 30 s at 65°C (annealing), and 1 min at 72°C (extension) and then a final extension of 10 min at 72°C. The products were visualized under UV light after gel electrophoresis on 1.5% (wt/vol) agarose gels in 1× TAE buffer (Tris-acetate-EDTA, pH 8.0) stained with ethidium bromide (0.5 μg/ml).
DGGE was carried out with an Ingeny-phorU2 system (Ingeny, Goes, The Netherlands) in 6% (wt/vol) acrylamide gels with a vertical denaturing gradient ranging from 30% to 70% urea-formamide. Electrophoreses were run in 0.5× TAE buffer at 60°C and at a constant voltage of 120 V for a minimum of 16 h. The gels were then stained with 1× SYBR gold (Molecular Probes Europe, Invitrogen) for 45 min in the dark, visualized under UV light, and photographed.
Sequencing, sequence editing, and analyses.
All detectable bands were excised from the gel and DNA was extracted as previously reported (15). The DNA was then reamplified by PCR as described above, except that forward primer Fpra 427F without the GC clamp was used. Positive PCR products were cleaned and sequenced in both directions (forward and reverse) by Macrogen Inc. (Seoul, South Korea). Prior to analysis, sequence chromatograms were manually inspected, and none presented double peaks. The quality of the sequences was also checked with Sequence Scanner software (version 2; Applied Biosystems, Foster City, CA, USA). Only those with high trace scores (the trace score is the average base call quality value of the bases in the sequence after it is trimmed) were considered for further analyses. Sequences were assembled to obtain high-quality consensus sequences, which were further manually refined using the BioEdit sequence alignment editor (version 7.0.9.0) (49). The presence of chimeras was subsequently checked using the DECIPHER tool (50).
To validate the accuracy of the sequences, two biopsy specimens from the same patient were analyzed as previously described, and identical consensus sequences were obtained from the bands recovered (data not shown).
Consensus sequences were compared against the sequences in the NCBI database by using the BLASTN search tool (46) in order to determine the closest previously reported sequence and isolate. An alignment of the consensus sequences was performed using the ClustalW program (44), with manual curation being performed if needed. For further analysis, sequences of 581 nucleotides in length (the region from V3 to V6, which consists of positions 525 to 1106 in the numbering for the Escherichia coli sequence and which corresponds to those positions recovered for all sequences) were used.
A neighbor-joining (NJ) (51) distance matrix using the Jukes-Cantor (JC) correction was calculated in mothur software (http://www.mothur.org) (52), which was then used to assign sequences to operational taxonomic units (OTUs) using the farthest neighbor method at cutoffs of 0.03 and 0.01 (i.e., minimum similarities of 97% [OTU97] and 99% [OTU99] were required for any pair of sequences to belong to the same phylogroup or phylotype, respectively). Representative sequences for each OTU (hereafter named OTU97 and OTU99 sequences, respectively) were identified and used for further analyses of the distribution by group of patients. We refer to the OTUs defined at >99% sequence identity as “phylotypes” and those defined at >97% sequence identity as “phylogroups.” Unique sequences (100% similarity, hereafter named OTU100 sequences) were also considered to compare the sequence-based population composition and to study the richness by group of patients.
Statistics.
The clustering of all samples was performed according to the presence or absence of unique sequences by hierarchical analysis by the intergroup joining method based on the Dice coefficient. The same analysis was performed for groups of patients clustering according to their OTU99 and OTU97 sequence compositions.
The nonparametric Kruskal-Wallis test and the Mann-Whitney U test were used to test for differences in richness for variables with more than two categories and for pairwise comparisons, respectively, according to subject diagnostics, IBD subtype, activity status (active CD and UC when the Crohn's disease activity index was >150 [53] and the Mayo score was >3, respectively), smoking habit, intestinal resection, use of medication, and tumor state for CRC patients.
Pearson's χ2 test was carried out to compare the prevalence of OTUs defined at 99% and 97% similarity, taking into account the same clinical variables mentioned above in order to determine OTUs specific for each condition.
All statistical analyses were conducted via SPSS software (version 15.0; SPSS Inc., Chicago, IL). Significance was established when the P value was ≤0.05.
Nucleotide sequence accession numbers.
The 16S rRNA gene sequences obtained in this study were deposited in the GenBank/EMBL/DDBJ database under accession numbers KP005458 through KP005741.
RESULTS
Features of the novel PCR-DGGE assay to study F. prausnitzii population.
In this study, a novel oligonucleotide set was designed to specifically amplify F. prausnitzii (see the supplemental material). The detection limit of the reaction was 2,623 target genes, which indicates that if we had many replicate samples with 2,623 copies of the 16S rRNA gene of F. prausnitzii, no more than 5% failed reactions should occur. The banding pattern obtained by DGGE represents the major constituents of the community analyzed (54). Species that contribute <1% of the total population would not be readily detected by this molecular approach (48). This is expected to have a minor effect in the present study, however, because Faecalibacterium prausnitzii represents at least 6% of the mucosa-associated microbial community in healthy subjects (1, 4–11).
The in silico analysis of the oligonucleotide set chosen showed that primer Fpra 427F was specific for F. prausnitzii and targeted all the isolates, whereas primer Fpra 1127R was genus specific. The coverage provided by the Fpra 427F-Fpra 1127R primer set was 70.6% of the Faecalibacterium sequences in the Silva data set. The remaining 29.4% should be regarded as sequences of this genus but not sequences of F. prausnitzii (other species that have not yet been described probably exist within this genus).
Inclusivity-exclusivity tests were conducted in vitro by testing DNA from 9 F. prausnitzii isolates and from 71 additional representative bacterial species (see Table S2 in the supplemental material), and these confirmed that the PCR was totally specific. All the F. prausnitzii isolates were successfully detected, thus producing a single PCR product, and there was no cross-reaction with any of the nontarget microorganisms (see Table S2 in the supplemental material).
Sequence analysis and F. prausnitzii population composition.
From the samples from the 118 volunteers engaged in the study, a total of 284 partial F. prausnitzii 16S rRNA gene sequences (66 from H subjects, 17 from IBS patients, 48 from UC patients, 97 from CD patients, and 56 from CRC patients) were obtained from the PCR-denaturing gradient gels. This represented 88.75% of the observed bands, whereas the remaining bands (i.e., 11.25% of the observed bands) were not recovered due to methodological problems (i.e., improper band excision from the gel, an inability to reamplify the bands for further sequencing) and thus were not included in the analysis. Among the sequences retrieved, 135 unique sequences were found, and these could be grouped into 40 OTUs on the basis of the >99% sequence similarity criterion and 5 OTUs on the basis of the >97% sequence similarity criterion (see Tables S3 to S5 in the supplemental material). The correspondence between OTUs at different cutoffs of similarity is shown in Table S6 in the supplemental material (i.e., in which OTU100 OTUs are included within the OTU97 and OTU99 categories).
(i) F. prausnitzii population similarity and richness (OTU100 sequence analysis).
The sequences were grouped into 135 unique sequences (i.e., OTU100; see Table S3 in the supplemental material) and analyzed in order to compare the sequence-based population composition and to estimate the F. prausnitzii richness between groups of patients.
Clustering analysis of the OTU100 sequences hosted by each subject revealed that the F. prausnitzii populations were rather individual specific, as few patients featured identical population compositions. Furthermore, 24.6% of the subjects had an F. prausnitzii population composition very different from that found in any other patient studied, thus featuring their own branching point in the cluster analysis (Fig. 1). Noticeably, these were mainly H subjects (54.8%), whereas only 16.7% of IBS patients, 21.7% of UC patients, 4.5% of CRC patients, and 22.2% of CD patients had particular F. prausnitzii population profiles composed of a set of sequences not found in any other patient (P = 0.001). Within the group of CD patients, over 54% of the patients with colonic CD featured unique F. prausnitzii populations, but unique F. prausnitzii populations were found in only approximately 10% of patients with an ileal disease location (either ileal CD or ileocolonic CD) (P = 0.025).
FIG 1.
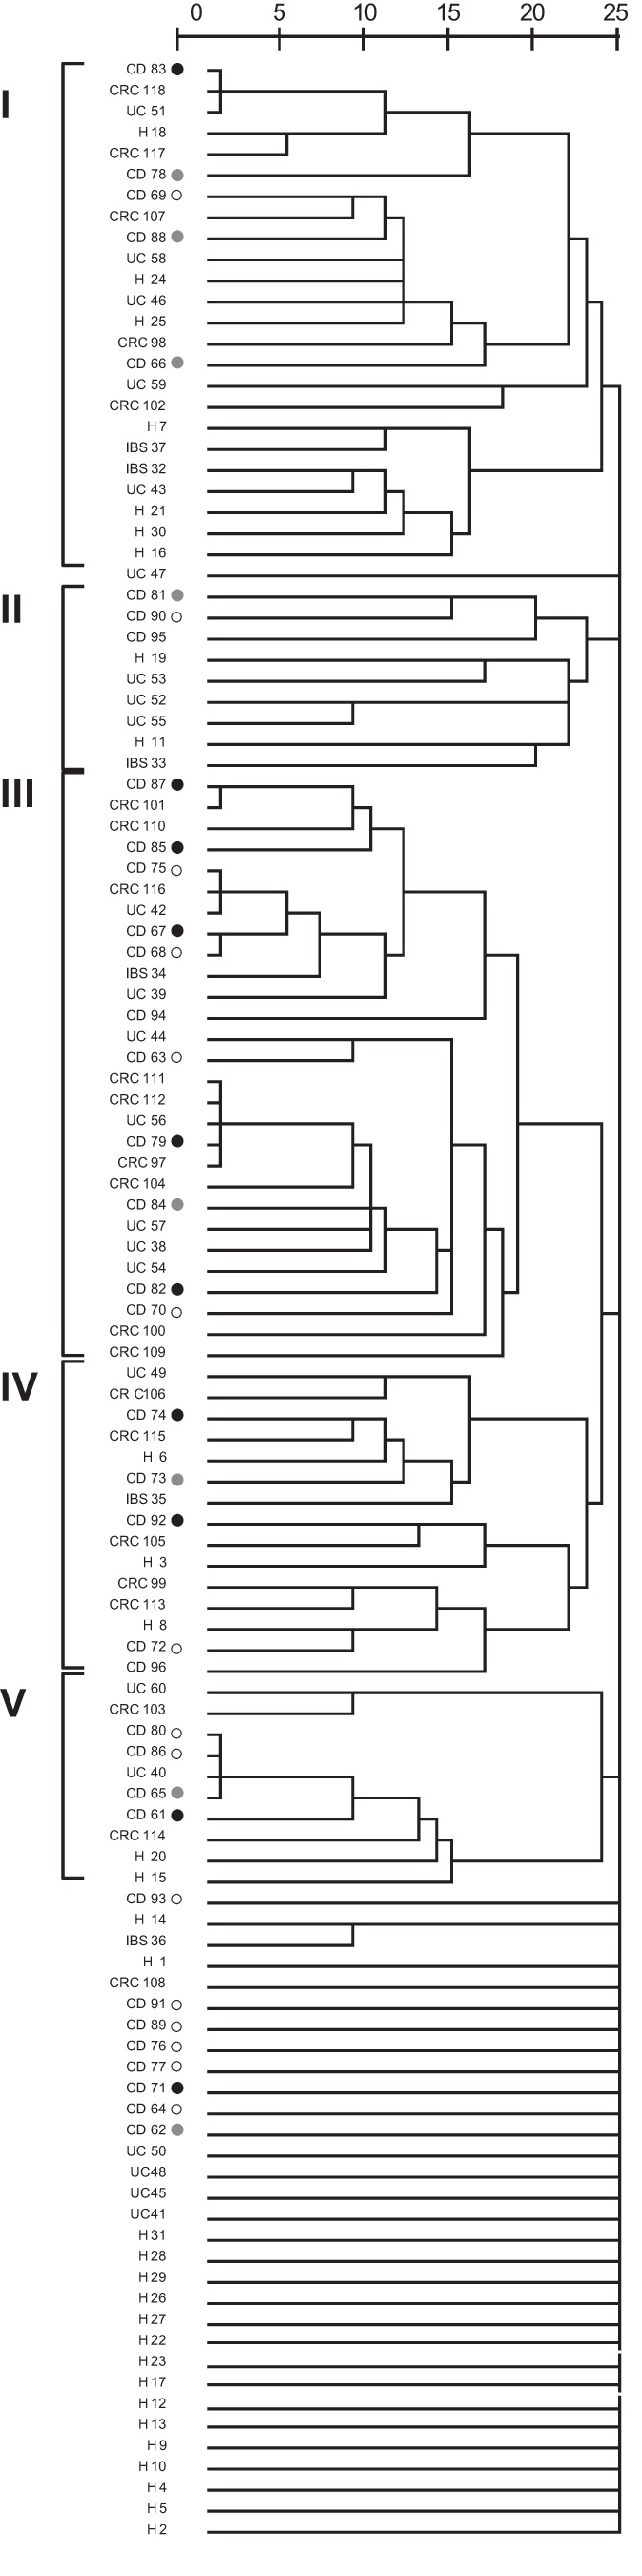
Hierarchical distance clustering showing the relationships of patient samples on the basis of the F. prausnitzii population determined by comparing unique sequences (OTU100 sequences) by the intergroup joining method based on the Dice coefficient. The scale bar describes the similarity between profiles. ○, colonic CD;  , ileocolonic CD; ●, ileal CD. I to V, the main groups in which patients clustered.
The sequences from the remaining 75.4% of the subjects grouped into five main clusters. Interestingly, sequences from none of the H subjects were grouped in cluster III, which included the sequences from over 30% of IBD and CRC patients (P = 0.005). This clustering was not explained by any other patient variable tested (age, gender, smoking habit, disease activity index, age at the onset of disease, intestinal resection, and use of medication).
With regard to F. prausnitzii richness, all volunteers had populations comprising from one to five unique sequences of this species. The average number of unique sequences of F. prausnitzii per subject was lower in IBD patients (1.7 ± 0.8 in UC patients and 1.6 ± 0.8 in CD patients) than in H, IBS, and CRC subjects (2.1 ± 1.1 in H subjects, 2.2 ± 1.0 in IBS patients, and 2.5 ± 1.2 in CRC patients) (P = 0.064). The clinical data for the patients did not explain the differences in the number of unique sequences found.
The percentage of subjects with three or more unique F. prausnitzii sequences was higher in the H, IBS, and CRC groups than in IBD patients (P = 0.027) (Fig. 2). These data suggest that IBD patients feature less F. prausnitzii microdiversity, whereas CRC and IBS patients present a higher number of unique F. prausnitzii subtypes in the gut, with the numbers being similar to the numbers found in H subjects.
FIG 2.
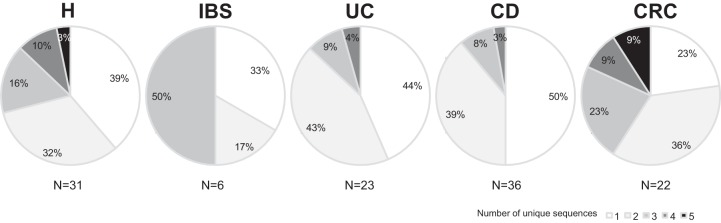
Percentage of patients with F. prausnitzii populations with one to five unique sequences (OTU100 sequences) by group of subjects.
(ii) F. prausnitzii population composition at the phylotype level (OTU99 sequence analysis).
For analysis of the F. prausnitzii population composition at the phylotype level, all the samples from patients with the same diagnosis were analyzed together in order to compare the F. prausnitzii populations hosted by H subjects and patients with intestinal disorders. We refer to the 40 OTUs defined according to a >99% sequence identity as “phylotypes.” All volunteers had populations with from one to four phylotypes of this species, but no significant differences in the average number of OTU99 phylotypes per patient were observed between groups (P = 0.558). In H subjects, 20 different phylotypes were recovered; however, in IBS, UC, CD, and CRC patients, the values were lower (7, 9, 16, and 14, respectively) (Fig. 3). The highest complexity of the community found in H subjects was confirmed from estimates of the Shannon diversity index (H′H = 2.24), whereas the lowest diversity index was calculated for CD patients (H′CD = 1.90), even though more subjects in the cohort analyzed had this disorder. Patients with other gut disorders also presented lower diversity index values than H subjects (H′IBS = 1.49, H′UC = 1.58, H′CRC = 1.83).
FIG 3.
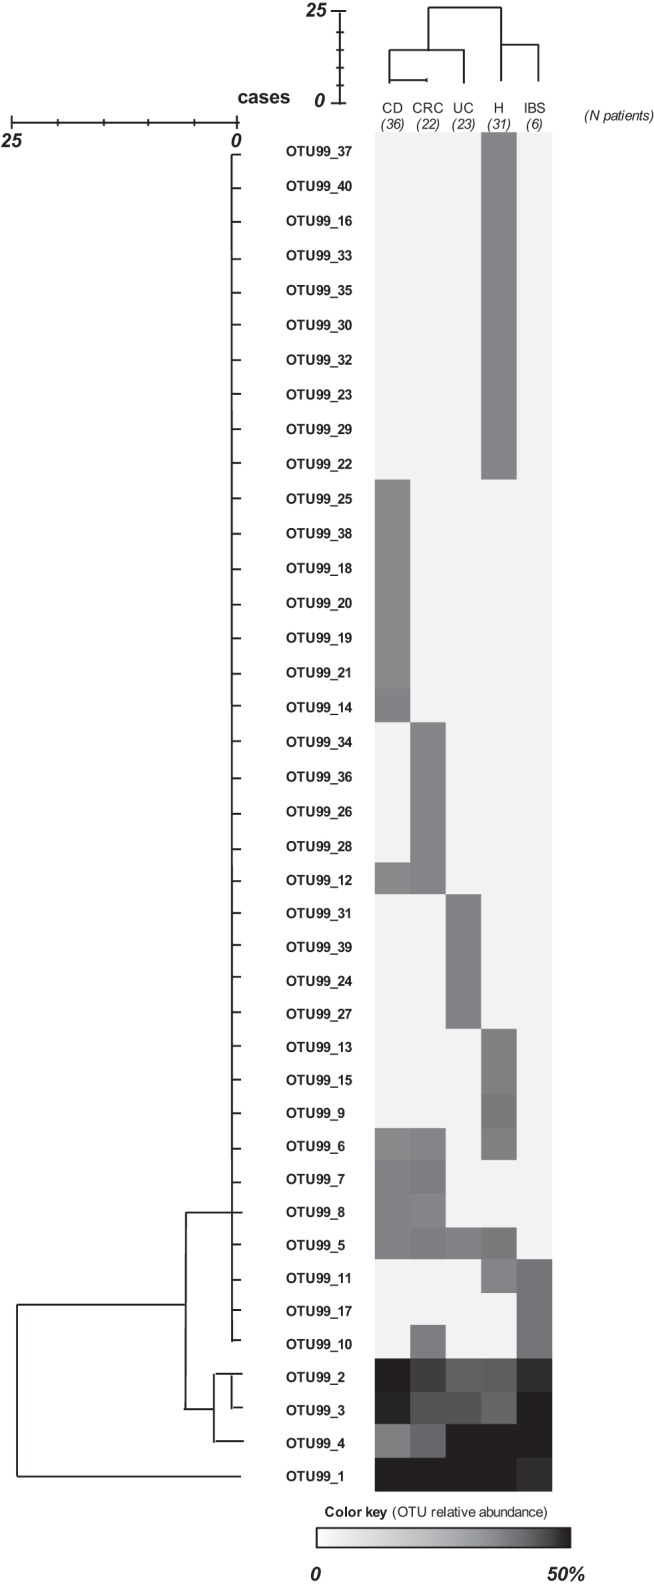
Heat map showing the relative abundance of sequences assigned to each operational taxonomic unit at a 99% level of 16S rRNA gene sequence similarity (OTU99 sequences) by group of subjects. Relative abundance was calculated as the percentage of sequences in an OTU from all sequences recovered from that group of patients. Hierarchical distance clustering showing a relationship between OTU99 sequences and groups of patients on the basis of their distribution (obtained using the intergroup joining method based on the Dice coefficient) is represented. The scale bar describes the similarity between profiles.
Cluster analysis of phylotypes by patient group revealed that those with IBD and CRC host F. prausnitzii populations different from those hosted by H subjects (Fig. 3). The most prevalent phylotype (OTU1 among the OTU99 sequences [OTU99_1]) accounted for approximately 20% of the sequences in H and IBS subjects and about 40% in IBD and CRC patients (P = 0.002) (Fig. 3; see also Table S4 in the supplemental material). The next three most prevalent OTUs (OTU99_2, OTU99_3, and OTU99_4) were also detected in all the patient groups (Fig. 3; see also Table S4 in the supplemental material), representing between 8% and 50% of the sequences, depending on the patient group, but the differences in their prevalence between groups of patients did not reach statistical significance. Twelve OTUs (representing 54.8% of the sequences recovered from H subjects) were exclusive of the H group. On the other hand, 22.2% of the sequences from CD patients (seven OTUs) were not shared with patients with other intestinal disorders. Similarly, four UC patient-specific OTUs and four CRC patient-specific OTUs were also found, accounting for 17.4% and 18.2% of the sequences from each group of patients, respectively. Finally, OTU99_17 accounted for 16.7% of sequences from IBS patient and was found only in this group of patients.
Altogether these observations suggest that the most prevalent F. prausnitzii phylotypes (OTU99_1 through OTU99_4) are present in both H subjects and patients with disease but that rare phylotypes (OTU99_5 to OTU99_40) not found in all the patients exist and could have emerged or disappeared under certain gut conditions, since they are disease specific or exclusively found in healthy subjects.
(iii) F. prausnitzii phylogroup distribution by group of patients (OTU97 sequence analysis).
Of the total of 284 sequences recovered, 279 sequences grouped together into two main OTUs when analyzed on the basis of the >97% sequence similarity criterion, and these corresponded to previously defined phylogroups I and II (35) (Fig. 4; see also Table S5 in the supplemental material). Thus, we refer to the OTUs defined according to a >97% sequence identity as “phylogroups.” Phylogroup II (OTU1 among the OTU97 phylogroups [OTU97_1]) consisted of 56.7% of the total sequences recovered (corresponding to 161 sequences), whereas phylogroup I (OTU97_2) was slightly less prevalent (41.55%, 118 sequences). The remaining five sequences, representing less than 2% of the sequences recovered, were grouped into three different OTUs: a tripleton with sequences from two CD patients and one CRC patient (OTU97_3), a singleton with a sequence from an IBS patient (OTU97_4), and a singleton with a sequence from an H subject (OTU97_5). Noticeably, OTU97_5 presented 95% similarity to the nearest sequence present in databases (see Table S5 in the supplemental material).
FIG 4.
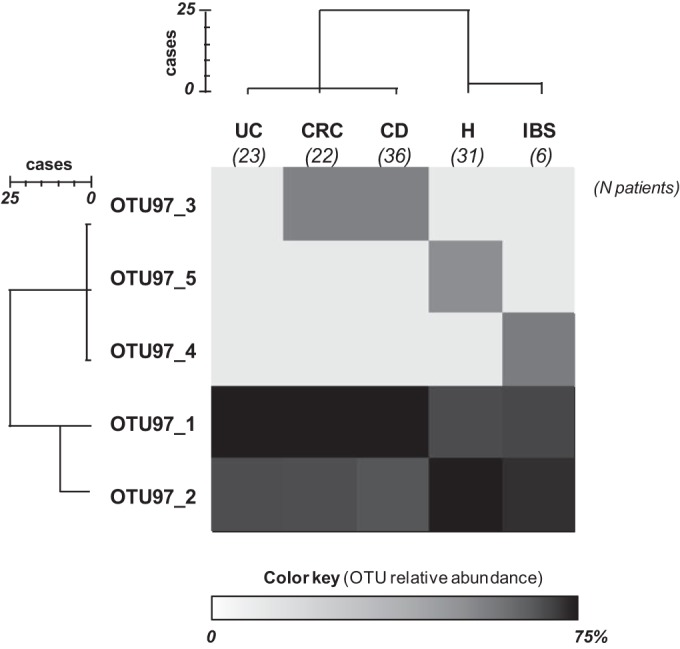
Heat map showing the relative abundance of sequences assigned to each operational taxonomic unit at a 97% level of 16S rRNA gene sequence similarity (OTU97 sequences) by group of subjects. Relative abundance was calculated as the percentage of sequences in an OTU from all sequences recovered from that group of patients. Hierarchical distance clustering showing a relationship between OTU97 sequences and groups of patients on the basis of their distribution (obtained using the intergroup joining method based on the Dice coefficient) is represented. The scale bar describes the similarity between profiles.
All subjects had populations with from one to three phylogroups of F. prausnitzii. Significant differences in the average number of OTUs per patient were not found between groups by OTU97 sequence analysis (P = 0.285). However, the prevalences of phylogroups I and II differed between groups of patients (Fig. 4). More than 52% of the sequences from H and IBS subjects belonged to phylogroup I, whereas most of the sequences from UC, CD, and CRC patients belonged to phylogroup II (62.5%, 66%, and 62.5%, respectively) (P = 0.001), suggesting that phylogroup I is more frequently compromised in the latter. Cluster analysis of the phylogroups by patient group also revealed that those with IBD and CRC host different F. prausnitzii populations than H subjects at this cutoff level (Fig. 4).
Analysis of the co-occurrence of both phylogroups (Fig. 5) showed that only 26.1% of UC patients and 22.2% of CD patients harbored both phylogroups simultaneously, while more than 38% of H, IBS, and CRC subjects had sequences from both phylogroups, although the differences did not reach statistical significance (P = 0.270). It is of note that no ileal CD patients simultaneously had both phylogroups (P = 0.060).
FIG 5.
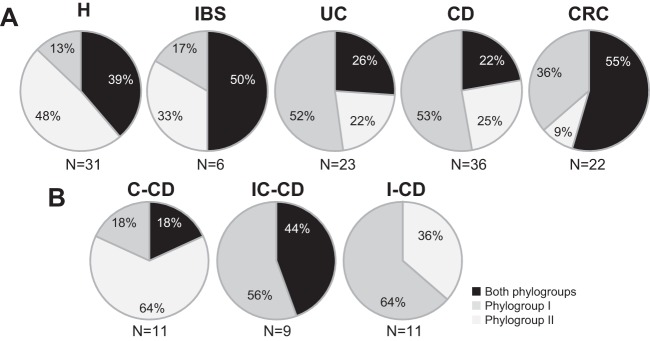
Prevalence of F. prausnitzii phylogroups (OTU97 analysis) in healthy subjects and patients with different intestinal disorders (A) and by Crohn's disease subtype (B). C-CD, colonic-CD; IC-CD, ileocolonic-CD; I-CD, ileal-CD.
These results suggest that patients with intestinal disorders feature an altered prevalence of phylogroups, mostly characterized by the presence of monophylogroup populations in some IBD patients, especially those with ileal CD.
Putative indicator sequences for differential diagnosis and/or disease prognostics.
We observed differences in the prevalence of phylogroups and phylotypes between groups of patients. Therefore, we further explored which OTUs could be considered potential biomarkers for disease diagnosis. The prevalence of four OTUs by OTU99 sequence analysis was statistically significantly different between the groups of patients (P ≤ 0.027) (Table 2). In particular, OTU99_1 was found to be more prevalent in IBD and CRC patients than in H subjects (P = 0.020), OTU99_10 was found in 16.7% of IBS patients and 9.1% CRC patients but not in H or in IBD subjects (P = 0.027), and OTU99_11 and OTU99_17 were exclusively found in 16.7% of IBS patients (P = 0.001).
TABLE 2.
Main differences observed at different 16S rRNA gene sequence similarity cutoffs after comparisons of sequences from healthy subjects and patients with several gut disordersa
| Similarity cutoff (%)b | OTU | Total no. of sequences | Nearest F. prausnitzii isolate |
No. (%) of patients |
P value | ||||||
|---|---|---|---|---|---|---|---|---|---|---|---|
| Strain | Similarity (%) | GenBank accession no. | H subjects (n = 31) | IBS patients (n = 6) | UC patients (n = 23) | CD patients (n = 36) | CRC patients (n = 22) | ||||
| 99 | OTU99_1 | 104 | HTF-I | 99 | HQ457031.1 | 12 (38.7) | 2 (33.3) | 17 (73.9) | 24 (66.7) | 16 (72.7) | 0.020 |
| OTU99_10 | 3 | A2-165 | 99 | AJ270469.2 | 0,0 | 1 (16.7) | 0.0 | 0.0 | 2 (9.1) | 0.027 | |
| OTU99_11 | 2 | S4L/4 | 99 | HQ457025.1 | 0,0 | 1 (16.7) | 0.0 | 0.0 | 0.0 | 0.001 | |
| OTU99_17 | 1 | A2-165 | 97 | AJ270469.2 | 0,0 | 1 (16.7) | 0.0 | 0.0 | 0.0 | 0.001 | |
| 97 | OTU97_1 | 161 | HTF-I | 99 | HQ457031.1 | 16 (51.6) | 4 (66.7) | 18 (78.3) | 31 (86.1) | 20 (90.9) | 0.005 |
| OTU97_2 | 118 | S3L/3 | 99 | HQ457024.1 | 27 (87.1) | 5 (83.3) | 11 (47.8) | 16 (44.4) | 14 (63.6) | 0.003 | |
| OTU97_4 | 1 | A2-165 | 97 | AJ270469.2 | 0 | 1(16.7) | 0 | 0 | 0 | 0.001 | |
H, healthy control; IBS, irritable bowel syndrome; UC, ulcerative colitis; CD, Crohn's disease; CRC, colorectal cancer.
Different phylotypes were calculated by the farthest neighbor method with mothur using a cutoff of 99% or 97% similarity of the 16S rRNA gene sequence.
Several OTUs were found by OTU99 analysis to be associated with the clinical characteristics of the particular disease. Within the group of IBD patients, OTU99_24 was exclusively found in 33% of patients with inactive UC (P = 0.015), whereas OTU99_8 was especially absent in patients with active CD (P = 0.008). Remarkably, OTU99_8 and OTU99_4 were found in all CRC patients featuring the most severe tumor state (T4) (P < 0.001 and P = 0.033, respectively). Moreover, OTU99_7 was not found in CRC patients with tumor states T3 and T4, but it was carried by all CRC patients with a T1 tumor state, 12.5% of CRC patients with a T2 tumor state, and 5.6% of CD patients (P = 0.013).
Referring to phylogroups (OTUs by OTU97 analysis), 87.1% of H subjects and 83.3% of IBS patients had phylogroup I, whereas the proportions were reduced to 63.6% for CRC patients, 47.8% for UC patients, and 43.2% for CD patients (P = 0.003) (Table 2). In contrast, a higher prevalence of phylogroup II was observed in IBD and CRC patients (78.3% in UC patients, 83.8% in CD patients, and 90.9% in CRC patients) than in H and IBS subjects (51.6% and 66.7%, respectively) (P = 0.005). No further differences in relation to the patients' clinical characteristics were observed at the phylogroup level.
DISCUSSION
In this study, we describe for the first time the richness and the distribution of phylotypes and phylogroups of F. prausnitzii. Our data reveal that F. prausnitzii populations are rather individual specific, especially in H subjects, in line with previous evidence from studies of F. prausnitzii isolates, which were found to group by individual according to their 16S rRNA gene sequences and their RAPD-PCR fingerprints (35). Despite the fact that we have observed that the F. prausnitzii populations in each individual can consist of F. prausnitzii isolates with up to five different sequences, we found that in over 87% of IBD patients their F. prausnitzii populations consisted of F. prausnitzii isolates with just one or two different sequences. In contrast, at least 30% of H, IBS, and CRC subjects hosted populations of isolates with more than three different sequences. Multiple 16S rRNA gene copies with slight sequence variation can be hosted by a bacterial species, which can affect bacterial community analyses (55). According to data from the rrnDB database (56), F. prausnitzii S3L/3 has a single copy of the 16S rRNA gene, which makes our results more meaningful. To date, only one genome of this species has been fully sequenced and annotated; therefore, the possibility that future studies will reveal that several copies of the 16S rRNA gene are hosted by other members of this species cannot be ruled out. This will reduce the number of unique phylotypes observed per patient. In our study, no differences in the average number of unique sequences per patient were observed according to whether the patient had active or inactive IBD, the IBD or CRC subtype, intestinal resection, use of medication, or smoking habit, suggesting that richness remains reduced over time even if there is endoscopic and clinical signs of remission and regardless of the treatment used.
BLAST analysis revealed that the sequences recovered were of high similarity to the sequences of previously characterized strains of this species. Only two of the sequences featured ≤95% similarity with the F. prausnitzii sequences found previously. This finding suggests that novel and rare phylotypes of F. prausnitzii have yet to be retrieved by cultivation techniques. The sequences of isolates of both phylogroups I and II (35) were detected in all groups of patients, but in some patients, especially IBD patients, we detected only one of the two main phylogroups. In general, all patients suffering from an intestinal disorder exhibited a reduction in phylotype richness which was not recovered during periods of remission or in patients with mild states of the disease, suggesting that alterations in this population struggle to normalize with the patient's current treatments. New therapies to recover all the diversity of F. prausnitzii in these patients should be considered.
Differences in phylotype and phylogroup prevalence between patients with different diagnoses allowed us to discriminate patients suffering from intestinal disease, especially those with IBD and CRC, from H subjects. This finding is in agreement with the findings of previous studies reporting that phylotypes related to isolate M21/2 (phylogroup I) and/or isolate A2-165 (phylogroup II) are depleted in CD patients compared to their prevalence in H subjects (15, 22). As these results might indicate differences in the abundance of these phylogroups, it would be of interest to conduct quantitative analyses in order to explore their usefulness as biomarkers for the diagnosis and/or prognosis of intestinal disorders. Additionally, further investigation addressing the role of disease-specific sequences and the absence of H subject-associated phylotypes in patients with gut diseases could shed light on how F. prausnitzii can contribute to or prevent the pathogenesis of gut diseases.
Our data have revealed that H subjects and those with intestinal disorders host distinct F. prausnitzii populations. These distinct populations can mainly be attributable not only to differences in the prevalence of the common F. prausnitzii phylotypes but also to the presence of rare OTUs found specifically in each group of patients. These differences in the presence or absence of a specific phylotype can be explained by different abilities to adapt to a diseased gut environment or mucosal status. For instance, it has been reported that CD patients often have acidic stools with elevated bile salt concentrations (57, 58), and other factors, such as oxidative stress or thiol availability, are also likely to lead to a significantly altered microbiota (59, 60). Supporting this hypothesis, F. prausnitzii representatives are sensitive to changes in the gut physicochemical conditions that may occur during disease, such as a pH reduction or a change in the bile salt content (35), and are extremely sensitive to oxygen, although they can persist in environments with oxygen due to a flavin-thiol-dependent extracellular electron shuttle (61). These observations should be taken into account in the development of treatment strategies aiming to restore F. prausnitzii populations in patients suffering from intestinal disorders. Novel treatments like prebiotics could be a strategy in order to boost the remaining F. prausnitzii populations in patients with gut disorders. The use of treatment strategies based on probiotic F. prausnitzii strains that are more tolerant of the gut conditions that prevail during intestinal disturbances could also be a suitable approach.
The observed imbalance in the prevalence of phylogroups between subjects provides an additional way to understand the role of this species in IBD since differences in their prevalence between healthy subjects and IBD patients must have biological relevance; e.g., they may reflect differential responses to the host environment. Currently, no phenotypic trait consistently distinguishes F. prausnitzii members from one or the other phylogroup (35), but the existence of differences in members of different phylogroups due to, for instance, horizontal gene transfer, would not be surprising. Phenotypic differences between isolates from different phylogroups (which also have characteristic 16S rRNA sequences) with respect to their ability to use carbohydrates from the host diet and/or host-derived carbohydrates, as well as their tolerance to bile salts and pH, have been observed (35). It can be hypothesized that differences in phylogroup compositions reflect variations in sensitivity to such environmental factors or to interactions with the host, and it has been demonstrated that the prevalence of F. prausnitzii ATCC 2768 (phylogroup I) and F. prausnitzii A2-165 (phylogroup II) is linked to the modulation of different urinary metabolites related to different host pathways (40). Our study does not allow us to decipher the biological relevance of the changes in population composition that were observed, but it does point out that the F. prausnitzii populations hosted by different groups of subjects are different, and to address this question, further studies based on the isolation and characterization of F. prausnitzii isolates from subjects with these disorders and controls would be interesting.
Conclusion.
Although members of the F. prausnitzii population are shared between healthy subjects and those with gut diseases, there is a loss of richness and a different distribution of specific phylotypes in IBD patients. The imbalance in phylogroups (OTU97_1 and OTU97_2) and the abundance of specific phylotypes can be used as biomarkers to distinguish some intestinal diseases, such as IBD or CRC.
Supplementary Material
ACKNOWLEDGMENTS
This work was partially funded by the Spanish Ministry of Education and Science through project SAF2010-15896. Mireia Lopez-Siles was the recipient of an FI grant from the Generalitat de Catalunya (2010FI_B2 00135), which receives support from the European Union Commission. Harry J. Flint and Sylvia H. Duncan acknowledge support from the Food, Land, and People program of the Scottish government.
We thank Teresa Mas-de-Xaxars for assistance with recruitment of samples from CRC patients, Natàlia Adell from the Serveis Tècnics de Recerca for statistical assistance, Pau Boher for assistance with heat map analysis, and Marc Llirós and Carla Camprubí-Font for critically revising the manuscript. We appreciate the generosity of the patients who freely gave their time and samples to make this study possible and the surgical theater staff of all centers for their dedication and careful sample collection.
Xavier Aldeguer is a consultant from AbbVie and has received honoraria for lectures, including services on speakers' bureaus, from AbbVie and MSD. For the other authors, no conflicts of interest are declared.
Footnotes
Supplemental material for this article may be found at http://dx.doi.org/10.1128/AEM.02006-15.
REFERENCES
- 1.Eckburg PB, Bik EM, Bernstein CN, Purdom E, Dethlefsen L, Sargent M, Gill SR, Nelson KE, Relman DA. 2005. Diversity of the human intestinal microbial flora. Science 308:1635–1638. doi: 10.1126/science.1110591. [DOI] [PMC free article] [PubMed] [Google Scholar]
- 2.Sekirov I, Russell SL, Antunes LC, Finlay BB. 2010. Gut microbiota in health and disease. Physiol Rev 90:859–904. doi: 10.1152/physrev.00045.2009. [DOI] [PubMed] [Google Scholar]
- 3.Qin J, Li R, Raes J, Arumugam M, Burgdorf KS, Manichanh C, Nielsen T, Pons N, Levenez F, Yamada T, Mende DR, Li J, Xu J, Li S, Li D, Cao J, Wang B, Liang H, Zheng H, Xie Y, Tap J, Lepage P, Bertalan M, Batto JM, Hansen T, Le Paslier D, Linneberg A, Nielsen HB, Pelletier E, Renault P, Sicheritz-Ponten T, Turner K, Zhu H, Yu C, Jian M, Zhou Y, Li Y, Zhang X, Qin N, Yang H, Wang J, Brunak S, Dore J, Guarner F, Kristiansen K, Pedersen O, Parkhill J, Weissenbach J, Bork P, Ehrlich SD. 2010. A human gut microbial gene catalogue established by metagenomic sequencing. Nature 464:59–65. doi: 10.1038/nature08821. [DOI] [PMC free article] [PubMed] [Google Scholar]
- 4.Nava GM, Stappenbeck TS. 2011. Diversity of the autochthonous colonic microbiota. Gut Microbes 2:99–104. doi: 10.4161/gmic.2.2.15416. [DOI] [PMC free article] [PubMed] [Google Scholar]
- 5.Baumgart M, Dogan B, Rishniw M, Weitzman G, Bosworth B, Yantiss R, Orsi RH, Wiedmann M, McDonough P, Kim SG, Berg D, Schukken Y, Scherl E, Simpson KW. 2007. Culture independent analysis of ileal mucosa reveals a selective increase in invasive Escherichia coli of novel phylogeny relative to depletion of Clostridiales in Crohn's disease involving the ileum. ISME J 1:403–418. doi: 10.1038/ismej.2007.52. [DOI] [PubMed] [Google Scholar]
- 6.Arumugam M, Raes J, Pelletier E, Le Paslier D, Yamada T, Mende DR, Fernandes GR, Tap J, Bruls T, Batto JM, Bertalan M, Borruel N, Casellas F, Fernandez L, Gautier L, Hansen T, Hattori M, Hayashi T, Kleerebezem M, Kurokawa K, Leclerc M, Levenez F, Manichanh C, Nielsen HB, Nielsen T, Pons N, Poulain J, Qin J, Sicheritz-Ponten T, Tims S, Torrents D, Ugarte E, Zoetendal EG, Wang J, Guarner F, Pedersen O, de Vos WM, Brunak S, Dore J, Antolin M, Artiguenave F, Blottiere HM, Almeida M, Brechot C, Cara C, Chervaux C, Cultrone A, Delorme C, Denariaz G, Dervyn R, et al. 2011. Enterotypes of the human gut microbiome. Nature 473:174–180. doi: 10.1038/nature09944. [DOI] [PMC free article] [PubMed] [Google Scholar]
- 7.Hold GL, Schwiertz A, Aminov RI, Blaut M, Flint HJ. 2003. Oligonucleotide probes that detect quantitatively significant groups of butyrate-producing bacteria in human feces. Appl Environ Microbiol 69:4320–4324. doi: 10.1128/AEM.69.7.4320-4324.2003. [DOI] [PMC free article] [PubMed] [Google Scholar]
- 8.Schwiertz A, Jacobi M, Frick JS, Richter M, Rusch K, Kohler H. 2010. Microbiota in pediatric inflammatory bowel disease. J Pediatr 157:240–244. doi: 10.1016/j.jpeds.2010.02.046. [DOI] [PubMed] [Google Scholar]
- 9.Suau A, Rochet V, Sghir A, Gramet G, Brewaeys S, Sutren M, Rigottier-Gois L, Doré J. 2001. Fusobacterium prausnitzii and related species represent a dominant group within the human fecal flora. Syst Appl Microbiol 24:139–145. doi: 10.1078/0723-2020-00015. [DOI] [PubMed] [Google Scholar]
- 10.Walker AW, Ince J, Duncan SH, Webster LM, Holtrop G, Ze X, Brown D, Stares MD, Scott P, Bergerat A, Louis P, McIntosh F, Johnstone AM, Lobley GE, Parkhill J, Flint HJ. 2011. Dominant and diet-responsive groups of bacteria within the human colonic microbiota. ISME J 5:220–230. doi: 10.1038/ismej.2010.118. [DOI] [PMC free article] [PubMed] [Google Scholar]
- 11.Swidsinski A, Loening-Baucke V, Lochs H, Hale LP. 2005. Spatial organization of bacterial flora in normal and inflamed intestine: a fluorescence in situ hybridization study in mice. World J Gastroenterol 11:1131–1140. doi: 10.3748/wjg.v11.i8.1131. [DOI] [PMC free article] [PubMed] [Google Scholar]
- 12.Miquel S, Martin R, Rossi O, Bermudez-Humaran L, Chatel J, Sokol H, Thomas M, Wells J, Langella P. 2013. Faecalibacterium prausnitzii and human intestinal health. Curr Opin Microbiol 16:255–261. doi: 10.1016/j.mib.2013.06.003. [DOI] [PubMed] [Google Scholar]
- 13.Frank DN, St Amand AL, Feldman RA, Boedeker EC, Harpaz N, Pace NR. 2007. Molecular-phylogenetic characterization of microbial community imbalances in human inflammatory bowel diseases. Proc Natl Acad Sci U S A 104:13780–13785. doi: 10.1073/pnas.0706625104. [DOI] [PMC free article] [PubMed] [Google Scholar]
- 14.Lopez-Siles M, Martinez-Medina M, Busquets D, Sabat-Mir M, Duncan SH, Flint HJ, Aldeguer X, Garcia-Gil LJ. 2014. Mucosa-associated Faecalibacterium prausnitzii and Escherichia coli co-abundance can distinguish irritable bowel syndrome and inflammatory bowel disease phenotypes. Int J Med Microbiol 304:464–475. doi: 10.1016/j.ijmm.2014.02.009. [DOI] [PubMed] [Google Scholar]
- 15.Martinez-Medina M, Aldeguer X, Gonzalez-Huix F, Acero D, Garcia-Gil LJ. 2006. Abnormal microbiota composition in the ileocolonic mucosa of Crohn's disease patients as revealed by polymerase chain reaction-denaturing gradient gel electrophoresis. Inflamm Bowel Dis 12:1136–1145. doi: 10.1097/01.mib.0000235828.09305.0c. [DOI] [PubMed] [Google Scholar]
- 16.Sokol H, Pigneur B, Watterlot L, Lakhdari O, Bermudez-Humaran LG, Gratadoux JJ, Blugeon S, Bridonneau C, Furet JP, Corthier G, Grangette C, Vasquez N, Pochart P, Trugnan G, Thomas G, Blottiere HM, Dore J, Marteau P, Seksik P, Langella P. 2008. Faecalibacterium prausnitzii is an anti-inflammatory commensal bacterium identified by gut microbiota analysis of Crohn disease patients. Proc Natl Acad Sci U S A 105:16731–16736. doi: 10.1073/pnas.0804812105. [DOI] [PMC free article] [PubMed] [Google Scholar]
- 17.Sokol H, Seksik P, Furet JP, Firmesse O, Nion-Larmurier I, Beaugerie L, Cosnes J, Corthier G, Marteau P, Dore J. 2009. Low counts of Faecalibacterium prausnitzii in colitis microbiota. Inflamm Bowel Dis 15:1183–1189. doi: 10.1002/ibd.20903. [DOI] [PubMed] [Google Scholar]
- 18.Swidsinski A, Loening-Baucke V, Vaneechoutte M, Doerffel Y. 2008. Active Crohn's disease and ulcerative colitis can be specifically diagnosed and monitored based on the biostructure of the fecal flora. Inflamm Bowel Dis 14:147–161. doi: 10.1002/ibd.20330. [DOI] [PubMed] [Google Scholar]
- 19.Willing B, Halfvarson J, Dicksved J, Rosenquist M, Jarnerot G, Engstrand L, Tysk C, Jansson JK. 2009. Twin studies reveal specific imbalances in the mucosa-associated microbiota of patients with ileal Crohn's disease. Inflamm Bowel Dis 15:653–660. doi: 10.1002/ibd.20783. [DOI] [PubMed] [Google Scholar]
- 20.Furet JP, Kong LC, Tap J, Poitou C, Basdevant A, Bouillot JL, Mariat D, Corthier G, Dore J, Henegar C, Rizkalla S, Clement K. 2010. Differential adaptation of human gut microbiota to bariatric surgery-induced weight loss: links with metabolic and low-grade inflammation markers. Diabetes 59:3049–3057. doi: 10.2337/db10-0253. [DOI] [PMC free article] [PubMed] [Google Scholar]
- 21.Hansen R, Russell RK, Reiff C, Louis P, McIntosh F, Berry SH, Mukhopadhya I, Bisset WM, Barclay AR, Bishop J, Flynn DM, McGrogan P, Loganathan S, Mahdi G, Flint HJ, El-Omar EM, Hold GL. 2012. Microbiota of de-novo pediatric IBD: increased Faecalibacterium prausnitzii and reduced bacterial diversity in Crohn's but not in ulcerative colitis. Am J Gastroenterol 107:1913–1922. doi: 10.1038/ajg.2012.335. [DOI] [PubMed] [Google Scholar]
- 22.Jia W, Whitehead RN, Griffiths L, Dawson C, Waring RH, Ramsden DB, Hunter JO, Cole JA. 2010. Is the abundance of Faecalibacterium prausnitzii relevant to Crohn's disease? FEMS Microbiol Lett 310:138–144. doi: 10.1111/j.1574-6968.2010.02057.x. [DOI] [PMC free article] [PubMed] [Google Scholar]
- 23.Kabeerdoss J, Sankaran V, Pugazhendhi S, Ramakrishna BS. 2013. Clostridium leptum group bacteria abundance and diversity in the fecal microbiota of patients with inflammatory bowel disease: a case-control study in India. BMC Gastroenterol 13:20. doi: 10.1186/1471-230X-13-20. [DOI] [PMC free article] [PubMed] [Google Scholar]
- 24.Machiels K, Joossens M, Sabino J, De Preter V, Arijs I, Eeckhaut V, Ballet V, Claes K, Van Immerseel F, Verbeke K, Ferrante M, Verhaegen J, Rutgeerts P, Vermeire S. 2013. A decrease of the butyrate-producing species Roseburia hominis and Faecalibacterium prausnitzii defines dysbiosis in patients with ulcerative colitis. Gut 63:1275–1283. doi: 10.1136/gutjnl-2013-304833. [DOI] [PubMed] [Google Scholar]
- 25.McLaughlin SD, Clark SK, Tekkis PP, Nicholls RJ, Ciclitira PJ. 2010. The bacterial pathogenesis and treatment of pouchitis. Ther Adv Gastroenterol 3:335–348. doi: 10.1177/1756283X10370611. [DOI] [PMC free article] [PubMed] [Google Scholar]
- 26.Vermeiren J, Van den Abbeele P, Laukens D, Vigsnaes LK, De Vos M, Boon N, Van de Wiele T. 2012. Decreased colonization of fecal Clostridium coccoides/Eubacterium rectale species from ulcerative colitis patients in an in vitro dynamic gut model with mucin environment. FEMS Microbiol Ecol 79:685–696. doi: 10.1111/j.1574-6941.2011.01252.x. [DOI] [PubMed] [Google Scholar]
- 27.Rajilic-Stojanovic M, Biagi E, Heilig HG, Kajander K, Kekkonen RA, Tims S, de Vos WM. 2011. Global and deep molecular analysis of microbiota signatures in fecal samples from patients with irritable bowel syndrome. Gastroenterology 141:1792–1801. doi: 10.1053/j.gastro.2011.07.043. [DOI] [PubMed] [Google Scholar]
- 28.Balamurugan R, Rajendiran E, George S, Samuel GV, Ramakrishna BS. 2008. Real-time polymerase chain reaction quantification of specific butyrate-producing bacteria, Desulfovibrio and Enterococcus faecalis in the feces of patients with colorectal cancer. J Gastroenterol Hepatol 23:1298–1303. doi: 10.1111/j.1440-1746.2008.05490.x. [DOI] [PubMed] [Google Scholar]
- 29.Sobhani I, Tap J, Roudot-Thoraval F, Roperch JP, Letulle S, Langella P, Corthier G, Tran Van Nhieu J, Furet JP. 2011. Microbial dysbiosis in colorectal cancer (CRC) patients. PLoS One 6:e16393. doi: 10.1371/journal.pone.0016393. [DOI] [PMC free article] [PubMed] [Google Scholar]
- 30.de Goffau MC, Luopajarvi K, Knip M, Ilonen J, Ruohtula T, Harkonen T, Orivuori L, Hakala S, Welling GW, Harmsen HJ, Vaarala O. 2013. Fecal microbiota composition differs between children with beta-cell autoimmunity and those without. Diabetes 62:1238–1244. doi: 10.2337/db12-0526. [DOI] [PMC free article] [PubMed] [Google Scholar]
- 31.Qin J, Li Y, Cai Z, Li S, Zhu J, Zhang F, Liang S, Zhang W, Guan Y, Shen D, Peng Y, Zhang D, Jie Z, Wu W, Qin Y, Xue W, Li J, Han L, Lu D, Wu P, Dai Y, Sun X, Li Z, Tang A, Zhong S, Li X, Chen W, Xu R, Wang M, Feng Q, Gong M, Yu J, Zhang Y, Zhang M, Hansen T, Sanchez G, Raes J, Falony G, Okuda S, Almeida M, LeChatelier E, Renault P, Pons N, Batto JM, Zhang Z, Chen H, Yang R, Zheng W, Yang H, Wang J, et al. 2012. A metagenome-wide association study of gut microbiota in type 2 diabetes. Nature 490:55–60. doi: 10.1038/nature11450. [DOI] [PubMed] [Google Scholar]
- 32.Karlsson FH, Tremaroli V, Nookaew I, Bergstrom G, Behre CJ, Fagerberg B, Nielsen J, Backhed F. 2013. Gut metagenome in European women with normal, impaired and diabetic glucose control. Nature 498:99–103. doi: 10.1038/nature12198. [DOI] [PubMed] [Google Scholar]
- 33.Barcenilla A, Pryde SE, Martin JC, Duncan SH, Stewart CS, Henderson C, Flint HJ. 2000. Phylogenetic relationships of butyrate-producing bacteria from the human gut. Appl Environ Microbiol 66:1654–1661. doi: 10.1128/AEM.66.4.1654-1661.2000. [DOI] [PMC free article] [PubMed] [Google Scholar]
- 34.Duncan SH, Hold GL, Harmsen HJ, Stewart CS, Flint HJ. 2002. Growth requirements and fermentation products of Fusobacterium prausnitzii, and a proposal to reclassify it as Faecalibacterium prausnitzii gen. nov., comb. nov. Int J Syst Evol Microbiol 52:2141–2146. doi: 10.1099/ijs.0.02241-0. [DOI] [PubMed] [Google Scholar]
- 35.Lopez-Siles M, Khan TM, Duncan SH, Harmsen HJ, Garcia-Gil LJ, Flint HJ. 2012. Cultured representatives of two major phylogroups of human colonic Faecalibacterium prausnitzii can utilize pectin, uronic acids, and host-derived substrates for growth. Appl Environ Microbiol 78:420–428. doi: 10.1128/AEM.06858-11. [DOI] [PMC free article] [PubMed] [Google Scholar]
- 36.Louis P, Flint HJ. 2009. Diversity, metabolism and microbial ecology of butyrate-producing bacteria from the human large intestine. FEMS Microbiol Lett 294:1–8. doi: 10.1111/j.1574-6968.2009.01514.x. [DOI] [PubMed] [Google Scholar]
- 37.Martin R, Chain F, Miquel S, Lu J, Gratadoux JJ, Sokol H, Verdu EF, Bercik P, Bermudez-Humaran LG, Langella P. 2014. The commensal bacterium Faecalibacterium prausnitzii is protective in DNBS-induced chronic moderate and severe colitis models. Inflamm Bowel Dis 20:417–430. doi: 10.1097/01.MIB.0000440815.76627.64. [DOI] [PubMed] [Google Scholar]
- 38.Carlsson AH, Yakymenko O, Olivier I, Hakansson F, Postma E, Keita AV, Soderholm JD. 2013. Faecalibacterium prausnitzii supernatant improves intestinal barrier function in mice DSS colitis. Scand J Gastroenterol 48:1136–1144. doi: 10.3109/00365521.2013.828773. [DOI] [PubMed] [Google Scholar]
- 39.Wrzosek L, Miquel S, Noordine ML, Bouet S, Chevalier-Curt MJ, Robert V, Philippe C, Bridonneau C, Cherbuy C, Robbe-Masselot C, Langella P, Thomas M. 2013. Bacteroides thetaiotaomicron and Faecalibacterium prausnitzii influence the production of mucus glycans and the development of goblet cells in the colonic epithelium of a gnotobiotic model rodent. BMC Biol 11:61. doi: 10.1186/1741-7007-11-61. [DOI] [PMC free article] [PubMed] [Google Scholar]
- 40.Li M, Wang B, Zhang M, Rantalainen M, Wang S, Zhou H, Zhang Y, Shen J, Pang X, Wei H, Chen Y, Lu H, Zuo J, Su M, Qiu Y, Jia W, Xiao C, Smith LM, Yang S, Holmes E, Tang H, Zhao G, Nicholson JK, Li L, Zhao L. 2008. Symbiotic gut microbes modulate human metabolic phenotypes. Proc Natl Acad Sci U S A 105:2117–2122. doi: 10.1073/pnas.0712038105. [DOI] [PMC free article] [PubMed] [Google Scholar]
- 41.Tap J, Mondot S, Levenez F, Pelletier E, Caron C, Furet JP, Ugarte E, Munoz-Tamayo R, Paslier DL, Nalin R, Dore J, Leclerc M. 2009. Towards the human intestinal microbiota phylogenetic core. Environ Microbiol 11:2574–2584. doi: 10.1111/j.1462-2920.2009.01982.x. [DOI] [PubMed] [Google Scholar]
- 42.Silverberg MS, Satsangi J, Ahmad T, Arnott ID, Bernstein CN, Brant SR, Caprilli R, Colombel JF, Gasche C, Geboes K, Jewell DP, Karban A, Loftus EV Jr, Pena AS, Riddell RH, Sachar DB, Schreiber S, Steinhart AH, Targan SR, Vermeire S, Warren BF. 2005. Toward an integrated clinical, molecular and serological classification of inflammatory bowel disease: report of a working party of the 2005 Montreal World Congress of Gastroenterology. Can J Gastroenterol 19(Suppl A):5–36. [DOI] [PubMed] [Google Scholar]
- 43.Zoetendal EG, von Wright A, Vilpponen-Salmela T, Ben-Amor K, Akkermans AD, de Vos WM. 2002. Mucosa-associated bacteria in the human gastrointestinal tract are uniformly distributed along the colon and differ from the community recovered from feces. Appl Environ Microbiol 68:3401–3407. doi: 10.1128/AEM.68.7.3401-3407.2002. [DOI] [PMC free article] [PubMed] [Google Scholar]
- 44.Thompson JD, Higgins DG, Gibson TJ. 1994. CLUSTAL W: improving the sensitivity of progressive multiple sequence alignment through sequence weighting, position-specific gap penalties and weight matrix choice. Nucleic Acids Res 22:4673–4680. doi: 10.1093/nar/22.22.4673. [DOI] [PMC free article] [PubMed] [Google Scholar]
- 45.Maidak BL, Cole JR, Lilburn TG, Parker CT Jr, Saxman PR, Farris RJ, Garrity GM, Olsen GJ, Schmidt TM, Tiedje JM. 2001. The RDP-II (Ribosomal Database Project). Nucleic Acids Res 29:173–174. doi: 10.1093/nar/29.1.173. [DOI] [PMC free article] [PubMed] [Google Scholar]
- 46.Altschul SF, Madden TL, Schaffer AA, Zhang J, Zhang Z, Miller W, Lipman DJ. 1997. Gapped BLAST and PSI-BLAST: a new generation of protein database search programs. Nucleic Acids Res 25:3389–3402. doi: 10.1093/nar/25.17.3389. [DOI] [PMC free article] [PubMed] [Google Scholar]
- 47.Bustin SA, Benes V, Garson JA, Hellemans J, Huggett J, Kubista M, Mueller R, Nolan T, Pfaffl MW, Shipley GL, Vandesompele J, Wittwer CT. 2009. The MIQE guidelines: minimum information for publication of quantitative real-time PCR experiments. Clin Chem 55:611–622. doi: 10.1373/clinchem.2008.112797. [DOI] [PubMed] [Google Scholar]
- 48.Muyzer G, de Waal EC, Uitterlinden AG. 1993. Profiling of complex microbial populations by denaturing gradient gel electrophoresis analysis of polymerase chain reaction-amplified genes coding for 16S rRNA. Appl Environ Microbiol 59:695–700. [DOI] [PMC free article] [PubMed] [Google Scholar]
- 49.Hall TA. 1999. BioEdit: a user-friendly biological sequence alignment editor and analysis program for Windows 95/98/NT. Nucleic Acids Symp Ser (Oxf) 41:95–98. [Google Scholar]
- 50.Wright ES, Yilmaz LS, Noguera DR. 2012. DECIPHER, a search-based approach to chimera identification for 16S rRNA sequences. Appl Environ Microbiol 78:717–725. doi: 10.1128/AEM.06516-11. [DOI] [PMC free article] [PubMed] [Google Scholar]
- 51.Saitou N, Nei M. 1987. The neighbor-joining method: a new method for reconstructing phylogenetic trees. Mol Biol Evol 4:406–425. [DOI] [PubMed] [Google Scholar]
- 52.Schloss PD, Westcott SL, Ryabin T, Hall JR, Hartmann M, Hollister EB, Lesniewski RA, Oakley BB, Parks DH, Robinson CJ, Sahl JW, Stres B, Thallinger GG, Van Horn DJ, Weber CF. 2009. Introducing mothur: open-source, platform-independent, community-supported software for describing and comparing microbial communities. Appl Environ Microbiol 75:7537–7541. doi: 10.1128/AEM.01541-09. [DOI] [PMC free article] [PubMed] [Google Scholar]
- 53.Best WR, Becktel JM, Singleton JW, Kern F Jr. 1976. Development of a Crohn's disease activity index. National Cooperative Crohn's Disease Study. Gastroenterology 70:439–444. [PubMed] [Google Scholar]
- 54.Heuer H SK. 1997. Application of denaturing gradient gel electrophoresis (DGGE) and temperature gradient gel electrophoresis (TGGE) for studying soil microbial communities. In van Elsas JD, Trevors JT, Wellington EMH (ed), Modern soil microbiology. Marcel Dekker Inc, New York, NY. [Google Scholar]
- 55.Vetrovsky T, Baldrian P. 2013. The variability of the 16S rRNA gene in bacterial genomes and its consequences for bacterial community analyses. PLoS One 8:e57923. doi: 10.1371/journal.pone.0057923. [DOI] [PMC free article] [PubMed] [Google Scholar]
- 56.Stoddard SF, Smith BJ, Hein R, Roller BRK, Schmidt TM. 2015. rrnDB: improved tools for interpreting rRNA gene abundance in bacteria and archaea and a new foundation for future development. Nucleic Acids Res 43(Database issue):D593–D598. doi: 10.1093/nar/gku1201. [DOI] [PMC free article] [PubMed] [Google Scholar]
- 57.Nugent SG, Kumar D, Rampton DS, Evans DF. 2001. Intestinal luminal pH in inflammatory bowel disease: possible determinants and implications for therapy with aminosalicylates and other drugs. Gut 48:571–577. doi: 10.1136/gut.48.4.571. [DOI] [PMC free article] [PubMed] [Google Scholar]
- 58.Pereira SP, Bain IM, Kumar D, Dowling RH. 2003. Bile composition in inflammatory bowel disease: ileal disease and colectomy, but not colitis, induce lithogenic bile. Aliment Pharmacol Ther 17:923–933. doi: 10.1046/j.1365-2036.2003.01529.x. [DOI] [PubMed] [Google Scholar]
- 59.Morgan XC, Tickle TL, Sokol H, Gevers D, Devaney KL, Ward DV, Reyes JA, Shah SA, LeLeiko N, Snapper SB, Bousvaros A, Korzenik J, Sands BE, Xavier RJ, Huttenhower C. 2012. Dysfunction of the intestinal microbiome in inflammatory bowel disease and treatment. Genome Biol 13:R79. doi: 10.1186/gb-2012-13-9-r79. [DOI] [PMC free article] [PubMed] [Google Scholar]
- 60.Seril DN, Liao J, Yang GY, Yang CS. 2003. Oxidative stress and ulcerative colitis-associated carcinogenesis: studies in humans and animal models. Carcinogenesis 24:353–362. doi: 10.1093/carcin/24.3.353. [DOI] [PubMed] [Google Scholar]
- 61.Khan MT, Duncan SH, Stams AJ, van Dijl JM, Flint HJ, Harmsen HJ. 2012. The gut anaerobe Faecalibacterium prausnitzii uses an extracellular electron shuttle to grow at oxic-anoxic interphases. ISME J 6:1578–1585. doi: 10.1038/ismej.2012.5. [DOI] [PMC free article] [PubMed] [Google Scholar]
Associated Data
This section collects any data citations, data availability statements, or supplementary materials included in this article.