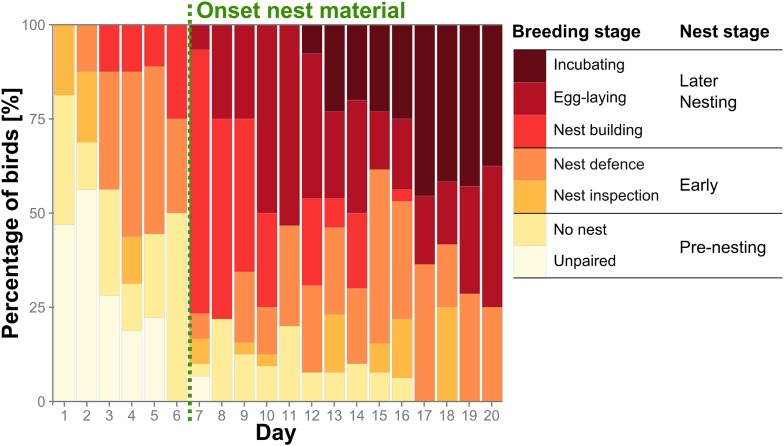
Figure 2. Group reproductive stages change over time.
Percentage of birds (nbirds = 32) assigned to the seven detailed breeding stages (coloured bars) and the three corresponding condensed nest stages over the first 20 days of the trials. Earliest onset of nest material provisioning (day 7) is indicated by a green dashed vertical line. Source data are available at http://dx.doi.org/10.5061/dryad.vt69s.


