Significance
We use a protein labeling technique based on an engineered ascorbate peroxidase (APEX) to map the proteome of the mitochondrial matrix in live tissues. The approach allows us to establish MitoMax, a comprehensive database providing a high-quality inventory of Drosophila mitochondrial proteins with subcompartmental annotation. We demonstrate that APEX labeling is effective in vivo and provides an opportunity to characterize subcellular proteomes in specific cell types and in different physiological conditions. Given the interest in defining the mitochondrial proteome in different physiological conditions and tissues, our analysis provides a resource for systematic functional analyses of mitochondria that will in particular facilitate investigation of mitochondrial diseases.
Keywords: proteomics, APEX, Drosophila
Abstract
Characterization of the proteome of organelles and subcellular domains is essential for understanding cellular organization and identifying protein complexes as well as networks of protein interactions. We established a proteomic mapping platform in live Drosophila tissues using an engineered ascorbate peroxidase (APEX). Upon activation, the APEX enzyme catalyzes the biotinylation of neighboring endogenous proteins that can then be isolated and identified by mass spectrometry. We demonstrate that APEX labeling functions effectively in multiple fly tissues for different subcellular compartments and maps the mitochondrial matrix proteome of Drosophila muscle to demonstrate the power of APEX for characterizing subcellular proteomes in live cells. Further, we generate “MitoMax,” a database that provides an inventory of Drosophila mitochondrial proteins with subcompartmental annotation. Altogether, APEX labeling in live Drosophila tissues provides an opportunity to characterize the organelle proteome of specific cell types in different physiological conditions.
Specialized biological processes are carried out in specific organelles and subcellular compartments. For example, mitochondria are the site of oxidative respiration, neurons pass electrical or chemical signals to others through synapses, and apical and basolateral domains of epithelial cells are critical for their polarized functions. Understanding how these structures underlie specialized functions requires the comprehensive identification of proteins within spatially defined cellular domains.
A common strategy to study the localization of a particular protein is to generate green fluorescent protein (GFP) fusion proteins. However, it is time-consuming and labor-intensive to investigate protein localization at a large scale using GFP tagging, especially in vivo. Therefore, highly sensitive mass spectrometry (MS) approaches have been developed to systematically characterize the proteome of subcellular compartments. However, using MS approaches to characterize the proteome of subcellular domains has been limited by purification methods and is commonly associated with numerous false positives and false negatives due to contamination and loss of components during purification, respectively. For example, mitochondria are composed of an outer membrane and an inner membrane, generating two subcompartmental regions: the intermembrane space and the matrix located within the inner membrane. Because the ultrastructure of mitochondria is often disrupted during isolation processes, the isolation of specific subcompartmental regions of mitochondria is prone to contamination.
Recently, a method based on an engineered ascorbate peroxidase (APEX) has been developed and shown to function in cultured mammalian cells for proteomic mapping (1). Upon activation, the APEX enzyme turns a biotin-phenol substrate into a highly reactive radical that covalently tags neighboring proteins on electron-rich amino acids such as tyrosine. Biotinylated endogenous proteins can then be isolated and identified by MS. Thus, APEX labeling can be applied to bypass organelle purification steps, offering an alternative approach for systematic proteomic characterization in live cells. Here we report that the approach can be applied to characterize the subcellular proteome in live tissues and map the mitochondrial matrix proteome of Drosophila muscle. In addition to characterizing a number of uncharacterized putative mitochondrial proteins, we establish MitoMax, a database that provides an inventory of Drosophila mitochondrial proteins with subcompartmental annotation.
Results
Expressing APEX in Different Subcellular Compartments of Drosophila Cells.
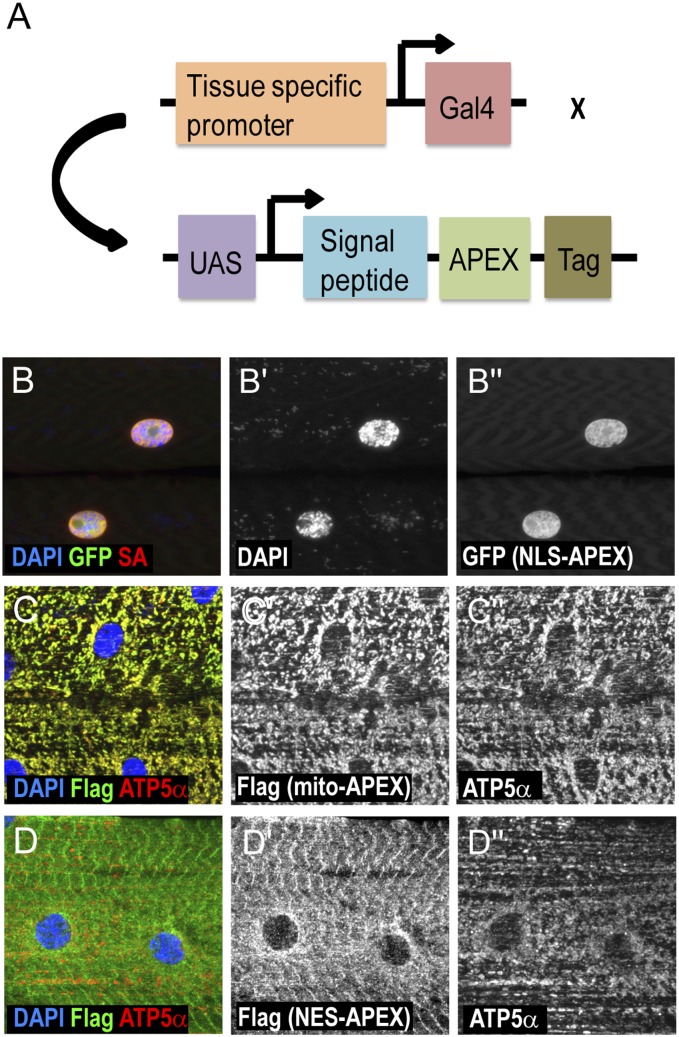
To express APEX in different Drosophila tissues at specific developmental stages, we used the UAS/Gal4 system (2) and generated flies with APEX fused to various signal peptides, including a nuclear localization signal (NLS) (3), a nuclear export signal (NES) (4), and the mitochondrial targeting sequence of human COXVIII (mito) (5) (Fig. 1A). In addition, to validate the expression levels and patterns of different APEX constructs, APEX was fused with either a Flag tag or GFP at the C terminus. These constructs were expressed and examined in the body-wall muscle cells of third-instar larvae using the Dmef2-Gal4 driver. As expected, NLS-APEX localizes to nuclei, as identified by DAPI staining (Fig. 1B and Fig. S1). In contrast, mito-APEX expression tightly overlaps with ATP5α, also known as ATP5A1 in human, a known mitochondrial marker (6) (Fig. 1C), whereas NES-APEX shows a nonnuclear expression pattern different from that of ATP5α (Fig. 1D).
Fig. 1.
Expressing APEX constructs in different subcellular compartments of fly muscle cells. (A) Strategy for targeting APEX to different cellular compartments. To express APEX in different Drosophila tissues at specific developmental stages, we used the UAS/Gal4 system and generated transgenic flies with APEX constructs under the regulation of UAS promoters. To target APEX to the nucleus, cytoplasm, or mitochondrial matrix, APEX is fused with a nuclear localization signal peptide, a nuclear export signal peptide, and a 29-aa peptide from human COXVIII, respectively. To detect the expression of APEX, GFP, or Flag, tags are added at the C termini of the constructs. (B–D) Expression and labeling activity of APEX targeted to different subcellular localizations in larval muscles. Immunostaining of muscle cells expressing NLS-APEX-GFP (B), mito-APEX-Flag (C), and NES-APEX-Flag (D) using Dmef2-Gal4. Nuclei are detected by DAPI (blue in B–D; gray in B′). APEX is detected by either GFP expression or Flag staining (green in B–D; gray in B′′, C′, and D′). Mitochondrion is marked by ATP5α staining (red in C and D; gray in C′′ and D′′). Biotinylated proteins are visualized by streptavidin (SA)-coupled fluorescent staining (red in B; gray in B′′).
Fig. S1.
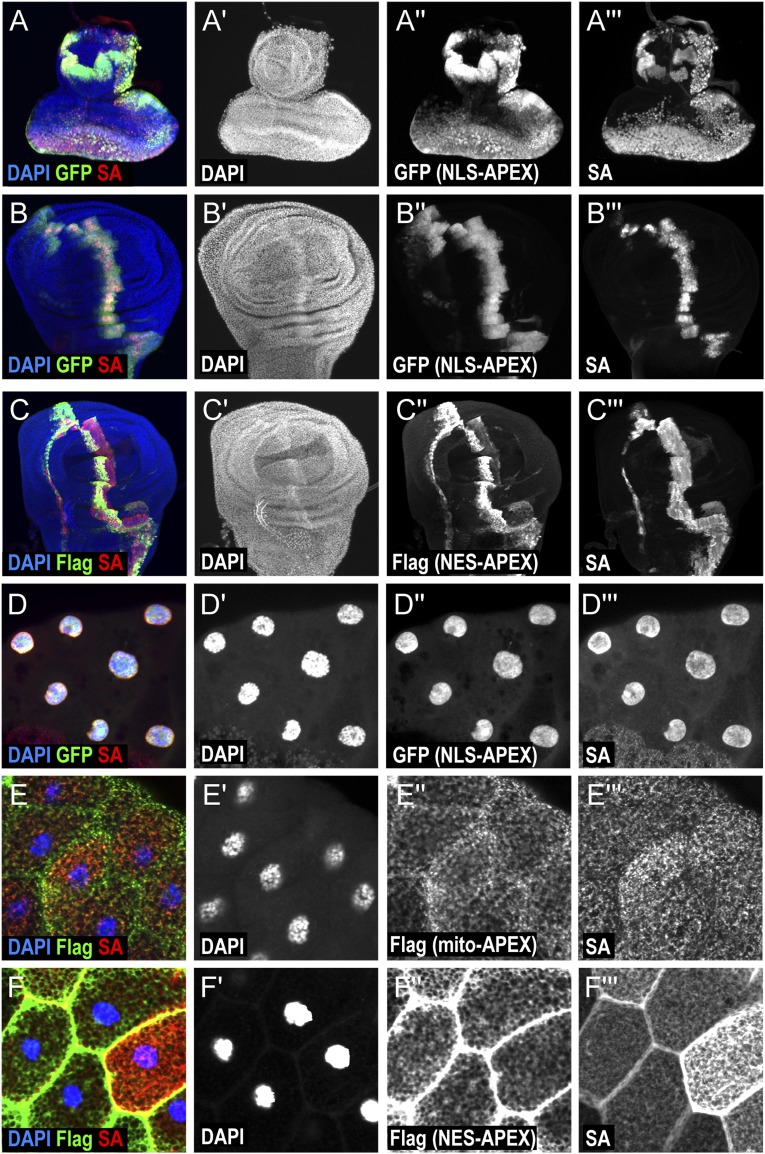
Characterization of APEX labeling in Drosophila tissues. Expression and labeling activities of APEX constructs targeted to different subcellular localizations. APEX is expressed in larval tissues using ptc-Gal4. (A) Immunostainings of eye imaginal disc overexpressing NLS-APEX-GFP. (B and C) Immunostainings of wing imaginal disc overexpressing NLS-APEX-GFP (B) and NES-APEX-Flag (C). (D–F) Immunostainings of salivary glands overexpressing NLS-APEX-GFP (D), mito-APEX-Flag (E), and NES-APEX-Flag (F). Nuclei are identified by DAPI staining (blue in A–F; gray in A′–F′). APEX is detected by GFP expression or Flag staining (green in A–F; gray in A′′–F′′). Biotinylated proteins are visualized by streptavidin (SA)-coupled fluorescent staining (red in A–F; gray in A′′′–F′′′).
APEX Labeling Functions Effectively in Various Fly Tissues.
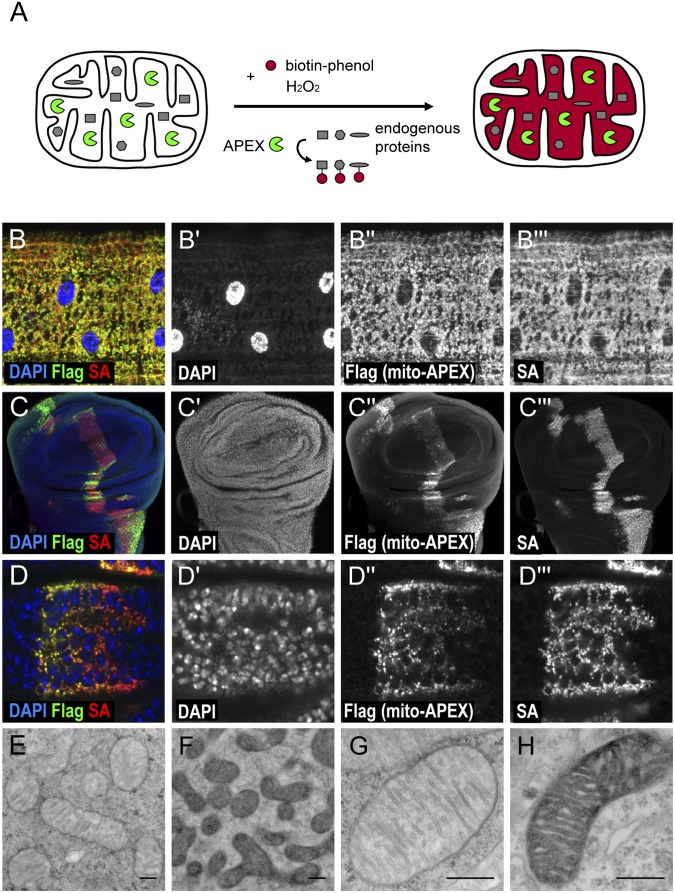
Next, we explored whether the APEX method could be applied to live tissues, as many biological processes cannot be studied in tissue-culture cells. Labeling of live tissues with APEX presents a number of challenges, because it requires that biotin-phenol and H2O2 are effectively delivered to cells; heme, the APEX cofactor, is present in a sufficient amount; catalase activity, which may quench H2O2, is low; and APEX transgenes are generated and expressed at the appropriate levels. Following a series of tests both in Drosophila S2R+ cells and dissected tissues, we found that for muscle studies, incubation with the biotin-phenol substrate for 30 min followed by 1-min incubation with H2O2 to activate APEX resulted in consistent biotinylation without additional heme supplementation (Fig. 2A).
Fig. 2.
APEX labeling is effective in the mitochondrial matrix of fly tissues. (A) Schematic of APEX labeling in mitochondria. With substrates and H2O2, APEX catalyzes the biotinylation of neighboring endogenous proteins. (B) Immunostaining of muscle cells expressing mito-APEX-Flag using Dmef2-Gal4. (C) Immunostaining of wing imaginal discs expressing mito-APEX-Flag along the anterior–posterior compartment by ptc-Gal4. (D) Image of C at higher magnification shows that streptavidin staining tightly overlaps with APEX expression. Nuclei are detected by DAPI (blue in B–D; gray in B′–D′). APEX is detected by Flag staining (green in B–D; gray in B′′–D′′). Biotinylated proteins are visualized by streptavidin-coupled fluorescent staining (red in B–D; gray in B′′′–D′′′). (E–H) EM images of control muscle cells (E and G) and muscle cells expressing APEX (F and H) in the mitochondrial matrix with diaminobenzidine treatment followed by OsO4 staining. (E and F) Lower-magnification images. (G and H) Higher-magnification images. (Scale bars, 100 nm.)
Following covalent biotinylation of nearby endogenous proteins by APEX, the dissected tissues were stained with streptavidin to reveal the presence of biotinylated proteins (Fig. 2 B–D and Figs. S1 and S2). Mito-APEX effectively labeled neighboring proteins, as shown by the overlap between the expression of the tag and the streptavidin staining in larval muscles (Fig. 2B and Fig. S1E). Further, we examined the activity of APEX in larval imaginal discs and found that APEX functions effectively in the subcellular regions in which it is expressed (Fig. 2 C and D and Fig. S1 A–C). When mito-APEX was expressed along the anterior–posterior compartmental boundary of the wing imaginal disc using ptc-gal4, the streptavidin staining overlapped with the mito-APEX expression and showed no background in the region where APEX was not expressed (Fig. 2 C and D). Similarly, NLS-APEX and NES-APEX were able to catalyze biotinylation of proteins in the proper cellular compartment (Fig. 1B and Fig. S1). In addition to muscle cells and imaginal discs, similar results were also observed in the salivary gland (Fig. S1 D–F). In summary, APEX functions effectively in multiple fly tissues (Figs. 1B and 2 B–D and Fig. S1).
Fig. S2.
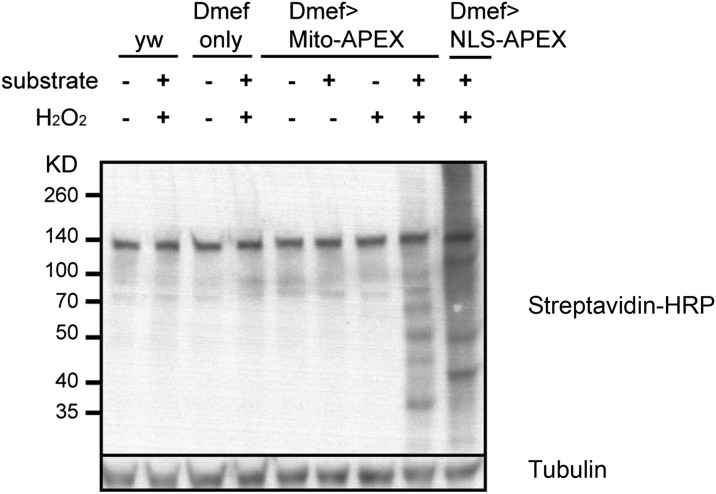
Western blotting analysis of biotinylation in fly tissues. Genotypes and chemical supplements are as indicated. The provided substrate is biotin-phenol. Endogenously biotinylated proteins are shown in the negative controls: wild-type (yw) cells or Dmef-gal4–only cells without incubating with substrate and H2O2. Providing both substrate and H2O2 to either mito-APEX– or NLS-APEX–expressing cells gives rise to specific and strong biotinylation.
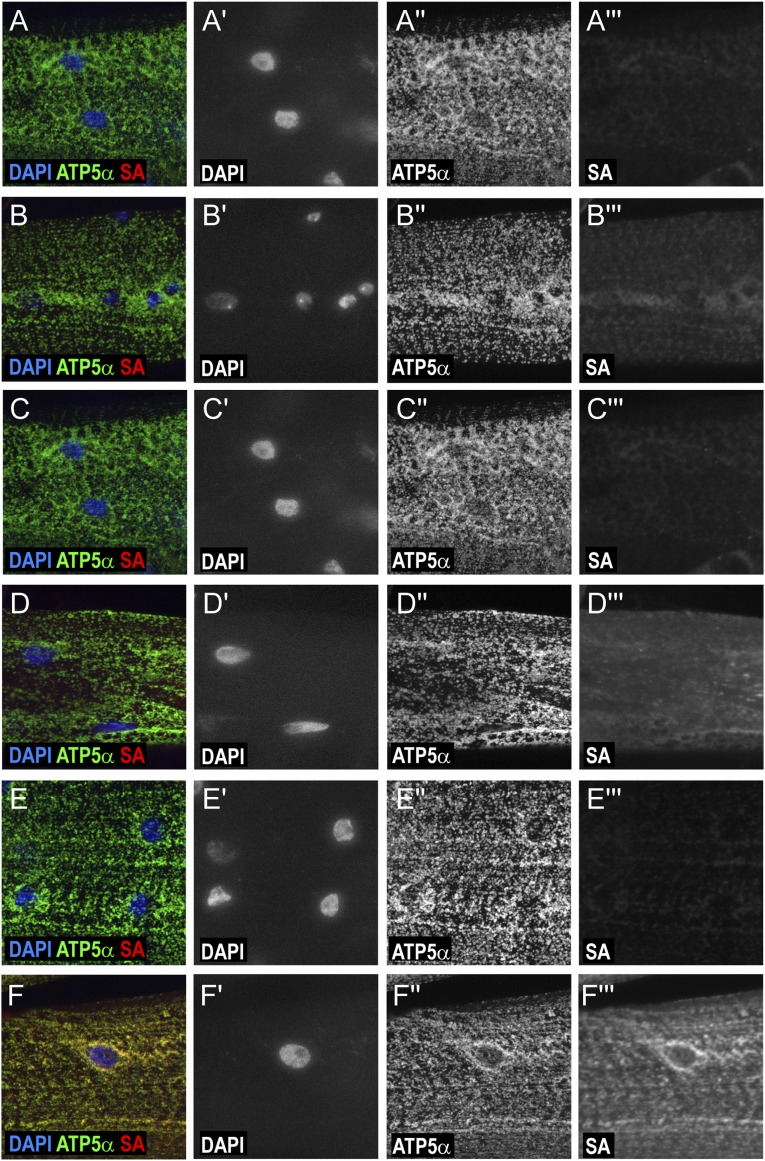
In addition to immunostainings (Fig. 2B and Fig. S3), we also analyzed the biotinylation status of fly muscles by Western blotting (Fig. S2). Few endogenously biotinylated proteins were present in negative control cells, whereas providing both substrate and H2O2 to cells without APEX expression was associated with low background. Incubating cells that express mito-APEX with substrate alone led to a weak background, and supplementing H2O2 alone to cells expressing mito-APEX had negligible effect on biotinylation. In contrast, providing both substrate and H2O2 to APEX-expressing cells generates specific and strong biotinylation.
Fig. S3.
Analysis of the background of biotinylation in fly larval muscles. (A and B) Immunostainings of control wild-type (yw) larval muscle cells. (C–F) Immunostainings of larval muscle cells overexpressing mito-APEX using Dmef-Gal4. After dissection, larval muscles were unlabeled (A and C) or treated with H2O2 only (D), biotin-phenol only (E), or both substrate and H2O2 (B and F). Wild-type cells have weak background labeling (B). Incubating cells with substrate alone (D) increased background, whereas supplementing H2O2 alone to cells had negligible effect on biotinylation (E). Providing both substrate and H2O2 to mito-APEX–expressing cells gives rise to specific and strong biotinylation (D). Nuclei are detected by DAPI staining (blue in A–F; gray in A′–F′). Mitochondrion is visualized by ATP5α staining (green in A–F; gray in A′′–F′′). Biotinylated proteins are visualized by SA-coupled fluorescent staining (red in A–F; gray in A′′′–F′′′).
Finally, we took advantage of the application of APEX for electron microscopy (EM) to examine the localization of mito-APEX at high resolution. It has been shown that APEX can catalyze diaminobenzidine (DAB) precipitation to generate contrast after OsO4 fixation (7). Indeed, mito-APEX generates contrast specifically in the mitochondrial matrix (compare darker regions in Fig. 2 F and H with controls in Fig. 2 E and G), allowing us to confirm by EM that mito-APEX localizes specifically to the mitochondrial matrix.
Mapping of the Mitochondrial Matrix Proteome by APEX Tagging.
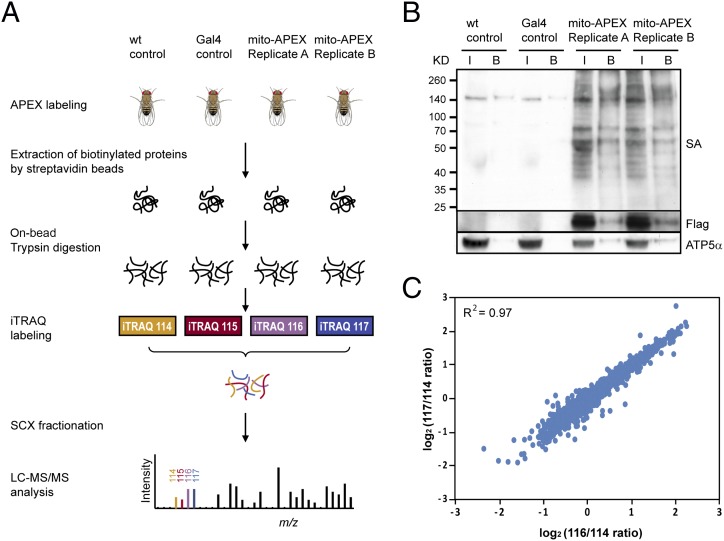
To demonstrate the use of APEX to label the proteome of organelles in vivo, we mapped the proteome of the mitochondrial matrix in Drosophila muscle cells by quantitative MS (Fig. 3A). To distinguish proteins specifically biotinylated by APEX from endogenous biotinylated proteins and to subtract background or false positives caused during the process, such as nonspecific binding to streptavidin or beads, we used iTRAQ (isobaric tags for relative and absolute quantification) followed by liquid chromatography–mass spectrometry (LC-MS/MS) (8–11). Because iTRAQ allows chemically labeled peptides with ion reporters of different mass from four different samples to be simultaneously analyzed by MS, third-instar larval muscle of two different controls (wild-type and Dmef2-Gal4 flies) and two replicates of mitochondrial APEX labeling (Dmef2>mito-APEX-Flag flies) were prepared. The dissected body-wall muscle samples from all four different groups were processed for APEX labeling, and the biotin-tagged proteome was affinity-purified using streptavidin-coupled beads. For quality control, biotinylation of endogenous proteins was confirmed by Western blotting using streptavidin-HRP (Fig. 3B). Furthermore, consistent with mitochondrial labeling, both the mitochondrial matrix protein ATP5α and mito-APEX-Flag were enriched by streptavidin beads (Fig. 3B). To retrieve enriched proteins, on-bead tryptic digestion was performed to generate proteolytic peptides. Collected peptides from wild-type and Dmef2-Gal4 flies and two replicates of flies with mitochondrial APEX labeling were labeled with reporter ion tags 114, 115, 116, and 117, respectively. From LC-MS/MS, we retrieved 18,600 unique peptides that resulted in 2,222 genes with unique peptides >1 and iTRAQ ratio >1 for further analysis (Fig. S4A). Notably, the expression levels of each protein show high correlations between the mito-APEX replicates and between the two controls (Fig. 3C and Fig. S4C).
Fig. 3.
Mapping of the mitochondrial proteome by APEX tagging. (A) Strategy for characterizing the mitochondrial matrix proteome. Mitochondrial targeted APEX is expressed in larval muscles using the Dmef2-Gal4 driver. Following APEX labeling, the biotin-tagged proteomes from all four groups of samples are affinity-purified using streptavidin-coupled beads. After on-bead tryptic digestion, peptides from controls (wild-type and Dmef2-Gal4 flies) and two replicates of muscles with mitochondrial APEX expressed are chemically labeled using iTRAQ and subjected to MS for further characterization. (B) Biotinylated mitochondrial matrix proteins, before and after enrichment, are detected by streptavidin (SA) blotting. APEX-Flag and ATP5α proteins are both pulled down by streptavidin beads (B, beads; I, input). (C) High correlation between two mito-APEX replicates. iTRAQ ratios of proteins from mito-APEX replicate A (116) versus wild-type control (114) are plotted against iTRAQ ratios of proteins from mito-APEX replicate B (117) versus wild-type control (114). R2 was calculated using Pearson correlation based on all detected proteins.
Fig. S4.
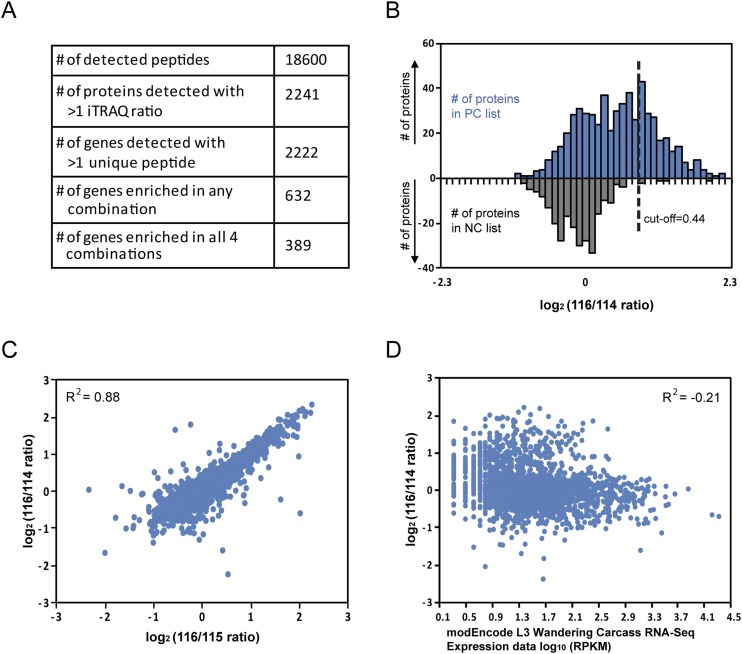
Analysis of data from quantitative mass spectrometry. (A) Summary of information obtained from quantitative mass spectrometry. (B) Distribution of genes on the positive and negative control lists over iTRAQ ratios log2(mito-APEX replicate A/wild-type control). (Top) Genes on the positive control (PC) list. (Bottom) Genes on the negative control (NC) list. (C) High correlation between two different controls: iTRAQ ratios of proteins from mito-APEX replicate A (116) versus wild-type control (114) are plotted against iTRAQ ratios of proteins from mito-APEX replicate A (116) versus Dmef-Gal control (114). R2 was calculated using Pearson correlation based on all detected proteins. (D) We retrieved transcript abundance data of L3 larval carcass from the RNA sequencing data generated by the modENCODE Consortium (32). The iTRAQ ratios were compared with log10 of RPKM (reads per kilobase per million mapped reads) values, and R2 was calculated using Pearson correlation.
Determination of the Mitochondrial Matrix Proteome.
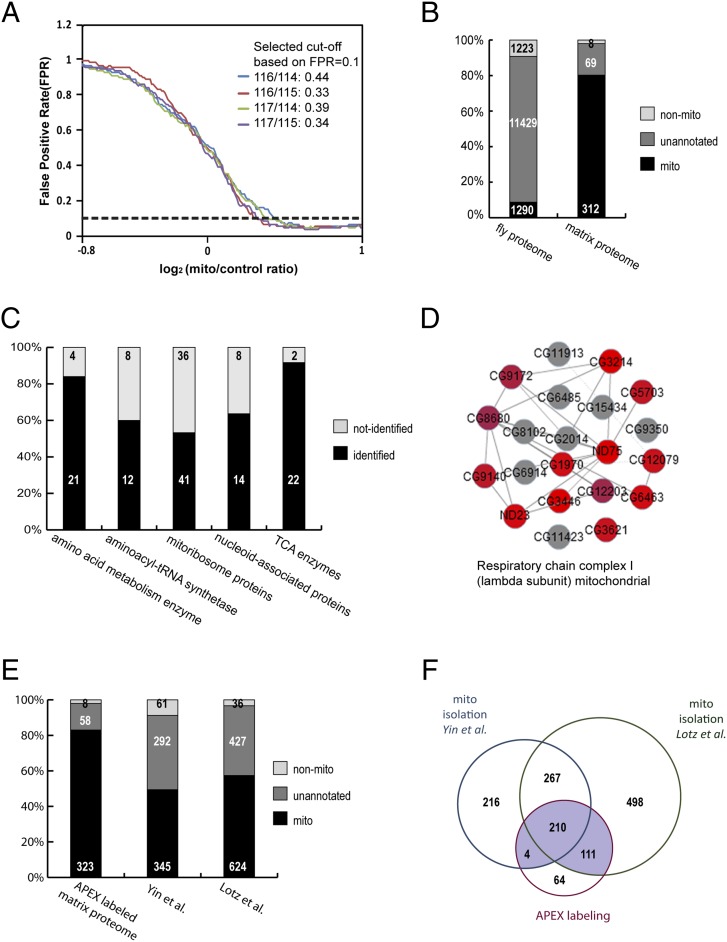
To define the mitochondrial matrix proteome, iTRAQ ratios between experimental and control samples were calculated for each protein, giving rise to four different datasets of iTRAQ ratios (116/114, 117/114, 116/115, and 117/115). To maximize the recovery of mitochondrial matrix proteins with high specificity, we set the threshold of the false positive rate (FPR) to <0.1 as in previous studies (1) (Fig. 4A and Fig. S4B), which means that a protein is 10 times more likely to be a true mitochondrial protein than a false positive. The FPR is calculated based on the assembled lists of positive and negative controls that are representing proteins that are predicted to be localized either to mitochondria or to other structures, respectively, based on data and annotation in human or fly. At this threshold, 389 genes passed the cutoff for all four datasets and were selected as our final “mitochondrial matrix proteome” (Fig. 4 A and B, Fig. S4A, and Dataset S1). The list contains both soluble matrix proteins and inner mitochondrial membrane proteins that are exposed to the matrix lumen.
Fig. 4.
Identification and analysis of the mitochondrial matrix proteome using APEX. (A) The threshold of the iTRAQ ratio is determined and based on a false positive rate of 0.1 (dashed line), which means that a protein is 10 times more likely to be a true mitochondrial protein than a false positive. (B) Analysis of specificity. Fraction of proteins in the entire fly proteome or in the matrix proteome. Discovery specificity; 80.2% of identified proteins have prior mitochondrial annotations, whereas 2.0% are false positives and 17.7% potentially represent previously unidentified mitochondrial proteins. (C) Analysis of discovery rate: Five groups of established mitochondrial proteins were analyzed, and 53–92% of proteins in each group were detected. (D) An example of COMPLEAT analysis. Each node represents one component of the complex, and node color reflects the average log2 ratio of each protein (red, positive log2 ratio; gray, proteins not detected; see more examples in Fig. S5). Solid lines represent binary protein–protein interactions identified in Drosophila, whereas dotted lines represent binary protein–protein interactions identified in other species. (E) Comparison of the specificity of identified fly mitochondrial proteins in different studies; 83% of the APEX-labeled matrix proteome corresponds to validated mitochondrial proteins (note that for this analysis, we included the 11 mitochondrial proteins validated in Fig. 5). In contrast, proteins identified from isolation-based approaches (16, 17) were 49% (345 out of 698) and 57% (624 out of 1,087), respectively. (F) Comparison of the results obtained from mitochondrial isolation methods and the APEX labeling method. Yin et al. (16) identified 718 proteins corresponding to 698 genes based on the FlyBase release 5.54 gene annotation. Lotz et al. (17) identified 1,089 genes; 210 genes are identified in all three studies, and 325 genes are identified both by the APEX labeling method and by at least one isolation-based experiment.
To analyze the specificity of our mitochondrial proteome, we cross-referenced our data with positive and negative control lists. Compared with the fly genome, our dataset is indeed enriched with mitochondrial genes; 80.2% of our identified proteins have prior mitochondrial annotation, whereas 2.1% are annotated with other locations and thus are potential false positives (Fig. 4B and Dataset S1). The other 17.7% (69 proteins) potentially represent previously unidentified mitochondrial proteins (Fig. 4B and Dataset S1).
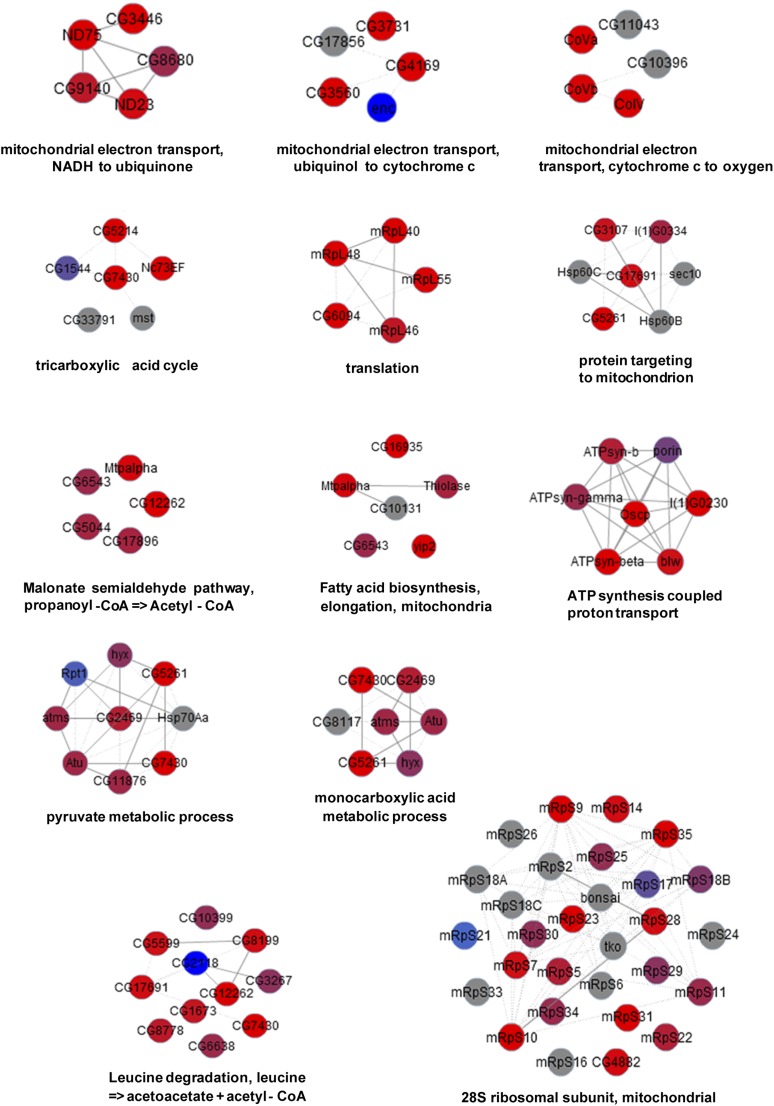
To analyze the depth of coverage, five established groups of functionally related mitochondrial proteins were analyzed (Fig. 4C and Dataset S2); 53–92% of proteins in each group were identified in our results. Because this analysis relies heavily on the human mitochondrial annotation due to the lack of annotation for subcompartmental localization of mitochondria in the fly genome, bias and noise may be introduced during orthologous mapping. Alternatively, the core subcomplexes of mitochondria, which are more likely to share the same sublocalization, were also examined using COMPLEAT (12), a bioinformatics tool for analyzing protein complex enrichment. For example, 13 out of 21 components (61.9%) of respiratory chain complex I were identified in our mitochondrial matrix proteome (Fig. 4D). In total, 65.7% of proteins in all enriched COMPLEAT complexes were discovered in our dataset (Fig. S5 and Dataset S3). Increasing the amount of input sample may slightly improve the coverage of proteins with low expression levels, although the recovery of mitochondrial proteins using iTRAQ ratios does not correlate with RNA expression levels (Fig. S4D).
Fig. S5.
COMPLEAT analysis of identified mitochondrial matrix proteins. Representative protein complexes enriched among the proteins identified by APEX. Each node represents one component of the complex, and node color reflects the average log2 ratio of each protein. Red, positive log2 ratio; blue, negative log2 ratio; gray, proteins not detected. Solid lines represent binary protein–protein interactions identified in Drosophila, whereas dotted lines represent binary protein–protein interactions identified in other species.
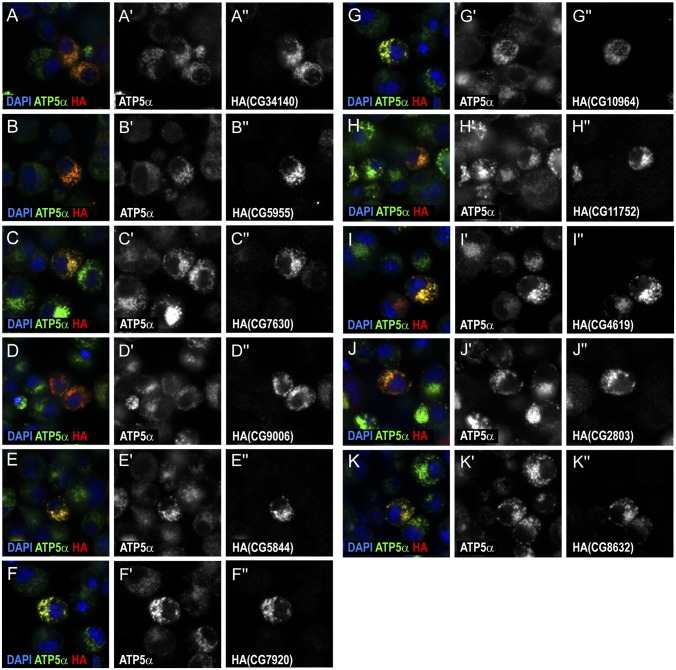
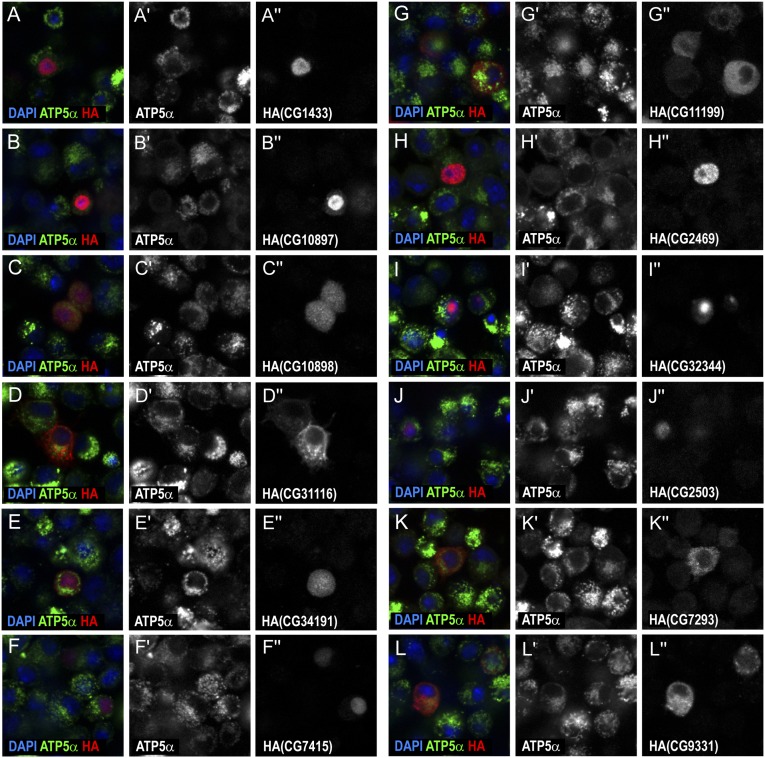
To confirm that the identified proteins represent mitochondrial proteins, we examined their localization in S2R+ cells. Twenty-three genes were overexpressed in S2R+ cells by transfection of available constructs with C-terminal HA tags (13) and the proteins encoded by these genes were examined (Fig. 5, Fig. S6, and Dataset S1). Eleven of them clearly showed specific mitochondrial localization. Notably, we were able to discover previously uncharacterized mitochondrial genes, such as CG34140, that have not been previously identified by isolation-based approaches, illustrating the power of the APEX labeling method. Although the other 12 genes showed various expression patterns, including ubiquitous expression, cytoplasmic localization, or nuclear localization, it is possible that they also localize to mitochondria, as many mitochondrial proteins do not exclusively reside in mitochondria (14). In addition, artificially tagging GFP to a protein may disrupt its structure and thus affect its endogenous localization (15). Alternatively, these 12 genes may represent false positives from the APEX approach. Supporting evidence for mitochondrial localization of each protein from results from other species and by prediction tools is summarized in Dataset S1. Altogether, when adding the previously unidentified 11 proteins to the positive list, our APEX results show 83% specificity with the positive list (Fig. 4E).
Fig. 5.
Validation of potential mitochondrial proteins in S2R+ cells. S2R+ cells were transfected with constructs carrying different proteins fused with HA at the C terminus. Not all cells are positive for the overexpressed constructs because of variability in transfection efficiency. Localization of proteins of interest was detected by HA staining (red in A–K; gray in A′′–K′′). Mitochondria are visualized by ATP5α staining (green in A–K; gray in A′–K′). Nuclei are detected by DAPI staining (blue in A–K).
Fig. S6.
Characterization of identified proteins in S2R+ cells. S2R+ cells were transfected with constructs carrying different proteins, as indicated, that are fused with HA at the C terminus. Localization of proteins of interest was detected by HA staining (red in A–L; gray in A′′–L′′). Mitochondrion is visualized by ATP5α staining (green in A–L; gray in A′–L′). Nuclei are detected by DAPI staining (blue in A–L).
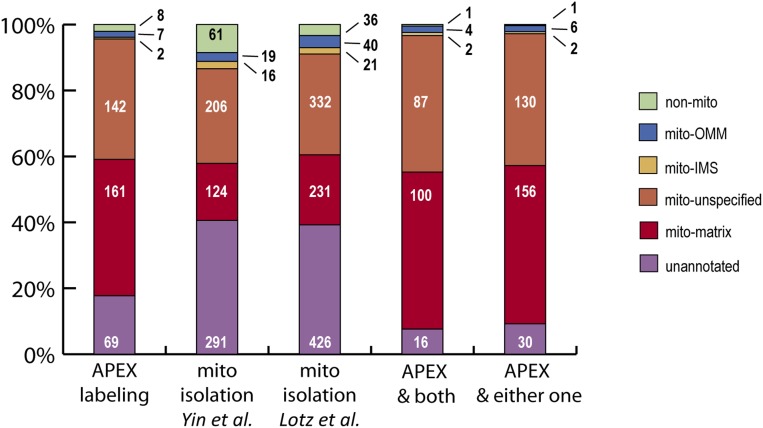
We compared our results with the Drosophila mitochondrial proteome obtained in two previous studies (16, 17) that identified proteins from whole mitochondria, including matrix, both mitochondrial membranes, and intermembrane space, following traditional mitochondrial isolation (Fig. 4 E and F and Fig. S7). Yin et al. (16) identified 718 proteins corresponding to 698 genes based on the FlyBase release 5.54 gene annotation; 49% of these were represented in our positive control list, and 9% were in our negative control list. In addition, Lotz et al. (17) identified 1,089 proteins, of which 57% were in our positive control list. On the other hand, 210 genes were identified in all three fly studies, and 325 genes were identified both by the APEX labeling method and by at least one of the isolation-based experiments (Fig. 4F). These genes are very likely to encode proteins specifically localized to the matrix or partially exposed to the matrix. In contrast, proteins that are only obtained by the isolation-based approach may represent proteins localized in mitochondrial subcompartments other than the matrix, such as the intermembrane space (Fig. S7). Altogether, our analyses indicate that the APEX-based method is able to facilitate proteomic mapping of finer subcellular compartments (matrix vs. whole mitochondria) and provide high coverage and excellent specificity (83% compared with 49–57% for the isolation-based approach).
Fig. S7.
Analysis of Drosophila mitochondrial proteins identified from different studies. Fractions of fly mitochondrial proteomes from different studies with subcompartmental annotation from human. Annotation of protein localization is as indicated. A higher percentage of genes identified by the APEX labeling method than by isolation methods [Yin et al. (16); Lotz et al. (17)] have mitochondrial matrix annotation (41.4% compared with 17.8% and 21.3% from isolation approaches). Genes identified by both APEX labeling and isolation-based approaches encode many proteins annotated as mitochondrial matrix proteins (48%). IMS, intermembrane space; OMM, outer membrane.
The MitoMax Database for Drosophila Mitochondrial Genes with Mitochondrial Matrix Annotation.
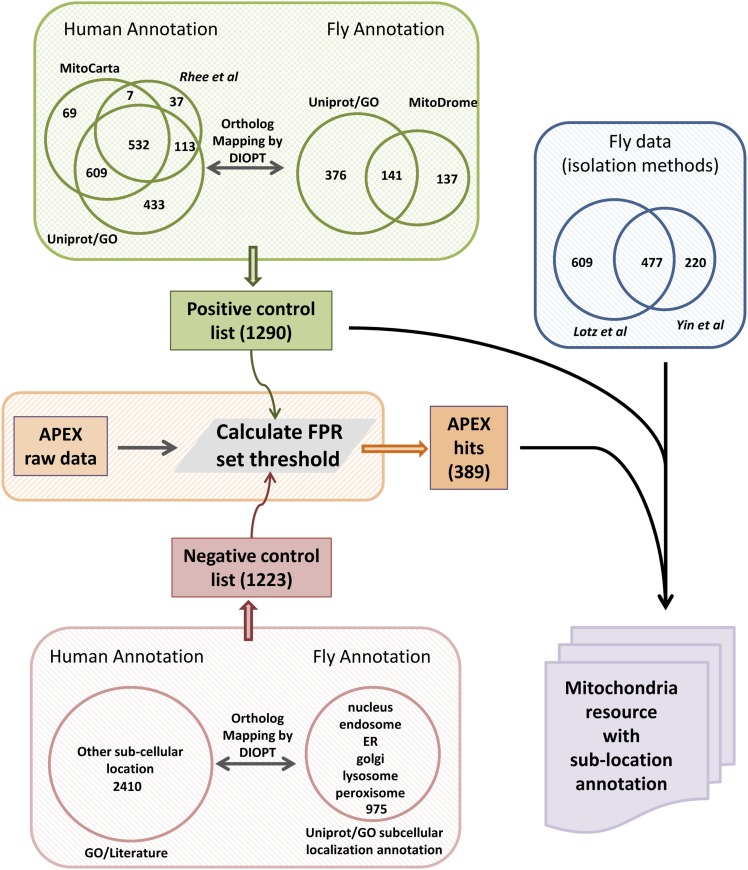
To build a comprehensive database, MitoMax, for Drosophila mitochondrial proteins with subcompartmental annotation, Drosophila genes identified by either isolation-based studies (16, 17) or by our APEX labeling approach were combined and integrated with genes from human annotation (1,290 genes) as well as Drosophila genes annotated at MitoMiner (18) and MitoDrome (19) (Fig. S8; genepath.med.harvard.edu/∼perrimon/MitoMax.html). There are 2,106 genes, corresponding to 2,126 proteins because in some cases multiple proteins map to a single gene, in total annotated at MitoMax with different ranking (confidence score). Genes identified from multiple experiments or genes identified by one experiment and supported by annotation or TargetP prediction (20) were assigned a higher score and considered high confidence mitochondrial genes, which can be used as a gold standard reference set for Drosophila mitochondrial genes. In contrast, genes from annotation only or genes identified only once in the mentioned studies without any other evidence are assigned a lower score and considered low confidence. Moreover, we annotated the genes encoding proteins localized or exposed to the mitochondrial matrix based on Gene Ontology and datasets obtained from APEX-based proteomic mapping in fly tissues and mammalian cell lines. Human orthologous genes mapped by DIOPT (21) and supporting evidence for mitochondrial localization of each protein are also available at MitoMax. In summary, 980 Drosophila genes are annotated with high confidence, and supporting evidence for mitochondrial localization of all 2,126 proteins is reported at MitoMax.
Fig. S8.
Assembly of the MitoMax database. Data integration strategy used to generate MitoMax. The positive control list (1,290 genes) and negative control list (1,223 genes) were assembled from both human and Drosophila data to determine the cutoff of iTRAQ ratio for the APEX-labeled fly mitochondrial proteome. Genes, identified by either APEX labeling (389 genes) or isolation-based studies, are combined and integrated with genes from annotation (see assembly of positive control list) as well as Drosophila genes annotated at MitoMiner and MitoDrome to build MitoMax, a comprehensive database for Drosophila mitochondrial genes with subcompartmental annotation. We annotated the genes encoding proteins localized or exposed to the mitochondrial matrix based on Gene Ontology and APEX data from Drosophila and mammalian cell lines; 980 Drosophila genes are annotated with high confidence, and supporting evidence for mitochondrial localization of 2,126 proteins is reported at MitoMax.
Discussion
We have established a proteomic mapping platform in Drosophila tissues using APEX and show that APEX functions effectively in multiple fly tissues. In addition, we demonstrate that this approach can be used effectively in vivo to analyze the Drosophila mitochondrial matrix proteome to facilitate proteomic mapping of finer subcellular compartments (matrix vs. whole mitochondria). The APEX-based method provides an opportunity to achieve excellent specificity (83% compared with 49–57% for the isolation-based approach). The excellent specificity is greatly contributed by iTRAQ, which provides a method to subtract background or false positive cause during the APEX labeling process, even though the mechanism of iTRAQ leads to compression of ratios with relatively small numbers (11). Unfortunately, because the biotinylation catalyzed by APEX requires the exposure of electron-rich residues such as tyrosine on the surfaces of target proteins (1), proteins that lack tyrosine residues or that are obscured by membranes or macromolecular complexes may not be detected with APEX. Nevertheless, we have identified not only unannotated mitochondrial genes but also nonconserved genes that are unlikely to be identified by orthologous mapping. These fly-specific mitochondrial genes may provide insights into mitochondrial–nuclear coevolution (22). Altogether, our analysis of APEX labeling in live Drosophila tissues indicates that the application of APEX not only provides a means to avoid potential problems during purification of organelles but also provides an opportunity to characterize the proteome of specific cell types under different physiological conditions.
Note that in our experiments, we are unable to determine the labeling radius, because the mitochondrion is a membrane-bound organelle and we are using a signal peptide to target APEX to the mitochondrial matrix rather than fusing APEX to a specific mitochondrial protein. However, in previous studies, the reactive phenoxyl radicals have been considered to have a half-live shorter than 1 ms and a <20-nm labeling radius (23–26), and thus APEX should prove useful to label subcellular domains beyond organelles in vivo.
Furthermore, we have generated a high-quality inventory of Drosophila proteins with submitochondrial compartmental annotation by integrating our results with those of previous studies. The MitoMax database for Drosophila genes encoding mitochondrial localized proteins is publicly available (genepath.med.harvard.edu/∼perrimon/MitoMax.html). It provides a resource for systematic functional analysis of mitochondria, and in particular will facilitate investigation of mitochondrial diseases.
Methods
Generation of APEX Drosophila Lines.
Plasmids encoding APEX were obtained from Martell et al. (7). APEX is wild-type APX with three engineered mutations (K41D, W41F, E112K). Signal peptides used in this study are nuclear localization signal (3): PKKKRKV; nuclear export signal (4): LALKLAGLDI; and mitochondrial signal peptide (5): N-terminal 29 aa of human COXVIII. The UAS/Gal4 system (2) was used for overexpression studies using Dmef2-Gal4 (27) and ptc-Gal4 (28, 29) drivers. For APEX labeling, fly tissues were dissected and incubated with biotin-phenol. APEX was activated for protein labeling with H2O2. Samples were fixed for immunostaining or lysed for Western blotting and further proteomic analysis.
Proteomic Analyses.
Enrichment of biotinylated proteins from cell lysates was performed using streptavidin beads. On-bead digestion was subsequently performed to retrieve peptides of biotinylated proteins. The resulting digested peptides were processed for 4-plex iTRAQ labeling. Labeled peptides were separated by StageTip strong cation exchange (SCX) using a protocol adapted from Rappsilber et al. (30). Only proteins identified by >1 unique peptide with quantified ratios were retained for further analysis. All of the genes identified by iTRAQ along with their annotation are listed in Dataset S1. For details on how the cutoff of the iTRAQ ratio was selected, see SI Methods.
Bioinformatics Analyses.
COMPLEAT (12) was used to identify complexes enriched among the genes identified by APEX. To build MitoMax, a comprehensive database for Drosophila mitochondrial genes with subcompartmental annotation, genes identified from isolation-based studies and/or APEX labeling were combined and integrated with genes from annotation as well as Drosophila genes annotated at MitoMiner (18) and MitoDrome (19).
SI Methods
Generation of APEX Drosophila Lines.
Plasmids encoding APEX were obtained from Martell et al. (7). APEX is wild-type APX with three engineered mutations (K41D, W41F, E112K). The sequence encoding APEX, in-frame with the sequence encoding a signal peptide at the N terminus (Fig. 1), was cloned into the Gateway vector pENTR (Invitrogen) and subcloned into pTWE or pTWF vectors. Signal peptides used in this study are NLS (nuclear localization signal) (3): PKKKRKV; NES (nuclear export signal) (4): LALKLAGLDI; and mito (mitochondrial signal peptide) (5): N-terminal 29 aa of human COXVIII. Plasmids were injected into embryos to generate transgenic lines that carry the UAS-APEX construct. The UAS/Gal4 system (2) was used for overexpression studies using Dmef2-Gal4 (27) and ptc-Gal4 (28, 29) drivers. All crosses were maintained at 25 °C.
Immunostaining and Confocal Fluorescence Imaging.
S2R+ cells or dissected fly tissues were fixed with 4% (wt/vol) paraformaldehyde in PBS (phosphate-buffered saline) buffer for 30–60 min on ice. After washing with PBT (0.3% TritonX-100 in PBS buffer) and blocking with PBTN [2% normal donkey serum in PBT], samples were incubated in primary antibody overnight at 4 °C. Samples were washed extensively and incubated with Alexa-conjugated streptavidin (Invitrogen; 1:500) or with Alexa-conjugated secondary antibodies (Molecular Probes; 1:500). Nuclei were visualized by DAPI staining (1 μg/mL). To visualize biotinylated proteins, 5% (wt/vol) dialyzed BSA in PBS was used for blocking and diluting Alexa-conjugated streptavidin. The following primary antibodies were used: mouse anti-ATP5α (MitoSciences; 1:500), mouse anti-Flag (Sigma; 1:250), rabbit anti-Myc (Cell Signaling; 1:500), and mouse anti-HA (Roche; 1:500). Images were captured with a Zeiss LSM 780 laser scanning confocal microscope.
Western Blotting.
Fly tissues were lysed in RIPA buffer (50 mM Tris⋅Cl, pH 7.4, 150 mM NaCl, 0.5% Triton X-100, 0.1% SDS). Protein concentration was measured by Pierce 660-nm protein assay (Thermo Scientific). After homogenization, debris was removed by centrifuging once at 20,000 × g for 10 min. Western blotting was performed using standard protocols. The following primary antibodies were: mouse anti-ATP5α (MitoSciences; 1:1,000); rabbit anti-Flag (Sigma; 1:5,000); and mouse anti-GFP (Molecular Probes; 1:5,000). Membranes labeled with primary antibodies were incubated with anti-rabbit HRP-conjugated antibody (Amersham; 1:5,000) or anti-mouse (Amersham; 1:5,000). For imaging biotinylation, blocking was performed with 5% (wt/vol) BSA in TBST (50 mM Tris, 150 mM NaCl, 0.1% Tween 20) at 4 °C overnight, and streptavidin-conjugated HRP (Invitrogen; 1:50,000) was diluted in blocking buffer.
DAB Staining and EM.
Larval muscle cells were dissected and fixed with 2% (wt/vol) glutaraldehyde (Electron Microscopy Sciences) in buffer (100 mM sodium cacodylate, 2 mM CaCl2, pH 7.4) on ice for 60 min. After fixation, samples were rinsed for 2 min five times in chilled buffer and then treated for 5 min in buffer containing 20 mM glycine to quench unreacted glutaraldehyde, followed by five 2-min rinses in chilled buffer. SIGMAFAST DAB (3,3′-diaminobenzidine tetrahydrochloride) with metal enhancer tablets (Sigma-Aldrich) was dissolved in 5 mL buffer and added to the samples for 10–30 min. The reaction was stopped by removing the DAB solution and washing the samples for 2 min five times with chilled buffer. Tissues were postfixed with 1% osmium tetroxide/1.5% (wt/vol) potassium ferrocyanide (KFeCN6) in chilled buffer for 30 min. Cells were washed three times in water, incubated in 1% aqueous uranyl acetate for 30 min followed by two washes in water, and subsequently dehydrated in grades of alcohol [50%, 70%, 95%, and twice 100% (vol/vol)] for 5 min each, incubated in 100% propylene oxide for 30 min, and infiltrated overnight in a 1:1 mixture of propyleneoxide and TAAB Epon (Marivac). The samples were subsequently embedded in TAAB Epon and polymerized at 60 °C for 48 h. Embedded samples were cut into 60-nm sections using a Reichert Ultracut S microtome. Sections were stained with lead citrate and images were taken using a JEOL 1200-EX transmission electron microscope operating at 80 kV with an AMT 2k CCD camera.
APEX Labeling of Fly Tissues.
Fly tissues were dissected in PBS and incubated with 500 μM biotin-phenol in PBS for 30 min at room temperature. After incubation, the substrate-containing solution was removed. To activate APEX enzyme for protein labeling, 1 mM H2O2 in PBS was added to the samples for 1 min. To stop the labeling reaction, the samples were washed three times with PBS with radical quenchers and peroxidase inhibitor (1 mM sodium ascorbate, 2 mM Trolox, 5 mM sodium azide). Samples were fixed for immunostaining as previously described or lysed for Western blots and further proteomic analysis.
Enrichment of Biotinylated Proteins with Streptavidin Beads.
Each cell lysate (250 μg) of fly muscles (at 500 ng/μL protein concentration) was mixed with 500 µL of streptavidin-coated magnetic bead slurry (Pierce) that was prewashed twice with RIPA buffer. The mixtures were incubated at room temperature for 1 h with rotation. After incubation, the beads were washed twice with 1 mL RIPA buffer, once with 1 mL of 2 M urea in 10 mM Tris⋅HCl (pH 8.0), and twice with 1 mL RIPA buffer. On-bead digestion was subsequently performed by incubating the beads in trypsin solution (80 µL 1 mM DTT, 5 μg/mL trypsin in 2 M urea in 50 mM Tris, pH 8) overnight to retrieve peptides of biotinylated proteins from the beads for the following analysis. The supernatant was removed and reduced (4 mM DTT), alkylated (10 mM iodoacetamide) for 30 min each, and digested with 0.5 µg of trypsin overnight (37 °C).
iTRAQ Labeling of Peptides.
The resulting digested peptides were desalted and reconstituted in 30 μL iTRAQ reconstitution buffer. Four-plex iTRAQ labeling was conducted per the manufacturer’s instructions (SCIEX). Briefly, iTRAQ labels were reconstituted with ethanol to a final volume of 145 µL, followed by individual labeling at room temperature for 1 h by adding 140 μL iTRAQ reagent to the samples. Labels were used as follows: 114 for wild-type control, 115 for Gal4 control, 116 for mito-APEX replicate A, and 117 for mito-APEX replicate B. Label incorporation was evaluated on an Orbitrap before quenching with 100 mM (final) Tris for 10 min at room temperature.
Fractionation and Mass Spectrometry.
Labeled peptides were separated by StageTip SCX fractionation into three fractions using a protocol adapted from Rappsilber et al. (30). Briefly, StageTips were prepared containing two C18 material discs (3M) above three SCX discs and were conditioned with MeOH, washed with 80% acetonitrile, 0.5% acetic acid followed by 500 mM NH4AcO, 0.1% NH4OH, 20% acetonitrile and equilibrated with 0.5% acetic acid. Peptides were loaded, washed in 0.5% acetic acid, transeluted to the SCX discs with 80% acetonitrile, 0.5% acetic acid, and stepwise eluted for collection using three elution buffers (50 mM NH4AcO, 20% acetonitrile, pH 5.5, 8.5, and 11, respectively). All StageTip steps were done in 100-µL volumes at 3,000 × g for 2 min. Following fractionation, samples were desalted and reconstituted in 3% acetonitrile, 0.1% formaldehyde. Fractionated peptides were analyzed by a data-dependent method where the top 12 most abundant precursors were selected for MS/MS prior to being placed on an exclusion list, a Thermo Scientific Q Exactive coupled to a Proxeon UHPLC using the same MS parameters as Rhee et al. (1). Briefly, peptides were separated over a 180-min gradient using a heated PicoFrit (New Objective) column (50C) packed with 20 cm of 1.9-µm C18 material (Dr. Maisch). Data were searched with Spectrum Mill (Agilent) using the UniProt Drosophila database. A fixed modification of carbamidomethylation of cysteine and variable modifications of N-terminal protein acetylation, oxidation of methionine, and 4-plex iTRAQ labels were searched. The enzyme specificity was set to trypsin, allowing cleavages N-terminal to proline, and a maximum of two missed cleavages was used for searching. The maximum precursor-ion charge state was set to 6. The precursor mass tolerance and MS/MS tolerance were set to 20 ppm. The peptide and protein false discovery rates were set to 0.01, and the minimum peptide length was set to 6. The raw mass spectrometry data and the sequence database used for searches may be downloaded from MassIVE (massive.ucsd.edu/) using the identifier MSV000079107. Download this dataset directly from ftp://MSV000079107:a@massive.ucsd.edu.
Determination of the Cutoff Point for Matrix Proteome Analysis and Assembly of Positive and Negative Control Lists.
Protein-level information was obtained from Spectrum Mill. Only proteins identified by >1 unique peptide with quantified ratios were retained for further analysis. Identified peptides with UniProt accession numbers were mapped to FlyBase gene identifiers using an ID mapping tool at UniProt that correspond to 2,222 unique annotated Drosophila genes (FlyBase release 5.54). Protein iTRAQ ratios were normalized to the median value of each channel. The log2 ratio of two replicates of mito-APEX samples to two control samples were calculated and normalized to the median value of each channel, respectively. All of the genes identified by iTRAQ along with their annotation are listed in Dataset S1.
To determine the cutoff of the iTRAQ ratio for the dataset, proteins were cross-referenced to positive and negative control lists. The positive control list was assembled from both human and Drosophila data. The list of human mitochondrial genes was assembled from three resources: (i) genes based on the corresponding subcellular location annotation from UniProt and/or cellular compartmental annotation from Gene Ontology annotation; (ii) genes from a specialized database, MitoCarta (31); and (iii) genes published by Rhee et al. (1). Genes identified by at least two resources were selected and then mapped to orthologous genes in Drosophila using DIOPT (21) with the least-stringent filter. The list of Drosophila mitochondrial genes was assembled from two resources: (i) genes based on the corresponding subcellular location annotation from UniProt and/or cellular compartmental annotation from Gene Ontology annotation; and (ii) genes from MitoDrome (19). Next, mitochondrial lists from both human and fly data were integrated and compared. There are 1,290 genes on the final positive control list, of which 552 genes are present in both species and 100 genes are present in Drosophila only, whereas 638 genes were mapped from human data/annotation. Similarly, the negative control list is assembled from a false positive list of 2,410 nonmitochondrial proteins compiled by Vamsi Mootha’s laboratory (31) and Drosophila proteins annotated with nucleus, endosome, endoplasmic reticulum (ER), Golgi, lysosome, or peroxisome subcellular annotations. There are 1,223 genes on the final negative control list, of which 423 genes have annotations in both species, 517 genes have annotations from Drosophila only, and 283 genes were mapped from human annotation.
The false positive rate (FPR) is calculated as a function of iTRAQ ratio using the equation (1)
The denominator is the conditional probability of finding a known mitochondrial protein in this range, which is calculated as the percentage of proteins on the positive control list in this range over all proteins identified on the positive control list. The numerator is the conditional probability of finding a false positive protein in a particular iTRAQ ratio range. The result calculated using this equation represents the percentage of false positive proteins in this iTRAQ ratio range over the total false positive proteins identified. We plotted FPR over iTRAQ ratio range (Fig. S4) and selected the iTRAQ ratio cutoff based on an FPR of 0.1, which means that a protein is 10 times more likely to be a true mitochondrial protein than a false positive. We set the cutoff points for the four datasets of iTRAQ ratios (116/114, 116/115, 117/114, and 117/115). The genes that were above the cutoff in all of the four datasets were selected as our final matrix proteome (Dataset S1).
COMPLEAT Analysis.
The bioinformatics tool COMPLEAT (12) (www.flyrnai.org/compleat/) was used to identify complexes enriched among the genes identified by APEX. The analysis was done using the average log2 ratio of each gene with complex size ranging from 5 to 100 and identified 69 complexes with P value <0.01 as well as complex IQM (interquartile mean) score >0.585 (Dataset S3). Representative complexes were manually selected for display (Fig. S4).
Cell Culture and Transfection.
S2R+ cells were transfected with overexpression constructs generated by Guruharsha et al. (13) using Effectene (Invitrogen). After 24 h, cells were incubated with 500 μM CuSO4 for 48 h to induce expression. Cells were fixed and immunostainings were performed as previously described.
Assembly of the MitoMax Database.
To build MitoMax, a comprehensive database for Drosophila mitochondrial genes with subcompartmental annotation, genes identified from isolation-based studies and/or APEX labeling were combined and integrated with genes from annotation (see assembly of positive control list) as well as Drosophila genes annotated at MitoMiner (18) and MitoDrome (19). We annotated the genes encoding proteins localized or exposed to the mitochondrial matrix based on APEX data and Gene Ontology. Score 4 is assigned to genes identified by multiple experiments. Score 3 is assigned to genes identified by one experiment but which are also annotated by TargetP prediction. Genes with score 4 or 3 are considered to be high confidence mitochondrial genes, which can be used as a gold standard reference set for fly mitochondrial genes. In addition, score 2 is assigned to genes from annotation only, whereas score 1 is assigned to genes identified by one experiment without any other evidence.
Supplementary Material
Acknowledgments
We thank the Bloomington Stock Center for stocks, Spyros Artavanis-Tsakonas for reagents, Christians Villalta for technical assistance, Maria Ericsson for assistance with electron microscopy, Hyun-Woo Rhee and Peng Zou from the A.Y.T. laboratory for reagents and advice, and members of the N.P. laboratory for discussions. C.-L.C. is an Postdoctoral Fellow of Ellison Medical Foundation/AFAR (American Federation for Aging Research). N.P. is an Investigator of the Howard Hughes Medical Institute (HHMI). This work was supported in part by National Institutes of Health Grants P01-CA120964 and R01-DK088718 (to N.P.) and HHMI's Collaborative Innovative Awards (HCIA).
Footnotes
The authors declare no conflict of interest.
Data deposition: The raw mass spectrometry data and the sequence database used for searches may be downloaded from MassIVE (massive.ucsd.edu/) using the identifier MSV000079107. Download this dataset directly from ftp://MSV000079107:a@massive.ucsd.edu.
This article contains supporting information online at www.pnas.org/lookup/suppl/doi:10.1073/pnas.1515623112/-/DCSupplemental.
References
- 1.Rhee HW, et al. Proteomic mapping of mitochondria in living cells via spatially restricted enzymatic tagging. Science. 2013;339(6125):1328–1331. doi: 10.1126/science.1230593. [DOI] [PMC free article] [PubMed] [Google Scholar]
- 2.Brand AH, Perrimon N. Targeted gene expression as a means of altering cell fates and generating dominant phenotypes. Development. 1993;118(2):401–415. doi: 10.1242/dev.118.2.401. [DOI] [PubMed] [Google Scholar]
- 3.Kalderon D, Roberts BL, Richardson WD, Smith AE. A short amino acid sequence able to specify nuclear location. Cell. 1984;39(3 Pt 2):499–509. doi: 10.1016/0092-8674(84)90457-4. [DOI] [PubMed] [Google Scholar]
- 4.Wen W, Meinkoth JL, Tsien RY, Taylor SS. Identification of a signal for rapid export of proteins from the nucleus. Cell. 1995;82(3):463–473. doi: 10.1016/0092-8674(95)90435-2. [DOI] [PubMed] [Google Scholar]
- 5.Rizzuto R, Brini M, Pizzo P, Murgia M, Pozzan T. Chimeric green fluorescent protein as a tool for visualizing subcellular organelles in living cells. Curr Biol. 1995;5(6):635–642. doi: 10.1016/s0960-9822(95)00128-x. [DOI] [PubMed] [Google Scholar]
- 6.McQuibban GA, Lee JR, Zheng L, Juusola M, Freeman M. Normal mitochondrial dynamics requires rhomboid-7 and affects Drosophila lifespan and neuronal function. Curr Biol. 2006;16(10):982–989. doi: 10.1016/j.cub.2006.03.062. [DOI] [PubMed] [Google Scholar]
- 7.Martell JD, et al. Engineered ascorbate peroxidase as a genetically encoded reporter for electron microscopy. Nat Biotechnol. 2012;30(11):1143–1148. doi: 10.1038/nbt.2375. [DOI] [PMC free article] [PubMed] [Google Scholar]
- 8.Ross PL, et al. Multiplexed protein quantitation in Saccharomyces cerevisiae using amine-reactive isobaric tagging reagents. Mol Cell Proteomics. 2004;3(12):1154–1169. doi: 10.1074/mcp.M400129-MCP200. [DOI] [PubMed] [Google Scholar]
- 9.DeSouza L, et al. Search for cancer markers from endometrial tissues using differentially labeled tags iTRAQ and cICAT with multidimensional liquid chromatography and tandem mass spectrometry. J Proteome Res. 2005;4(2):377–386. doi: 10.1021/pr049821j. [DOI] [PubMed] [Google Scholar]
- 10.Wiese S, Reidegeld KA, Meyer HE, Warscheid B. Protein labeling by iTRAQ: A new tool for quantitative mass spectrometry in proteome research. Proteomics. 2007;7(3):340–350. doi: 10.1002/pmic.200600422. [DOI] [PubMed] [Google Scholar]
- 11.Mertins P, et al. iTRAQ labeling is superior to mTRAQ for quantitative global proteomics and phosphoproteomics. Mol Cell Proteomics. 2012;11(6):M111.014423. doi: 10.1074/mcp.M111.014423. [DOI] [PMC free article] [PubMed] [Google Scholar]
- 12.Vinayagam A, et al. Protein complex-based analysis framework for high-throughput data sets. Sci Signal. 2013;6(264):rs5. doi: 10.1126/scisignal.2003629. [DOI] [PMC free article] [PubMed] [Google Scholar]
- 13.Guruharsha KG, et al. A protein complex network of Drosophila melanogaster. Cell. 2011;147(3):690–703. doi: 10.1016/j.cell.2011.08.047. [DOI] [PMC free article] [PubMed] [Google Scholar]
- 14.Soltys BJ, Gupta RS. Mitochondrial-matrix proteins at unexpected locations: Are they exported? Trends Biochem Sci. 1999;24(5):174–177. doi: 10.1016/s0968-0004(99)01390-0. [DOI] [PubMed] [Google Scholar]
- 15.Stadler C, et al. Immunofluorescence and fluorescent-protein tagging show high correlation for protein localization in mammalian cells. Nat Methods. 2013;10(4):315–323. doi: 10.1038/nmeth.2377. [DOI] [PubMed] [Google Scholar]
- 16.Yin S, et al. Quantitative evaluation of the mitochondrial proteomes of Drosophila melanogaster adapted to extreme oxygen conditions. PLoS One. 2013;8(9):e74011. doi: 10.1371/journal.pone.0074011. [DOI] [PMC free article] [PubMed] [Google Scholar]
- 17.Lotz C, et al. Characterization, design, and function of the mitochondrial proteome: From organs to organisms. J Proteome Res. 2014;13(2):433–446. doi: 10.1021/pr400539j. [DOI] [PMC free article] [PubMed] [Google Scholar]
- 18.Smith AC, Blackshaw JA, Robinson AJ. MitoMiner: A data warehouse for mitochondrial proteomics data. Nucleic Acids Res. 2012;40(Database issue):D1160–D1167. doi: 10.1093/nar/gkr1101. [DOI] [PMC free article] [PubMed] [Google Scholar]
- 19.Sardiello M, Licciulli F, Catalano D, Attimonelli M, Caggese C. MitoDrome: A database of Drosophila melanogaster nuclear genes encoding proteins targeted to the mitochondrion. Nucleic Acids Res. 2003;31(1):322–324. doi: 10.1093/nar/gkg123. [DOI] [PMC free article] [PubMed] [Google Scholar]
- 20.Emanuelsson O, Brunak S, von Heijne G, Nielsen H. Locating proteins in the cell using TargetP, SignalP and related tools. Nat Protoc. 2007;2(4):953–971. doi: 10.1038/nprot.2007.131. [DOI] [PubMed] [Google Scholar]
- 21.Hu Y, et al. An integrative approach to ortholog prediction for disease-focused and other functional studies. BMC Bioinformatics. 2011;12:357. doi: 10.1186/1471-2105-12-357. [DOI] [PMC free article] [PubMed] [Google Scholar]
- 22.Rand DM, Haney RA, Fry AJ. Cytonuclear coevolution: The genomics of cooperation. Trends Ecol Evol. 2004;19(12):645–653. doi: 10.1016/j.tree.2004.10.003. [DOI] [PubMed] [Google Scholar]
- 23.Priyadarsini KI. 2010. Radiation Chemistry Applied to Antioxidant Research. Recent Trends in Radiation Chemistry, eds Wishart JF, Madhava Rao (World Scientific, Singapore), pp 577–596. [Google Scholar]
- 24.Mortensen A, Skibsted LH. Importance of carotenoid structure in radical-scavenging reactions. J Agric Food Chem. 1997;45(8):2970–2977. [Google Scholar]
- 25.Bendayan M. Worth its weight in gold. Science. 2001;291(5507):1363–1365. doi: 10.1126/science.291.5507.1363. [DOI] [PubMed] [Google Scholar]
- 26.Mayer G, Bendayan M. Biotinyl-tyramide: A novel approach for electron microscopic immunocytochemistry. J Histochem Cytochem. 1997;45(11):1449–1454. doi: 10.1177/002215549704501101. [DOI] [PubMed] [Google Scholar]
- 27.Ranganayakulu G, Schulz RA, Olson EN. Wingless signaling induces nautilus expression in the ventral mesoderm of the Drosophila embryo. Dev Biol. 1996;176(1):143–148. doi: 10.1006/dbio.1996.9987. [DOI] [PubMed] [Google Scholar]
- 28.Hinz U, Giebel B, Campos-Ortega JA. The basic-helix-loop-helix domain of Drosophila lethal of Scute protein is sufficient for proneural function and activates neurogenic genes. Cell. 1994;76(1):77–87. doi: 10.1016/0092-8674(94)90174-0. [DOI] [PubMed] [Google Scholar]
- 29.Speicher SA, Thomas U, Hinz U, Knust E. The Serrate locus of Drosophila and its role in morphogenesis of the wing imaginal discs: Control of cell proliferation. Development. 1994;120(3):535–544. doi: 10.1242/dev.120.3.535. [DOI] [PubMed] [Google Scholar]
- 30.Rappsilber J, Mann M, Ishihama Y. Protocol for micro-purification, enrichment, pre-fractionation and storage of peptides for proteomics using StageTips. Nat Protoc. 2007;2(8):1896–1906. doi: 10.1038/nprot.2007.261. [DOI] [PubMed] [Google Scholar]
- 31.Pagliarini DJ, et al. A mitochondrial protein compendium elucidates complex I disease biology. Cell. 2008;134(1):112–123. doi: 10.1016/j.cell.2008.06.016. [DOI] [PMC free article] [PubMed] [Google Scholar]
- 32.Berezikov E, et al. Deep annotation of Drosophila melanogaster microRNAs yields insights into their processing, modification, and emergence. Genome Res. 2011;21(2):203–215. doi: 10.1101/gr.116657.110. [DOI] [PMC free article] [PubMed] [Google Scholar]
Associated Data
This section collects any data citations, data availability statements, or supplementary materials included in this article.


