Abstract
We report a lipid-based strategy to visualize Golgi structure and dynamics at super-resolution in live cells. The method is based on two novel reagents: a trans-cyclooctene-containing ceramide lipid (Cer-TCO) and a highly reactive, tetrazine-tagged near-IR dye (SiR-Tz). These reagents assemble via an extremely rapid ‘tetrazine-click’ reaction into Cer-SiR, a highly photostable ‘vital dye’ that enables prolonged live cell imaging of the Golgi apparatus by 3D confocal and STED microscopy. Cer-SiR is non-toxic at concentrations as high as 2 μM and does not perturb the mobility of Golgi-resident enzymes or the traffic of cargo from the endoplasmic reticulum through the Golgi and to the plasma membrane.
Keywords: STED, membrane traffic, bio-orthogonal chemistry, click reaction, near-IR dye
Super-resolution ‘nanoscopes’ greatly increase the resolving power of light microscopes, revealing new details of organelle structure, function, and dynamics.[1] However the complex requirements for nanoscopy pose real challenges for fluorophore design and labelling: the fluorophore must be bright, photostable, and live cell-compatible, and the labelling must yield a high fluorophore density that is benign to organelle function. As nanoscopes push the resolution to tens of nanometers[2] there is a critical need for high density yet photostable probes[3] to demark organelle boundaries and study their dynamics.[4] While most nanoscopes image labelled proteins,[5] lipids are a complementary attractive target,[6] as they are present at approximately a hundredfold higher density and their organization defines the de facto boundary of the organelle. Commercial fluorescent lipids, such as BODIPY® FL C5-ceramide[7] are cell permeable, and widely used to label the Golgi, but they bleach too rapidly for prolonged imaging or super-resolution methods. Photostable dyes typically used for STED microscopy, such as Atto™ 647N and STAR635[8], suffer from non-specific binding[9] and lack of cell permeability and are ill suited for live cell STED imaging of intracellular structures.
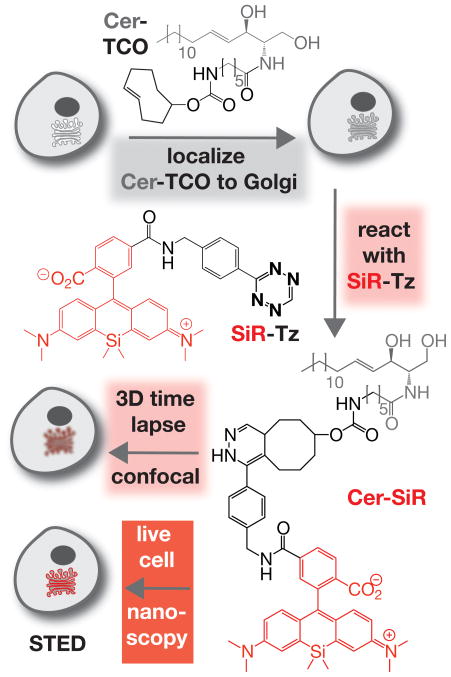
Herein we report a strategy to visualize Golgi structure and dynamics at super-resolution in live cells using a novel lipid-based fluorescent probe as a contrast agent. The labelling logic is based on two novel reagents: a trans-cyclooctene-containing ceramide lipid (Cer-TCO) and a highly reactive, tetrazine-tagged, near-IR dye (SiR-Tz). These reagents rapidly assemble via a ‘tetrazine-click’ reaction[10] into Cer-SiR, a non-toxic ‘vital dye’ whose extreme photostability enables prolonged live cell imaging by 3D confocal and STED microscopy (Figure 1). Cer-TCO was synthesized in 6 chemical steps; SiR-Tz was synthesized via a route modeled after SiR-6-Me-Tz (Scheme S1–2).[11]
Figure 1.
Two-step procedure for high-density labeling of the Golgi in living cells. Cells are treated first with Cer-TCO, a trans-cyclooctene-containing ceramide lipid, and then reacted with SiR-Tz, a tetrazine derivative of a highly photostable silicon rhodamine dye. The product of this reaction, Cer-SiR (only one isomer shown), allows extensive live cell imaging by 3D confocal and STED super-resolution microscopy.
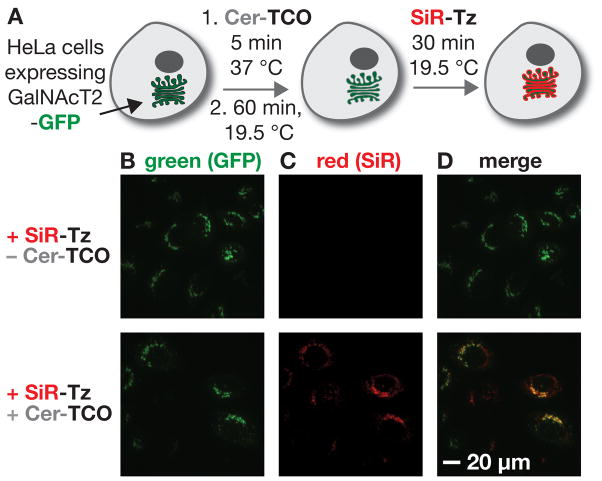
To evaluate if the Golgi could be selectively imaged using Cer-SiR, we used HeLa cells that stably expressed a protein fusion composed of GFP and N-acetylgalactosaminyltransferase 2 (GalNAcT2), a bona fide Golgi reporter.[12] These cells were treated with 2 μM Cer-TCO (5 min), maintained at 19.5 °C for 60 min to localize the lipid to the Golgi,[13] treated with 2 μM SiR-Tz (30 min), and visualized by confocal microscopy (Figure 2A). As expected, GalNAcT2-GFP displays a typical Golgi perinuclear localization regardless of whether or not Cer-TCO or SiR-Tz were added (Figure S3 and 2B). However, treatment of cells with Cer-TCO followed by SiR-Tz led to bright red labeling at the Golgi region (Figure 2C, D and S2); [14] premixed SiR-Tz and Cer-TCO are not suitable for Golgi labeling, presumably due to the low cell permeability of Cer-SiR. The GalNAcT2-GFP and Cer-SiR signals colocalized with a Pearson’s coefficient of 0.50 ± 0.02; the signals from GalNAcT2-GFP and SiR-Tz was 0.08 ± 0.01 (p<0.0001) (Figure S5), supporting that Cer-TCO effectively localized to the Golgi and reacted efficiently with SiR-Tz.
Figure 2.
Cer-TCO localizes and reacts with SiR-Tz to visualize the Golgi in live cells. a) HeLa cells expressing the Golgi reporter protein GalNAcT2-GFP were treated with Cer-TCO (2 μM), subjected to a temperature block to accumulate the ceramide lipid in the Golgi, and labeled with SiR-Tz (2 μM). b–d) Incubation with SiR-Tz alone does not label the cells, whereas treatment with Cer-TCO and Sir-Tz leads to a reaction product (red) that colocalizes with the Golgi marker GalNAcT2-GFP (green); see also Figure S2.
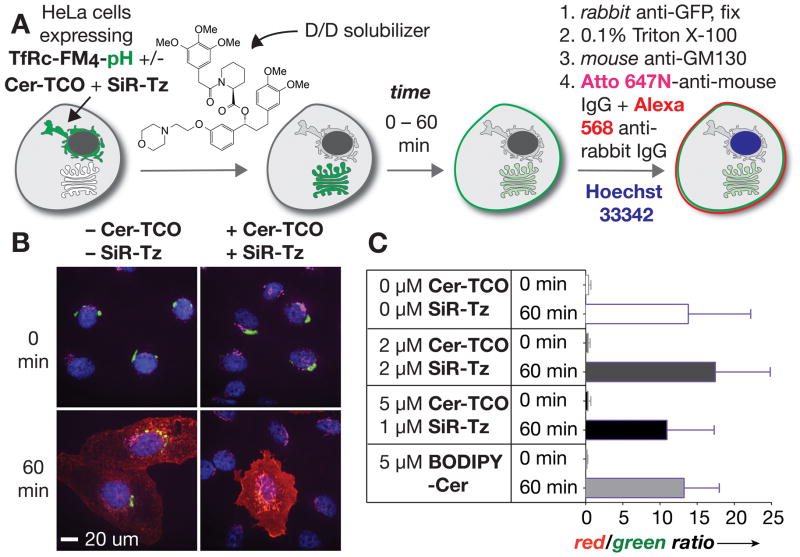
To verify that the Golgi was functional in cells treated with Cer-TCO and SiR-Tz, we monitored traffic both through and within the Golgi. First, we transiently expressed HeLa cells with the fusion protein ‘TfRc-FM4-pH’, which consists of the transferrin receptor (TfRc), four F36M-FKBP (FM) domains, and pHluorin, a pH sensitive mutant of GFP.[15] Fusion proteins containing four FM domains aggregate and remain trapped in the endoplasmic reticulum (ER),[16] but de-aggregate rapidly upon addition of ‘D/D’-solubilizer [17] (Clontech #635054) (Figure 3A). Expression of TfRc-FM4-pH led to large fluorescent perinuclear punctae (Figure 3B, 0 min, left panel). As expected, addition of ‘D/D’ solubilizer caused the TfRc-FM4-pH to traffic to the Golgi and then to the plasma membrane (PM), where it was detected on the cell surface by immunostaining (Figure 3B, 60 min (left panel). Importantly, Cer-TCO and SiR-Tz (as described above) caused no obvious change in the ability of TfRc-FM4-pH to traffic through the Golgi and to the PM (Figure 3B, 60 min., right panel).
Figure 3.
a) Endpoint trafficking assay using TfRc-FM4-pH and ‘D/D’ solubilizer to distinguish between cargo that reached the plasma membrane or remained inside the cell. b) HeLa cells expressing TfRc-FM4-pH (green) were treated with or without Cer-TCO and SiR-Tz and fixed 0 or 60 min after the ‘D/D’ solubilizer-promoted release of TfRc-FM4-pH from the ER. Cells were immunostained to visualize the Golgi (magenta) and TfRc-FM4-pH on the cell surface (red). At 0 min, TfRc-FM4-pH (green) is localized to the ER, whereas at 60 min it is localized to the cell surface. Nuclei were stained with Hoechst 33342 (blue). c) Ratio of red/green channels shows the fraction of cargo (TfRc-FM4-pH) that reached the surface.
To quantitatively determine if different concentrations of Cer-TCO/SiR-Tz perturbed traffic of TfRc-FM4-pH through the Golgi we adapted this assay to ratiometrically monitor the fraction of TfRc-FM4-pH that reached the PM in the presence or absence of Cer-TCO/SiR-Tz. Specifically, we compared the total fluorescence in cells due to TfRc-FM4-pH (green channel) to the amount on the cell surface by detecting the latter with an Alexa-568 anti-GFP antibody (red channel) at 0 and 60 min after the addition of ‘D/D’ solubilizer. Cells were treated with 0, 2 or 5 μM of Cer-TCO and SiR-Tz and the amount of TfRc-FM4-pH within the cell and at the PM was quantified by ImageJ[18] at 0 min (immediately after addition of ‘D/D’ solubilizer) and after 60 min (Figure 3C). Notably, excluding highly overexpressing cells, plots of the raw GFP (green) and Alexa-568 (red) signals (Figure S6) or the red/green ratio (Figure 3C) are virtually identical regardless of whether the cells were treated with Cer-TCO and SiR-Tz or not. This ratiometric inside/out assay supports that Cer-TCO and SiR-Tz had no effect on the fraction of TfRc-FM4-pH that trafficked from the ER to plasma membrane via the Golgi apparatus.
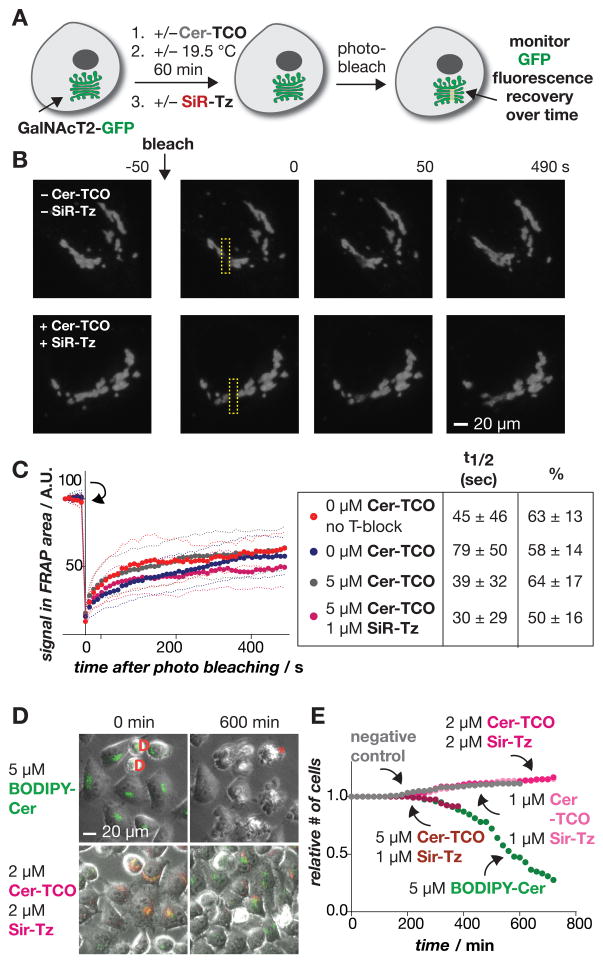
To further test whether Cer-TCO and SiR-Tz affected traffic within the Golgi, we used HeLa cells that stably expressed GalNAcT2-GFP[12] and monitored its intra-organelle mobility by fluorescence recovery after photobleaching (FRAP) (Figure 4A).[19] A small rectangular area of the Golgi (~2.2 microns wide) was photobleached at 488 nm and FRAP was monitored over 490 seconds (Figure 4). Importantly both the t1/2 of recovery and mobile fraction were unchanged when the cells were treated with Cer-TCO alone or the combination of 5 μM Cer-TCO and 1 μM SiR-Tz (Figure 4C). Thus, treatment of cells with these probes had no detectable change in the diffusion of GalNAcT2-GFP within the Golgi apparatus.
Figure 4.
Intra-Golgi trafficking is unaffected by Cer-TCO and SiR-Tz. a) Cells expressing GalNAcT2-GFP (green) are labeled with Cer-TCO and SiR-Tz, photobleached, and the fluorescence recovery after photobleaching monitored vs. time. b) Examples of fluorescence recovery at 0–490 sec after photobleaching cells treated with or without Cer-TCO/SiR-Tz. c) Plots showing that fluorescence recovery occurs at a similar rate and extent irrespective of Cer-TCO/SiR-Tz concentration and with or without temperature block. d) Differential effects of prolonged illumination on GalNacT4-GFP (green) cells labeled with BODIPY-Cer (green) or Cer-TCO and SiR-Tz (red). D = cells dividing; * = dying cell. e) Quantification of live cell data from (d) shows the relative number of healthy cells as a function of time after different conditions.
In the above experiments the cells were exposed to Cer-TCO/SiR-Tz for minutes, a relatively short time period. To evaluate whether this Golgi labeling strategy would result in cell- or photo-toxicity over prolonged periods (hours), HeLa cells were treated with varying concentrations of either Cer-TCO/SiR-Tz or BODIPY® FL C5-ceramide (BODIPY-Cer),[7] a vital fluorescent dye that labels the Golgi. Live cell phase contrast and fluorescent images acquired every 10 min over a period of 6–10 hours showed no adverse effect of 2 μM Cer-TCO/Sir-Tz on cell morphology or number (Figure 4D and E). In contrast, 5 μM BODIPY-Cer (the concentration typically used[7]) induced cell rounding and de-attachment after ~6 hours (Figure 4D); this observation suggests a need for caution in using BODIPY-Cer in long-term experiments. Together, the results of these three different assays indicate that neither the reaction components Cer-TCO and SiR-Tz nor their reaction product Cer-SiR has any significant effect on cell morphology (Figure 4D), mobility of proteins (GalNAcT2-GFP) within the Golgi (Figure 4A–C), or in cargo traffic (TfRc-FM4-pH) from the ER through the Golgi and to the PM (Figure 3).
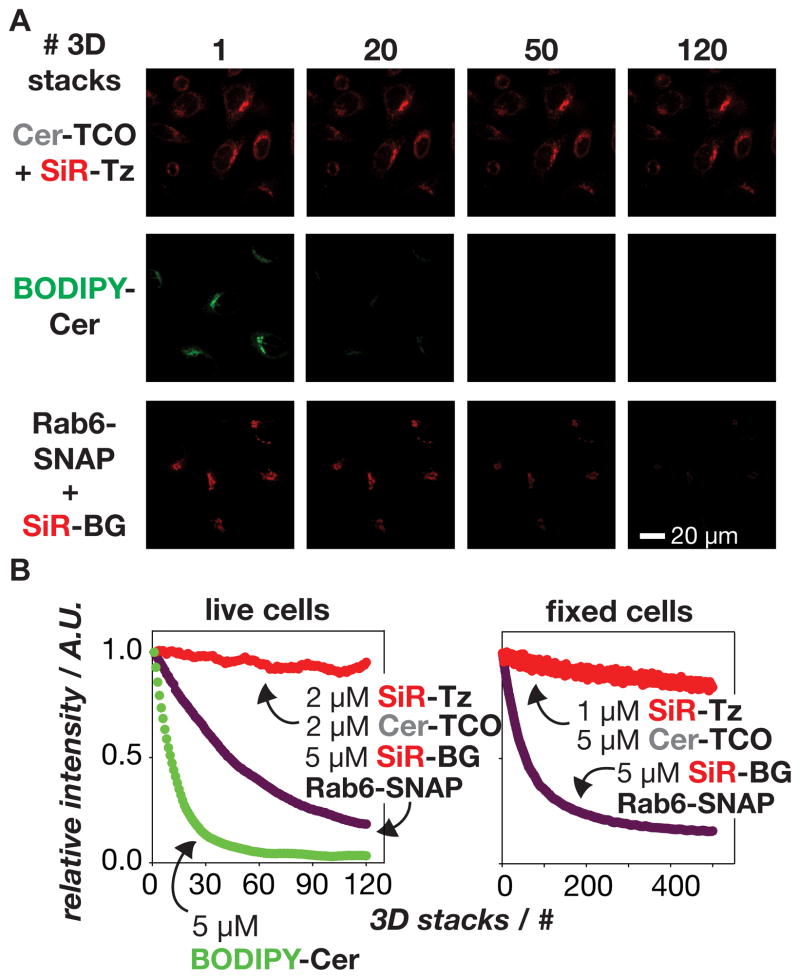
We next compared the relative photostability of Cer-TCO/SiR-Tz to both BODIPY-Cer and the SiR labeled SNAP-tag Golgi protein, Rab6; the latter is the product of reaction between Rab6-SNAP and a benzyl guanine derivative of SiR (SiR-BG)[11] and thus contains the same near-IR dye as SiR-Tz (Figure 5).[20] HeLa cells were treated with Cer-TCO/SiR-Tz or BODIPY-Cer, while Rab6-SNAP-expressing cells were treated with SiR-BG. The cells were then examined in sequential 3D images using spinning disk confocal microscopy; 3D visualization limited fluctuations due to axial sample drift. In each case, 3D ‘stacks’ of 22 optical sections were acquired in series up to 500 times in live or fixed cells (Figure 5A–C). In live cells, even under optimal imaging conditions the BODIPY-Cer fluorescent signal decreased by 50% after fewer than 15 stacks. In striking contrast, the fluorescent signal of cells treated with 2 μM Cer-TCO followed by 2 μM SiR-Tz decreased by only 10% after more than 120 3D stacks had been acquired. The signal from Rab6-SNAP-SiR decayed at an intermediate rate, decreasing by 50% after ~50 3D stacks. Striking differences between Rab6-SNAP-SiR and Cer-SiR were also observed in fixed cells; after 500 3D stacks the fluorescent signal of Cer-SiR decreased 16% whereas that of Rab6-SNAP-SiR decreased by 84%. We note that the initial average intensity per cell of Cer-SiR and Rab6-SNAP-SiR were similar in live and fixed cells, yet Cer-SiR was more resistant to photobleaching. While the precise mechanism of the enhanced photostability of Cer-SiR will require additional investigation, the net effect is a vital dye that allows very long 3D time lapse imaging of Golgi dynamics.[21]
Figure 5.
Golgi labeled with the lipid Cer-SiR is extremely stable to prolonged illumination using spinning disk confocal microscopy. a) Images show cells labeled with Cer-SiR (Cer-TCO+SiR-Tz), BODIPY-Cer, or the protein Rab6-SNAP labeled with SiR (Rab6-SNAP+SiR-BG) after acquisition of 1–120 3D image stacks (22 images/stack). b) Plot of the relative, average per-cell intensity of cells labeled with different lipid and protein probes as a function of the number of acquired 3D stacks.
The extreme photostability of Cer-SiR makes it particularly well suited for STED microscopy, which uses confocal line scanning with a powerful donut-shaped depletion beam to achieve super-resolution. While in principle most fluorescent dyes are suitable for STED, in practice the high intensity laser used to rapidly and repeatedly cycle molecules between their ground and exited states can drive dyes into triplet or other high energy states and cause them to quickly bleach. While ‘anti-fade’ triplet state quenchers such as Trolox and cyclooctatetraene[22] can mitigate this effect, they are toxic to live cells. SiR is a remarkable dye for live cell STED as it is cell permeable and similar in photostability to top STED dyes such as Atto647N.[11]
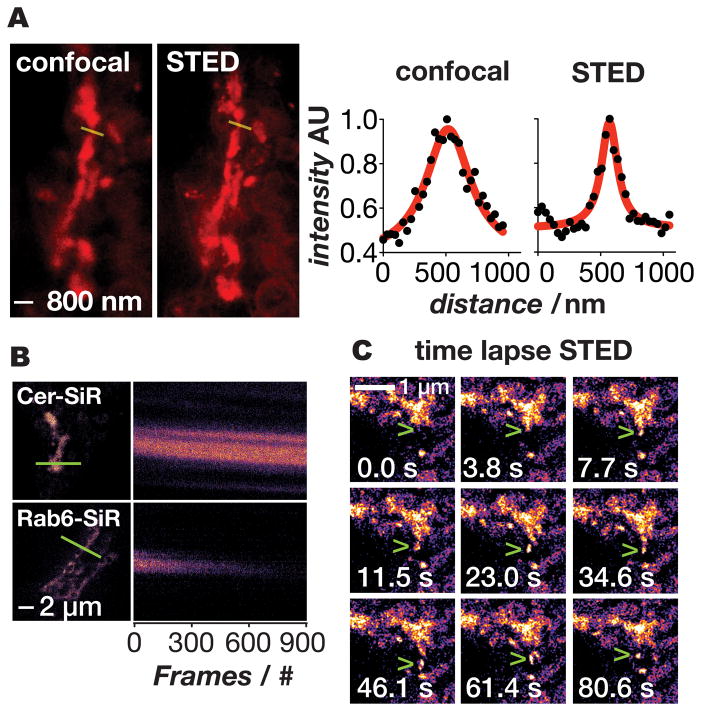
To evaluate the merits of Cer-SiR for super-resolution imaging of the Golgi, GalNAcT2-GFP cells were labeled with Cer-TCO and SiR-Tz, as described above, and imaged by confocal and STED microscopy on a commercial Leica instrument (Figure 6). As expected the STED image is sharper as seen in the image and the line profiles across the Golgi, demonstrating the suitability of Cer-SiR for STED microscopy. We next performed a direct comparison of the relative photostabilities of Cer-SiR and SiR-SNAP-Rab6 in fixed cells using a custom STED microscope that is optimized for rapid image acquisition (Figure 6B). Cells labelled with Cer-SiR or SiR-SNAP-Rab6 were continuously imaged at a rate of 0.52 frames/sec for 29 min (900 images) and the intensity of a line across the Golgi was plotted (Figure 6B). The images of cells labeled with Cer-SiR were stable throughout the 900 images, whereas those labeled with SiR-SNAP-Rab6 lost half their fluorescence after about 300 images; these data are consistent with the 3D spinning disk confocal results (Figure 5). Indeed, the exceptional resolution and photostability enabled by Cer-SiR allowed vesicles to be visualized budding and exiting the Golgi (Figure 6C and Supplemental Movie 1).
Figure 6.
Super-resolution imaging of the Golgi in live cells using Cer-SiR. a) Confocal and STED images of the Golgi in live cells treated with Cer-TCO and SiR-Tz. Line traces through the Golgi (yellow) show the greatly improved resolving power of STED (right panel). b) Kymographs (line profile vs. time) of fixed cells imaged by STED in which the Golgi was labeled with Cer-SiR or SiR-SNAP-Rab6 (Rab6 is a Golgi targeted protein); note that the signal decays much more quickly when the protein is labeled with SiR. c) Time lapse STED of vesicle budding and trafficking out of the Golgi (green arrowhead).
In summary, we report herein two novel reagents that enable Golgi structure and dynamics to be visualized at super-resolution in live cells. The two reagents, a trans-cyclooctene-containing ceramide lipid (Cer-TCO) and a highly reactive, tetrazine-tagged near-IR dye (SiR-Tz) assemble via an extremely rapid ‘tetrazine-click’[10] reaction into Cer-SiR, a ‘vital dye’ that enables prolonged live cell imaging of the Golgi apparatus by 3D confocal and STED microscopy. Cer-SiR is exceptionally photostable and should greatly facilitate subsequent studies of Golgi dynamics in primary cells and tissue.
Supplementary Material
Footnotes
This study was supported by the Wellcome Trust Foundation and by NIH GM83257 (ADT and AS). RSE was supported by a postdoctoral fellowship from the Swiss National Science Foundation. HT is supported by a JSPS postdoctoral fellowship for research abroad. We are grateful to Kai Johnsson (EPFL) for a generous gift of SiR-OH and SiR-BG and to Brian Storrie (UAMS) for the GalNAcT2-GFP cell line.
Supporting information for this article is available on the WWW under http://www.angewandte.org or from the author.
Contributor Information
Dr. Roman S. Erdmann, Department of Chemistry, Yale University, 225 Prospect Street, New Haven CT 06511 (USA), Fax: (+1) 203-432-3486. Department of Cell Biology, Yale University School of Medicine, 333 Cedar Street, New Haven, CT 06520 (USA)
Dr. Hideo Takakura, Department of Cell Biology, Yale University School of Medicine, 333 Cedar Street, New Haven, CT 06520 (USA)
Mr. Alexander D. Thompson, Department of Chemistry, Yale University, 225 Prospect Street, New Haven CT 06511 (USA), Fax: (+1) 203-432-3486
Felix Rivera-Molina, Department of Cell Biology, Yale University School of Medicine, 333 Cedar Street, New Haven, CT 06520 (USA).
Dr. Edward S. Allgeyer, Department of Cell Biology, Yale University School of Medicine, 333 Cedar Street, New Haven, CT 06520 (USA)
Dr. Prof. Joerg Bewersdorf, Department of Cell Biology, Yale University School of Medicine, 333 Cedar Street, New Haven, CT 06520 (USA)
Dr. Prof. Derek K. Toomre, Email: derek.toomre@yale.edu, Department of Cell Biology, Yale University School of Medicine, 333 Cedar Street, New Haven, CT 06520 (USA)
Dr. Prof. Alanna Schepartz, Email: alanna.schepartz@yale.edu, Department of Chemistry, Yale University, 225 Prospect Street, New Haven CT 06511 (USA), Fax: (+1) 203-432-3486
References
- 1.a) van de Linde S, Heilemann M, Sauer M. Annu Rev Phys Chem. 2012;63:519–540. doi: 10.1146/annurev-physchem-032811-112012. [DOI] [PubMed] [Google Scholar]; b) Toomre D, Bewersdorf J. Annu Rev Cell Dev Biol. 2010;26:285–314. doi: 10.1146/annurev-cellbio-100109-104048. [DOI] [PubMed] [Google Scholar]; c) Huang B, Bates M, Zhuang XW. Annu Rev Biochem. 2009;78:993–1016. doi: 10.1146/annurev.biochem.77.061906.092014. [DOI] [PMC free article] [PubMed] [Google Scholar]; d) Hell SW. Science. 2007;316:1153–1158. doi: 10.1126/science.1137395. [DOI] [PubMed] [Google Scholar]
- 2.Goettfert F, Wurm CA, Mueller V, Berning S, Cordes VC, Honigmann A, Hell SW. Biophys J. 2013;105:L1–L3. doi: 10.1016/j.bpj.2013.05.029. [DOI] [PMC free article] [PubMed] [Google Scholar]
- 3.Shroff H, Galbraith CG, Galbraith JA, Betzig E. Nat Methods. 2008;5:417–423. doi: 10.1038/nmeth.1202. [DOI] [PMC free article] [PubMed] [Google Scholar]
- 4.a) Carlini L, Manley S. ACS Chem Biol. 2013;8:2643–2648. doi: 10.1021/cb400467x. [DOI] [PubMed] [Google Scholar]; b) Shim SH, Xia C, Zhong G, Babcock HP, Vaughan JC, Huang B, Wang X, Xu C, Bi GQ, Zhuang X. Proc Natl Acad Sci U S A. 2012;109:13978–13983. doi: 10.1073/pnas.1201882109. [DOI] [PMC free article] [PubMed] [Google Scholar]
- 5.Hinner MJ, Johnsson K. Curr Opin Biotechnol. 2010;21:766–776. doi: 10.1016/j.copbio.2010.09.011. [DOI] [PubMed] [Google Scholar]
- 6.a) Yang J, Seckute J, Cole CM, Devaraj NK. Angew Chem, Int Ed. 2012;51:7476–7479. doi: 10.1002/anie.201202122. [DOI] [PMC free article] [PubMed] [Google Scholar]; b) Thiele C, Papan C, Hoelper D, Kusserow K, Gaebler A, Schoene M, Piotrowitz K, Lohmann D, Spandl J, Stevanovic A, Shevchenko A, Kuerschner L. ACS Chem Biol. 2012;7:2004–2011. doi: 10.1021/cb300414v. [DOI] [PubMed] [Google Scholar]; c) Hang HC, Wilson JP, Charron G. Acc Chem Res. 2011;44:699–708. doi: 10.1021/ar200063v. [DOI] [PMC free article] [PubMed] [Google Scholar]; d) Neef AB, Schultz C. Angew Chem, Int Ed. 2009;48:1498–1500. doi: 10.1002/anie.200805507. [DOI] [PubMed] [Google Scholar]; e) Jao CY, Roth M, Welti R, Salic A. Proc Natl Acad Sci U S A. 2009;106:15332–15337. doi: 10.1073/pnas.0907864106. [DOI] [PMC free article] [PubMed] [Google Scholar]
- 7.a) Marks DL, Bittman R, Pagano RE. Histochem Cell Biol. 2008;130:819–832. doi: 10.1007/s00418-008-0509-5. [DOI] [PMC free article] [PubMed] [Google Scholar]; b) Pagano RE, Martin OC, Kang HC, Haugland RP. J Cell Biol. 1991;113:1267–1279. doi: 10.1083/jcb.113.6.1267. [DOI] [PMC free article] [PubMed] [Google Scholar]
- 8.a) Kolmakov K, Wurm CA, Hennig R, Rapp E, Jakobs S, Belov VN, Hell SW. Chem Eur J. 2012;18:12986–12998. doi: 10.1002/chem.201201168. [DOI] [PubMed] [Google Scholar]; b) Wurm CA, Kolmakov K, Fabian Göttfert F, Ta H, Bossi M, Schill H, Berning S, Jakobs S, Donnert G, Belov VN, Hell SW. Optical Nanoscopy. 2012;1:1–7. [Google Scholar]
- 9.Hughes LD, Rawle RJ, Boxer SG. PLoS One. 2014:9. doi: 10.1371/journal.pone.0087649. [DOI] [PMC free article] [PubMed] [Google Scholar]
- 10.a) Carlson JCT, Meimetis LG, Hilderbrand SA, Weissleder R. Angew Chem, Int Ed. 2013;52:6917–6920. doi: 10.1002/anie.201301100. [DOI] [PMC free article] [PubMed] [Google Scholar]; b) Yang J, Karver MR, Li WL, Sahu S, Devaraj NK. Angew Chem, Int Ed. 2012;51:5222–5225. doi: 10.1002/anie.201201117. [DOI] [PMC free article] [PubMed] [Google Scholar]; c) Karver MR, Weissleder R, Hilderbrand SA. Bioconjugate Chem. 2011;22:2263–2270. doi: 10.1021/bc200295y. [DOI] [PMC free article] [PubMed] [Google Scholar]; d) Devaraj NK, Hilderbrand S, Upadhyay R, Mazitschek R, Weissleder R. Angew Chem, Int Ed. 2010;49:2869–2872. doi: 10.1002/anie.200906120. [DOI] [PMC free article] [PubMed] [Google Scholar]; e) Blackman ML, Royzen M, Fox JM. J Am Chem Soc. 2008;130:13518–13519. doi: 10.1021/ja8053805. [DOI] [PMC free article] [PubMed] [Google Scholar]
- 11.Lukinavicius G, Umezawa K, Olivier N, Honigmann A, Yang GY, Plass T, Mueller V, Reymond L, Correa IR, Luo ZG, Schultz C, Lemke EA, Heppenstall P, Eggeling C, Manley S, Johnsson K. Nature Chemistry. 2013;5:132–139. doi: 10.1038/nchem.1546. [DOI] [PubMed] [Google Scholar]
- 12.Storrie B, White J, Rottger S, Stelzer EHK, Suganuma T, Nilsson T. J Cell Biol. 1998;143:1505–1521. doi: 10.1083/jcb.143.6.1505. [DOI] [PMC free article] [PubMed] [Google Scholar]
- 13.a) Simon JP, Ivanov IE, Adesnik M, Sabatini DD. J Cell Biol. 1996;135:355–370. doi: 10.1083/jcb.135.2.355. [DOI] [PMC free article] [PubMed] [Google Scholar]; b) Kuliawat R, Arvan P. J Cell Biol. 1992;118:521–529. doi: 10.1083/jcb.118.3.521. [DOI] [PMC free article] [PubMed] [Google Scholar]; c) Griffiths G, Pfeiffer S, Simons K, Matlin K. J Cell Biol. 1985;101:949–964. doi: 10.1083/jcb.101.3.949. [DOI] [PMC free article] [PubMed] [Google Scholar]
- 14.Some Cer-SiR signal is also observed in the peri-nuclear area. This localization is not unanticipated, as de novo ceramide biosynthesis occurs in the ER. Mandon EC, Ehses I, Rother J, Vanechten G, Sandhoff K. J Biol Chem. 1992;267:11144–11148.Perry DK. BBA-Mol Cell Biol L. 2002;1585:146–152.
- 15.Solutions of premixed SiR-Tz and Cer-TCO are not suitable for Golgi labeling, presumably due to low cell permeability of Cer-SiR. For details see Figure S4.
- 16.Rivera-Molina F, Toomre D. J Cell Biol. 2013;201:673–680. doi: 10.1083/jcb.201212103. [DOI] [PMC free article] [PubMed] [Google Scholar]
- 17.Rivera VM, Wang XR, Wardwell S, Courage NL, Volchuk A, Keenan T, Holt DA, Gilman M, Orci L, Cerasoli F, Rothman JE, Clackson T. Science. 2000;287:826–830. doi: 10.1126/science.287.5454.826. [DOI] [PubMed] [Google Scholar]
- 18.Clackson T, Yang W, Rozamus LW, Hatada M, Amara JF, Rollins CT, Stevenson LF, Magari SR, Wood SA, Courage NL, Lu XD, Cerasoli F, Gilman M, Holt DA. Proc Natl Acad Sci U S A. 1998;95:10437–10442. doi: 10.1073/pnas.95.18.10437. [DOI] [PMC free article] [PubMed] [Google Scholar]
- 19.Schneider CA, Rasband WS, Eliceiri KW. Nat Methods. 2012;9:671–675. doi: 10.1038/nmeth.2089. [DOI] [PMC free article] [PubMed] [Google Scholar]
- 20.Cole NB, Smith CL, Sciaky N, Terasaki M, Edidin M, Lippincott-Schwartz J. Science. 1996;273:797–801. doi: 10.1126/science.273.5276.797. [DOI] [PubMed] [Google Scholar]
- 21.a) Antony C, Cibert C, Geraud G, Maria AS, Maro B, Mayau V, Goud B. J Cell Sci. 1992;103:785–796. doi: 10.1242/jcs.103.3.785. [DOI] [PubMed] [Google Scholar]; b) Goud B, Zahraoui A, Tavitian A, Saraste J. Nature. 1990;345:553–556. doi: 10.1038/345553a0. [DOI] [PubMed] [Google Scholar]
- 22.The relative fluorescence of SiR(carboxyl) is higher than that of SiR-Tz and SiR-Cer. For details see Table S1 and Figure S1.
- 23.Dave R, Terry DS, Munro JB, Blanchard SC. Biophys J. 2009;96:2371–2381. doi: 10.1016/j.bpj.2008.11.061. [DOI] [PMC free article] [PubMed] [Google Scholar]
Associated Data
This section collects any data citations, data availability statements, or supplementary materials included in this article.


