Abstract
We have developed a computer simulation to evaluate the success of Implantable Cardioverter Defibrillators (ICDs) in a patient specific manner. Though we have verified the simulations by means of surface recordings of shock potentials in humans, recordings of potentials within the heart and torso are needed to further verify the model for use in a clinical setting. We suspended an ex-planted porcine heart in a torso shaped electrolytic tank and recorded potentials on the tank surface, the epicardial surface, and within the myocardium during ICD shocks and compared these recordings to finite element solutions based on the same geometries. Potentials recorded from the surface and within the volume of the torso tank agreed well with the simulated potentials. Quantitative comparison between recorded and simulated potentials showed a mean correlation of 0.90, a mean normalized RMS error of 0.102, and a mean relative error of 26.5%. These results suggest that our simulation model can guide the optimization of ICD design and use.
1. Introduction
Though a mature technology, electrical defibrillation continues to be essential in the treatment of fatal arrhythmias. Each year, about 100,000 implantable cardiac de-fibrillators (ICDs) are implanted in patients [1] to prevent sudden cardiac death and automatic-external-defibrillation (AEDs) are used more effectively every year [1]. While these devices save many lives, there is still great risk to the patient due to inappropriate shocks and shocks of too high energy [2], leading clinicians to be more judicious in use of ICDs and motivating new treatment methods for both ICD and AED applications [1]. To create these new and better treatment methods, clinicians and device designers would benefit from a quick and effective way to test new treatment strategies for defibrillation.
Our computation defibrillation model can quickly predict the effectiveness of various configuration of ICD or AED and can be used to direct clinical use of devices in a patient specific manner, or to test new defibrillation technologies and alternative application strategies [3, 4]. The pipeline involves predicting the electric field generated during defibrillation using finite element analysis based on patient geometry from MRI or CT scans and analyzing the electric field through the myocardium to determine the effectiveness of the device configuration. We have also shown that our model can accurately predict the surface potential distribution of patients with ICDs [5]. Even with this existing validation of the modeling pipeline, more insight into the ability of the model to predict the defibrillator electric fields through the torso volume is needed to validate the predicted cardiac potentials.
Using a human torso shaped tank, an epicardial sock, and multielectrode plunge needles, we created an environment to test and record the volumetric behavior of electric fields generated from ICDs, especially in and near the heart. With an excised heart and the ICD suspended in the tank, we applied and recorded defibrillation shocks on the tank surface, the heart surface, and within the myocardium. These recordings provide insight into details of the electric field generated by ICDs and the ability of our modeling pipeline to replicate it. Our results demonstrate the accuracy of our model in replicating the electric field generated by the ICD throughout a physical phantom of the human torso.
2. Methods
To verify our simulation pipeline for defibrillation, we recorded ICD discharge potentials throughout a torso shaped tank to compare with simulated potentials based on the same geometry and conductivity parameters. Recording of the discharge potentials required a setup similar to one used previously in our lab [6] in which a heart is suspended in a tank of electrolyte and recordings are measured with multiple electrodes. The data was then registered to the geometry of the torso tank and the heart. The geometries were then used to build a mesh and to set up simulation parameters and the resulting predicted volumetric potentials could be compared to recorded values.
2.1. Tank Experimentation
Each torso tank experiment (N=3) consisted of an explanted porcine heart and an ICD (Medtronic Virtuoso II DR or Medtronic Maximo II VR) suspended in a tank filled with electrolytic solution. The solution was a contained glucose and NaCl balanced to achieve a resistivity of 200 Ω/m. The ICD was placed in the tank to approximate a left sub-clavicle position with a 5 cm coil inserted into the right ventricle. The hearts used were excised minipig hearts that were electrically inactive over which we placed an epicardial sock and into both ventricles we inserted up to 20, 10-electrode plunge needles before submerging the heart.
With the heart, ICD, and electrodes in place, we carried out and recorded the potentials from manually induced shocks. To use the existing customized, 256-channel acquisition system at the CVRTI, which was designed for intrinsic bioelectric fields, the output of the ICD was attenuated by a factor of ∼1,300 using a passive voltage divider to yield the necessary low voltage amplitude. Potentials were recorded from the tank (192 electrodes), epicardial sock (247 electrodes), and the plunge needles (200 electrodes) for a total of 639 channels, each sampled at 8000 Hz. Signals were acquired in 3 separate recordings and time aligned as part of post-processing.
At the end of the experiment, ∼140 corresponding landmark points were acquired using an electromechanical digitizer (Microscribe) to register the heart (see next section) after post-experiment scanning with MRI. Correspondence points were acquired on the tank (16 points), the epicardial sock (20-40 points), each of the needles (20 points), the ICD can (10-20 points) and coil (5-10 points), and several points on the heart surface (∼50). Preparation of the hear for imaging involved replacing the recording needles with plastic spacer rods that were distinguishable in the scans, filling the chambers of the heart with alginate, and fixing the heart in formalin. The hearts were imaged in a 7 T small animal MRI scanner with FISP and FLASH sequencing.
2.2. Geometric Registration
Registration was needed to generate the geometric mesh for finite element analysis and to spatially compare the recorded and simulated potentials. Using correspondence points described in the previous section, we registered the tank and sock meshes, needle electrode locations, and the segmentation from MR images of the heart to the same geometric space. This was achieved using registration tools in SCIRun (scirun.org) and RANSAC [7] and ICP algorithms modified for rigid-body transformations.
2.3. Simulation
The simulation pipeline used in this paper is well established and described elsewhere [3]. There are some minor differences, mostly in the generation of the geometric mesh because previous applications used torso scans of patients instead of the torso tank used in these experiments.
The geometric models used in the simulation were generated from the registered image and electrode location data described in Section 2.2 using Seg3D (seg3d.org), BioMesh3D (scirun.org), SCIRun (scirun.org), and Tetgen (tetgen.org). Seg3D was used to segment the heart geometries and the needle electrodes from which a high quality mesh of the heart was then generated using BioMesh3D. After a subsequent registration step to bring all components into the same space, Tetgen was used to generate a conforming tetrahedral mesh. With this mesh and the measured boundary conditions from the ICD shock voltages, we carried out simulations of potentials throughout the torso tank. The simulated and recorded potentials were compared by means of correlation coefficient (ρ) relative error (RE) and normalized RMS error (Ē)
3. Results
The data presented in this paper further verifies our simulation pipeline and shows similarities between our predicted values and potentials recorded throughout the torso tank volume. The comparison shows qualitative and quantitative agreement between what is expected and observed, in addition to revealing some discrepancies that must be addressed to further improve simulation accuracy.
Quantitative comparison of the potential distributions shows high agreement between recorded and simulated potentials (Table 1). The correlation for the results from the three tests are very similar (ranging from 0.89 to 0.90) and show a generally high level agreement between the distribution profiles of the simulated and recorded data. The normalized RMS error is somewhat more varied and it shows best results in the second test. The relative error is the most varied across tests (ranging from 20.0 to 31.3 %) with the third test showing the lowest relative error at 20.0 %.
Table 1. Metrics relating the recorded and simulated potential distribution throughout the torso tank volume.
| ρ | Ē | RE | |
|---|---|---|---|
| Test 1 | 0.90 | 0.115 | 31.3 % |
| Test 2 | 0.89 | 0.079 | 28.1 % |
| Test 3 | 0.90 | 0.112 | 20.0 % |
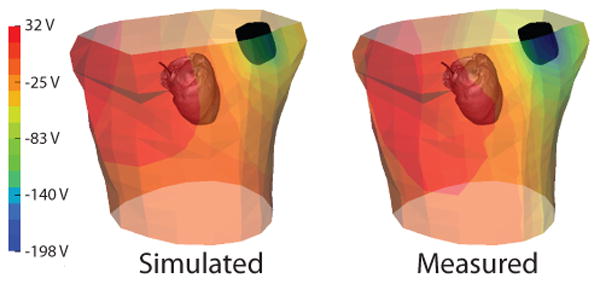
Qualitative comparison of the recorded and simulated potential distribution on the torso tank surface demonstrates agreement. Figure 1 shows representative results from one of the experiments (test 2). Areas of high and low potentials correspond in both cases, however, there are some differences in profile of the distribution. In this case, the positive region on the right side of the torso extends more inferiorly in the measured maps (left panel) than in the simulated. The measured potential map also revealed higher gradients on the torso surface and larger areas of homogeneous potentials, than the simulated values.
Figure 1.

Comparison of measured and simulated potentials on the tank surface as observed during test 2. The heart and ICD can and coil geometries (black) are also shown for reference.
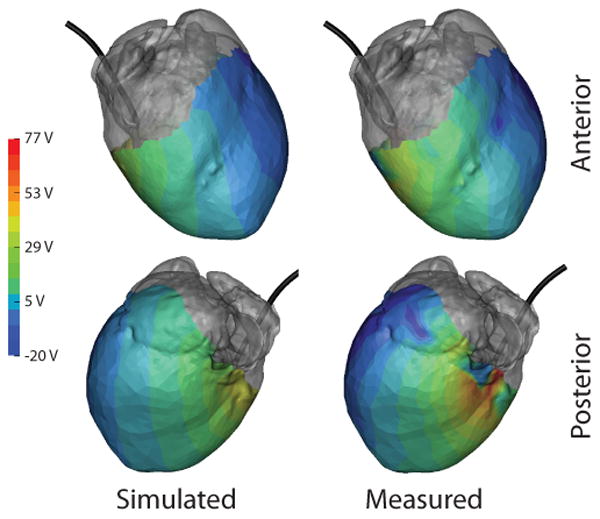
Qualitative comparison of the recorded and simulated potential distributions on the cardiac surface for measured and simulated cases demonstrated similar agreement. As shown in Figure 2, the maxima in the potential distributions roughly correspond in location. However, there was greater inhomogeneity in the observed gradients across the cardiac surface of the measured values as with the results on the tank surface.
Figure 2.

Comparison of measured and simulated potentials on the cardiac surface as observed during test 2. Gray regions indicate areas not covered by the cardiac sock. ICD coil (black) is included from reference.
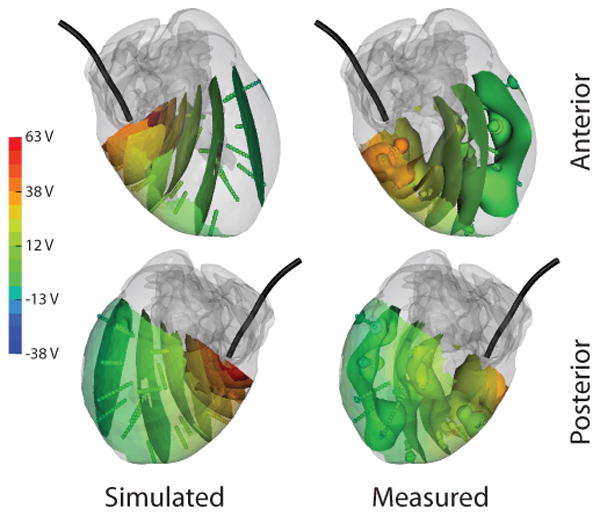
Qualitative comparison of the recorded and simulated potential distribution within the myocardium also demonstrates agreement. Though only iso-value surfaces are shown, it is apparent from Figure 3 that extrema generally corresponded in location, with similar differences in profiles as seen in other cases, with the extrema are more disparate on this scale than with the tank or heart surface. The recorded potential distribution again showed higher spacial gradients than in the simulation.
Figure 3.

Comparison of measured and simulated potentials within the myocardium as observed during test 2. Gray regions indicate regions too far from the needle locations to record. Colored surfaces within the myocardium indicate iso-values of the potential field. ICD coil (black) is included from reference.
4. Discussion and conclusions
The goal of this paper was to verify our simulation approach to predicting defibrillation behavior within the entire volume of the torso and the heart, augmenting our previous evaluation of this approach in human subjects based only on body surface measurements[5]. The high degree of qualitative and quantitative agreement between simulated and measured potentials in the torso tank setup provide confidence in our simulation pipeline. Though there is general agreement, discrepancies detectable in the comparisons provide insight into techniques that will improve accuracy in the simulations.
The comparison of simulated ICD potentials and potentials recorded throughout the volume of the torso tank provides insight into our modeling pipeline. The similar potential distributions seen in Figures 1, 2, and 3 and low error in Table 1 show that the simulation was generally effective in predicting electric fields similar to those measured. These results are similar to what we observed in previous verification studies [5] and provide further encouragement for use of our simulation approach.
Small differences in the potential field distributions of the recorded and simulated potentials provide some insight into sources of errors and motivate further improvements in the pipeline. There were regions of higher gradients in the measured potential distributions than simulated (Figures 1, 2, and 3). The regions of high gradients in the recorded case were most common near the ICD can and coil locations. These differences in potential field profiles could have resulted from registration errors, particularly with the ICD geometries because they were registered manually. However, these differences could also be caused by assuming incorrect conductivity in the finite element computations. Specifically in the simulations we assumed isotropic conductivity in the myocardium, which is known to be anisotropic; adding conductivity tensors to the model will change the potential distributions in the heart and near the tank surface, and may also increase the accuracy of the simulations [8, 9].
The verification of our modeling pipeline using torso tank experiments presented in this study support a number of our previous findings [3]. For example, those findings indicated that the potential field distribution resulting from ICD discharge is highly sensitive to device geometry and location, as well as conductivity parameters of the tissues. This sensitivity necessitates great care when constructing models of defibrillation. Given this fundamental sensitivity to geometry and device placement, simulation is thus clearly more flexible and powerful than experimental approaches when attempting to to discover new methods to improve the use of defibrillators through location optimization. The verification data presented here provides further confidence in our simulation approach to address this problems and others.
Acknowledgments
The research presented in this paper was made possible with help from Jayne Davis, Alicia Booth, Philip Ershler, and Bruce Steadman from the Cardiovascular Research and Training Institute (CVRTI) and the Nora Eccles Treadwell Foundation. This project was also supported by the National Institute of General Medical Sciences of the National Institutes of Health under grant number P41GM103545.
References
- 1.Go AS, Mozaffarian D, Roger VL, Benjamin EJ, Berry JD, Borden WB, Bravata DM, Dai S, Ford ES, Fox CS, Franco S, Fullerton HJ, Gillespie C, Hailpern SM, Heit JA, Howard VJ, Huffman MD, Kissela BM, Kittner SJ, Lackland DT, Lichtman JH, Lisabeth LD, Magid D, Marcus GM, Marelli A, Matchar DB, McGuire DK, Mohler ER, Moy CS, Mussolino ME, Nichol G, Paynter NP, Schreiner PJ, Sorlie PD, Stein J, Turan TN, Virani SS, Wong ND, Woo D, Turner MB. Heart disease and stroke statistics–2013 update: a report from the american heart association. Circ. 2013 Jan;127(1):e6–e245. doi: 10.1161/CIR.0b013e31828124ad. ISSN 1524-4539 (Electronic); 0009-7322 (Linking) [DOI] [PMC free article] [PubMed] [Google Scholar]
- 2.Ristagno G, Wang T, Tang W, Sun S, Castillo C, Weil MH. High-energy defibrillation impairs myocyte contractility and intracellular calcium dynamics. Critical Care Medicine. 2008;36(11 Suppl):S422–S427. doi: 10.1097/ccm.0b013e31818a84c5. [DOI] [PubMed] [Google Scholar]
- 3.Jolley M, Stinstra J, Tate J, Pieper S, Macleod R, Chu L, Wang P, Triedman J. Finite element modeling of subcutaneous implantable defibrillator electrodes in an adult torso. Heart Rhythm J. 2010 May;7(5):692–698. doi: 10.1016/j.hrthm.2010.01.030. [DOI] [PMC free article] [PubMed] [Google Scholar]
- 4.Pilcher T, Tate J, Saarel E, Puchalski M, MacLeod R. Scientific Sessions. American Heart Association; Nov, 2013. Effect of left ventricular assist devices on defibrillation thresholds: a computational simulation. [Google Scholar]
- 5.Tate J, Stinstra J, Pilcher T, Poursaid A, Saarel E, MacLeod R. Measuring defibrillator surface potentials for simulation verification. Proceedings of the IEEE Engineering in Medicine and Biology Society 33rd Annual International Conference. 2011;2011:239–242. doi: 10.1109/IEMBS.2011.6090045. [DOI] [PMC free article] [PubMed] [Google Scholar]
- 6.Shome S, MacLeod R. Functional Imaging and Modeling of the Heart, Lecture Notes in Computer Science. Vol. 4466. Springer-Verlag; 2007. Simultaneous high-resolution electrical imaging of endocardial, epicardial and torso-tank surfaces under varying cardiac metabolic load and coronary flow; pp. 320–329. [Google Scholar]
- 7.Torr P, Zisserman A. MLESAC: A new robust estimator with application to estimating image geometry. Journal of Computer Vision and Image Understanding. 2000;78(1):138–156. [Google Scholar]
- 8.Trayanova N, Skouibine K, Aguel F. The role of cardiac tissue structure in defibrillation. Chaos. 1998 Mar;8(1):221–233. doi: 10.1063/1.166299. [DOI] [PubMed] [Google Scholar]
- 9.Stinstra J, Jolley M, Tate J, Brooks D, Triedman J, MacLeod R. The role of volume conductivities in simulation of implantable defibrillators. In: Murray A, editor. Computers in Cardiology. Vol. 35. IEEE Press; 2008. pp. 481–484. Computers in Cardiology. [Google Scholar]


