

Abstract
High-risk neuroblastoma often develops resistance to high-dose chemotherapy. The mTOR signaling cascade is frequently deregulated in human cancers and targeting mTOR signaling sensitizes many cancer types to chemotherapy. Here, using a panel of neuroblastoma cell lines, we found that the mTOR inhibitor INK128 showed inhibitory effects on both anchorage-dependent and independent growth of neuroblastoma cells and significantly enhanced the cytotoxic effects of doxorubicin (Dox) on these cell lines. Treatment of neuroblastoma cells with INK128 blocked the activation of downstream mTOR signaling and enhanced Dox-induced apoptosis. Moreover, INK128 was able to overcome the established chemoresistance in the LA-N-6 cell line. Using an orthotopic neuroblastoma mouse model, we found that INK128 significantly inhibited tumor growth in vivo. In conclusion, we have shown that INK128-mediated mTOR inhibition possessed substantial antitumor activity and could significantly increase the sensitivity of neuroblastoma cells to Doxorubicin therapy. Taken together, our results indicate that using INK128 can provide additional efficacy to current chemotherapeutic regimens and represent a new paradigm in restoring drug sensitivity in neuroblastoma.
Keywords: Neuroblastoma, mTOR inhibitor, INK128, chemotherapy, Drug resistance
Introduction
Neuroblastoma is a neural crest derived pediatric solid tumor, which accounts for 15% of cancer-related mortality in children. This is often the result of metastatic progression secondary to poor response to current treatment modalities [1]. These tumors show heterogeneous biological and clinical features. Amplification of the MYCN gene remains the key predictor of poor outcome and is associated with advanced-stage disease, rapid tumor progression and poor survival [2]. Treatment of high-risk neuroblastoma with intense therapeutic interventions such as high-dose chemotherapy has only been able to achieve about 40% overall survival at 5 years. Therefore, the development of strategies targeting the pathways responsible for malignant transformation and progression is urgently required for the treatment of neuroblastoma.
mTOR is a “master regulator” of human protein synthesis, which serves as a central node integrating a number of signaling pathways. It helps normal cells sense nutrients and control cell proliferation and metabolism. But in many forms of cancer, mTOR reprograms cells to aberrantly divide, invade and metastasize [3, 4]. mTOR exists as two functional multi-protein complexes, mTORC1 and mTORC2. Previous studies suggest that inhibition of mTOR phosphorylation by mTOR inhibitors results in inhibition of cell growth, G0/G1 phase arrest, and induction of apoptosis [5–7]. However, the traditional mTOR inhibitors rapamycin and rapalogs, either used as single agent or in combination with other drugs, only have modest clinical activity against various tumors. Sometimes even opposite effects are seen with the use of these agents which is attributed to their incomplete inhibition of 4EBP1 phosphorylation and/or the lack of mTORC2 inhibition [8, 9]. Moreover, recent studies in cancer biology suggested that mTORC2 activity is essential for the survival of several types of cancer cells via activation of Akt and SGK1 but is less necessary in normal cells [10]. Furthermore, it also has been argued that drug resistance develops due to compensatory activation of mTORC2 signaling during the treatment with rapamycin analogs [11]. Therefore both mTORC1 and mTORC2 are promising targets for anti-tumor therapies.
A better understanding of the biology of neuroblastoma will potentially lead to the identification of novel therapeutic targets, which in turn could accelerate the development of new drugs for neuroblastoma treatment. Activation and dysregulation of the mTOR pathway has been implicated in neuroblastoma pathogenesis [12]. In the last few years a number of newly developed ATP-competitive small molecules have been reported to inhibit mTORC1 more efficiently and also block mTORC2, thus effectively target cancer cells and possess a more complete antitumor activity. INK128 is a recently discovered mTOR ATP-competitive small molecule inhibitor, which has excellent physiochemical properties and is undergoing evaluation for treating cancer in a phase I clinical trial [13]. In this study, we evaluated the inhibitory effect of INK128 on neuroblastoma growth. We found that INK128 inhibited both mTORC1 and mTORC2 signaling in neuroblastoma cells. We also found that INK128 suppressed cell viability and growth in vitro by inducing cell cycle arrest and cell apoptosis. INK128 significantly increased the sensitivity of neuroblastoma to doxorubicin (Dox) treatment. Moreover, INK128 also significantly suppressed the growth of neuroblastoma in an orthotopic xenograft mouse model. Overall the data presented here indicate that INK128 exhibits a potent inhibitory effect towards neuroblastoma growth both in vitro and in vivo, and it also can sensitize neuroblastoma to chemotherapy. Therefore, the results support further exploration of INK128 as a novel tool in the fight against neuroblastoma.
Results
mTOR inhibitor INK128 suppresses the viability and proliferation of neuroblastoma cells
To assess the effect of mTOR inhibition on neuroblastoma cell lines, we chose three MYCN-amplified cell lines: IMR32, NGP, NB-19 and three MYCN-non-amplified cell lines: CHLA-255, SK-N-AS, and SH-SY5Y, and treated them with increasing concentrations of INK128. We found that the treatment significantly reduced neuroblastoma cell viability in a dose-dependent manner (Fig. 1a). The cytotoxic effect of INK128 was also confirmed by morphological images of six neuroblastoma cell lines after treatment (Supplemental Fig. 1a). The colony forming assay showed a significant reduction in the ability to generate colonies after INK128 treatment compared with the untreated control (Fig. 1b). Compared with INK128, rapamycin is less potent on neuroblastoma cell viability reduction (Supplemental Fig. 1b). Effect of INK128 on cell cycle distribution was also investigated in the neuroblastoma cell lines. The result showed that treatment with INK128 led to cell cycle arrest, with greater percentage of cells in G1 phase (Supplemental Fig. 2a and b). These data demonstrate that the mTOR inhibitor, INK128, significantly suppresses neuroblastoma cell viability and growth, and this effect is independent of MYCN status.
Fig.1.
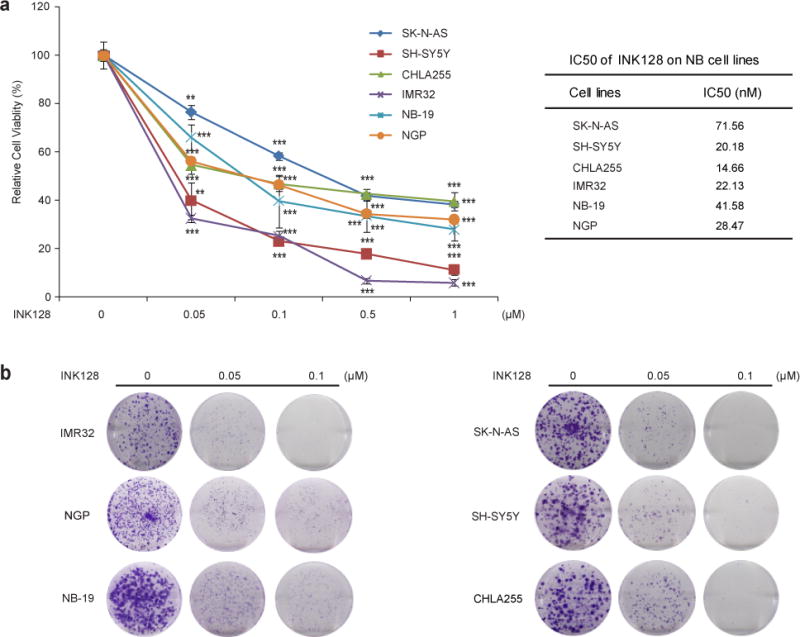
INK128 shows cytotoxic activity on neuroblastoma cell lines. (a) Six neuroblastoma cell lines were treated with the indicated concentrations of INK128 for 48 hrs. Cell viability was then measured by adding the mixture of 10 μL of CCK-8 and 190 μL of RPMI 1640 and reading the absorbance at 450 nm. Data were represented as mean ± SD. P values <0.01 (**) or <0.001 (***) were indicated. IC50 value of each cell line was listed. (b) A panel of six neuroblastoma cell lines were seeded in 6-well plates at 1×10³/well and allowed to settle for 24 hrs. Cells were then incubated with indicated concentrations of INK128 and grown in RPMI 1640 media for two to three weeks. The colonies generated were fixed, stained with crystal violet dye, and photographed.
mTOR inhibitor INK128 suppresses colony formation potential of neuroblastoma cells in soft agar
One unique property of cancer cells is the ability to grow in soft agar cultures [14]. To evaluate whether INK128 inhibits colony formation ability of neuroblastoma cell lines, soft agar assays were performed using a panel of six neuroblastoma cell lines. In this assay, we found that INK128 inhibited anchorage-independent colony formation of neuroblastoma cells in a dose-dependent manner (Fig. 2a and b).
Fig.2.
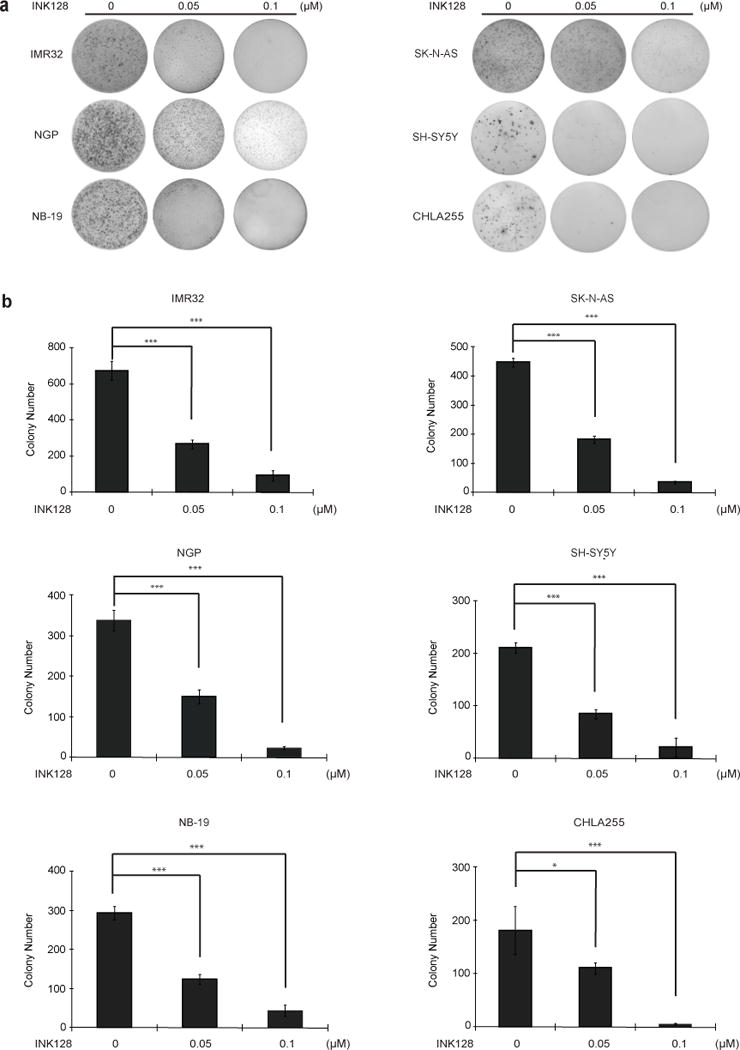
INK128 suppresses neuroblastoma cells anchorage-independent growth. (a) A panel of six neuroblastoma cell lines were seeded in 6-well plates with indicated concentrations of INK128 and agar, and grown for two to three weeks. Cells were stained with MTT for 4 hrs, and pictures were taken. (b) Colonies were counted and colony numbers were represented as mean ± SD. P values <0.05 (*) or <0.001 (***) were indicated.
mTOR inhibitor INK128 potently inhibits both mTORC1 and mTORC2 signaling in neuroblastoma cells
INK128 was reported to be a dual inhibitor of mTORC1 and mTORC2 in many tumor types [13]. To investigate whether the same inhibitory effects also exist in human neuroblastoma cell lines, six neuroblastoma cell lines were treated with INK128 for various lengths of time in vitro. Western blots were used to analyze mTORC1/2 activity and their downstream effectors. INK128 inhibited both mTORC1 and mTORC2 signaling in a time-dependent manner as indicated by the decrease in the phosphorylation level of downstream effectors. The phosphorylation of Thr235/236 on S6K and Thr37/46 on 4EBP1, which are both phosphorylated by mTORC1, was potently inhibited or totally abolished by INK128 in all cell lines tested (Fig. 3). mTORC2 kinase activity was also inhibited evidenced by the fact that the phosphorylation level of Thr308/Ser473 on Akt was dramatically decreased by INK128 in the cell lines tested (Fig. 3).
Fig.3.
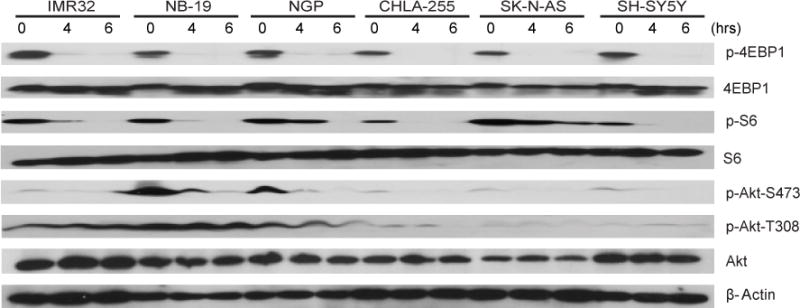
INK128 inhibits mTOR signaling in neuroblastoma cells. A panel of six neuroblastoma cell lines was treated with 0.2 μM INK128 for 0 hr, 4 hrs, and 6 hrs, lysed, subjected to SDS-PAGE and immunoblotted with indicated antibodies. β-Actin was detected as a loading control for whole cell extracts.
mTOR inhibitor INK128 inhibits glucose uptake and lactate production of neuroblastoma cells
Previous studies have revealed that high uptake of glucose and the extensive production of lactate is a common feature of cancer cells [15, 16]. And activation of PI3K/Akt/mTOR pathway often results in an increased glucose metabolism [17]. Therefore, we measured if glucose uptake of neuroblastoma cells can be affected by INK128 by performing glucose uptake assay. We found that INK128 inhibited glucose uptake significantly in three neuroblastoma cell lines tested (SK-N-AS, SH-SY5Y and IMR32) (Fig. 4a). To determine whether mTOR inhibition resulted in reduced glycolysis, lactate levels were measured after INK128 treatment. As shown in Fig. 4b, total lactate levels also decreased in all three cell lines tested when treated with INK128 compared to the untreated control. All these results suggest that inhibition of mTOR influences glucose metabolism in neuroblastoma.
Fig.4.
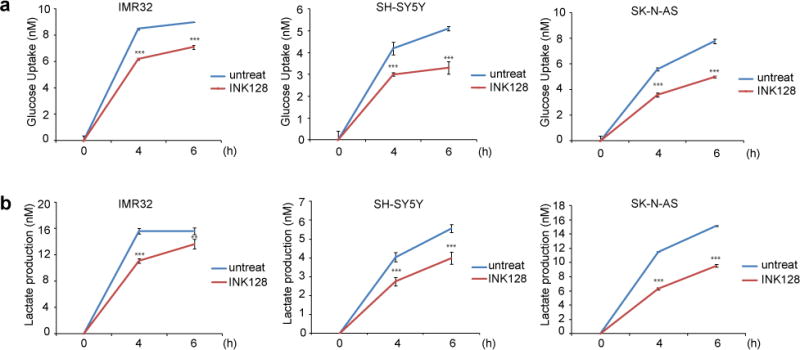
INK128 inhibits glucose metabolism in neuroblastoma. SH-SY5Y, IMR-32 and SK-N-AS cells were starved and treated with 5 μM INK128 for 0 hr, 4 hrs, and 6 hrs, then the medium was collected to measure glucose uptake (a) and lactate production (b). The results were represented as mean ± SD. P values <0.01 (**) or <0.001 (***) were indicated.
mTOR inhibition significantly enhances the cytotoxic effect of Dox on neuroblastoma cells
Since monotherapies are rarely effective in the treatment of high-risk neuroblastoma due to chemoresistance, we evaluated the synergistic effect of INK128 in combination with Dox using a panel of six neuroblastoma cell lines. Co-culture with mTOR inhibitor INK128 enhanced the cytotoxicity of Dox on all cell lines tested (Fig. 5a). Furthermore, mTOR inhibition also significantly increased Dox-induced PARP cleavage, which indicated increased cell-death (Fig. 5b).
Fig.5.
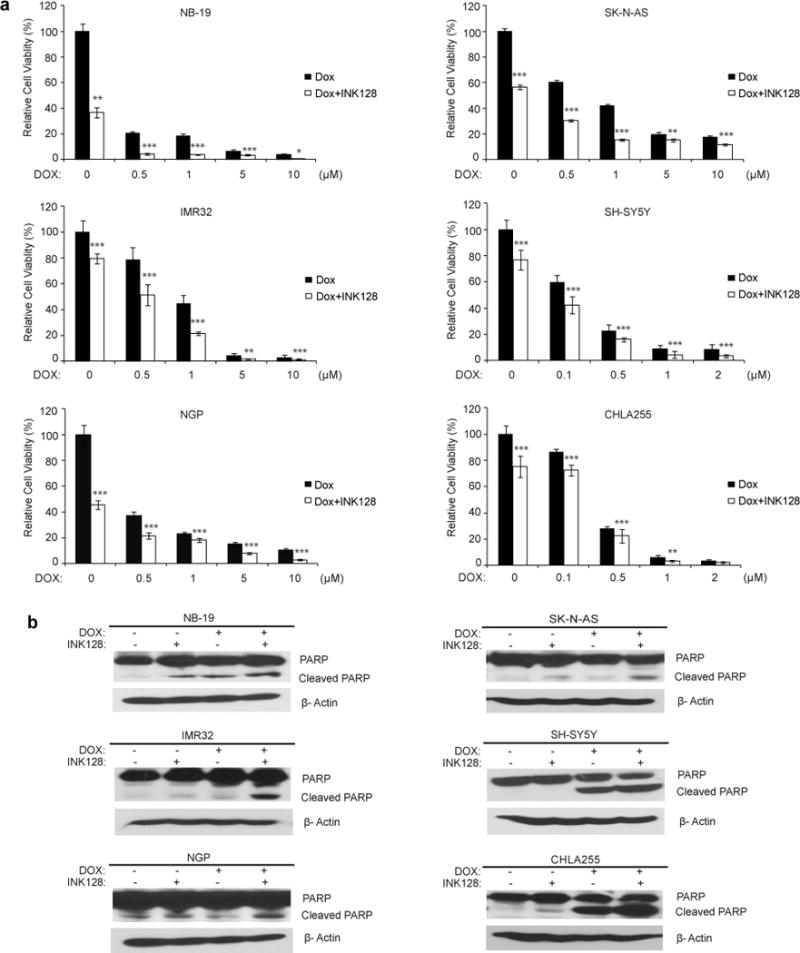
INK128 enhances the cytotoxic effect of Dox on neuroblastoma cell lines. (a) Cells were treated with Dox at the indicated concentrations with or without 0.2 μM INK128 for 48 hrs. The cell viability was then measured by adding 10 μL of CCK-8 and 190 μL of RPMI 1640 and reading the absorbance at 450 nm. Data were represented as mean ± S.D. P values <0.05 (*), <0.01 (**), or <0.001 (***) were indicated. (b) Neuroblastoma cells were treated with INK128 (1 μM) or Dox (1 μM) or their combination for 8 hrs, protein extracts were subjected to SDS-PAGE and immunoblotted with antibodies against PARP to detect the cellular apoptosis. β-Actin was detected as a loading control for whole cell extracts.
mTOR inhibition overcomes established chemoresistance and has a synergistic cytotoxic potency with Dox on chemoresistant LA-N-6 cells
To further examine the cytotoxic potency of INK128 in neuroblastoma, we used a chemoresistant LA-N-6 neuroblastoma cell line. The treatment of INK128 could also reduce the cell viability of LA-N-6 cells in a dose-dependent manner (Supplemental Fig. 3). Consistent with the results from other neuroblastoma cell lines, both anchorage-dependent and independent colony formation of LA-N-6 cells were suppressed by INK128 treatment (Fig. 6a and b). Cell cycle distribution was examined after INK128 treatment. The result showed incubation with INK128 led to cell cycle arrest, with greater percentage of cells in G1-phase (Fig. 6c). INK128 could also induce caspase-3 and PARP cleavage at a low dose compared with Dox alone (Fig. 6d). To further analyze if cell-death of LA-N-6 was caused by the same mechanisms as the other neuroblastoma cell lines, we assessed the activity of the mTOR pathway after INK128 treatment. Dox was used as comparison. Western blot analysis of phospho-4EBP1, phospho-S6 and phospho-Akt suggested that INK128 exhibited a stronger inhibition on mTOR signaling compared to Dox (Fig. 6e). Our previous data demonstrate that INK128 dramatically enhanced efficacy of chemotherapeutic agents in several neuroblastoma cell lines. We then assumed that INK128 might help overcome chemoresistance in neuroblastoma. Based on previous reports, LA-N-6 cells are resistant to a much higher dose of Dox compared to other neuroblastoma cells tested [18, 19]. However, co-culture of LA-N-6 cells with mTOR inhibitor INK128 significantly increased the sensitivity of LA-N-6 cells to Dox (Fig. 6f and g). Moreover, mTOR inhibition significantly increased Dox-induced caspase-3 and PARP cleavages as well as the percentage of PI-staining positive cells (Fig. 6h and i). Taken together, these results indicate that mTOR inhibitor INK128 can significantly enhance chemotherapeutic efficacy and overcome chemoresistance in neuroblastoma cells.
Fig.6.
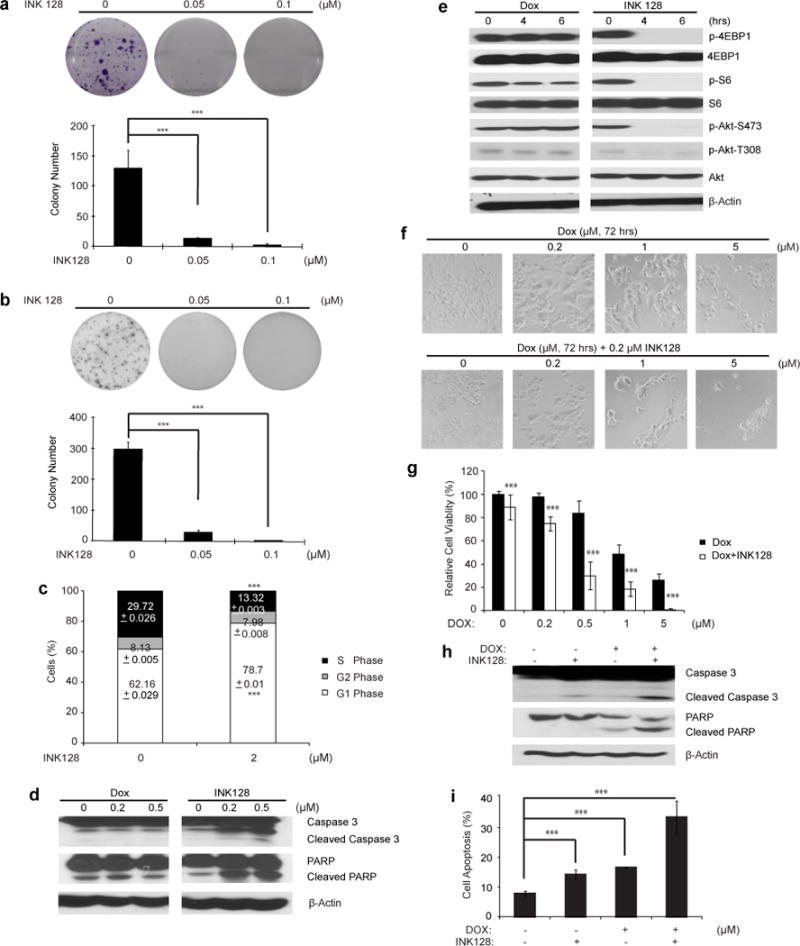
INK128 shows cytotoxic effects on chemoresistant neuroblastoma cell line LA-N-6. (a) LA-N-6 cells were seeded in 6-well plates and treated with indicated concentrations of INK128 for two to three weeks. The colonies formed were fixed, stained with crystal violet dye, and photographed. Colony numbers were represented as mean ± SD. P value <0.001 (***) was indicated. (b) LA-N-6 cells were seeded in 6-well plates with INK128 and agar, and grown for 2 weeks, then stained with MTT for 4 hrs, pictures were taken and colonies were counted. Colony numbers were represented as mean ± SD. P value <0.001 (***) was indicated. (c) LA-N-6 cells were treated with 2 μM INK128 for 36 hrs, after which cells were fixed and incubated in PI solution. Then cells were analyzed by flow cytometry for cell cycle distribution. The results were represented as mean ± SD. P value <0.001 (***) was indicated. (d) LA-N-6 cells was treated with 0 μM, 0.2 μM and 0.5 μM INK128, lysed, subjected to SDS-PAGE and immunoblotted with antibodies against caspase 3 and PARP to detect cellular apoptosis. Dox was used as control at the same concentrations. (e) LA-N-6 cells was treated with 0.2 μM INK128 for 0 h, 4 hrs, and 6 hrs, lysed, subjected to SDS-PAGE and immunoblotted with indicated antibodies. Dox was used as control at the same concentration. (f) LA-N-6 cells were treated with Dox at the indicated concentrations with or without 0.5 μM INK128 for 72 hrs, and cell morphology was captured using optical microscope. (g) LA-N-6 cells were seeded in 96-well plates at a concentration of 2×10⁴/per well. After 24 hrs, cells were incubated with Dox at the indicated concentrations with or without 0.5 μM INK128 for 72 hrs. Cell viability was then measured by adding the mixture of 10 μL of CCK-8 and 190 μL of RPMI 1640 and reading the absorbance at 450 nm. Data were represented as mean ± SD. P value <0.001 (***) was indicated. (h) LA-N-6 cells were treated with INK128 (0.5 μM) or Dox (0.5 μM) or their combination for 24 hrs, protein extracts were subjected to SDS-PAGE and immunoblotted with antibodies against caspase 3 and PARP to detect the cellular apoptosis. β-Actin was detected as a loading control for whole cell extracts. (i) LA-N-6 cells were treated with INK128 (0.5 μM) or Dox (0.5 μM) or their combination for 24 hrs and then examined by flow cytometry using PI staining to label apoptotic cells. The results were represented as mean ± SD. P value <0.001 (***) was indicated.
INK128 shows antitumor efficacy in an orthotopic xenograft mouse model of neuroblastoma
Based on the cytotoxic effect of INK128 on neuroblastoma cells in vitro, we proceeded to assess its efficacy on inhibiting neuroblastoma tumor growth in an orthotopic xenograft mouse model of neuroblastoma. In this set of in vivo experiments, IMR32 cells with stable luciferase gene expression were implanted into the left kidneys of nude mice. At the end of INK128 treatment, the xenograft tumors from both control and treatment groups were dissected and weighed. As expected, we observed a significant tumor regression in the INK128 treatment group (Fig. 7a and b). The resected xenograft tumors were then analyzed for mTORC1/2 activity and their downstream effectors. Using Western blot, INK128 inhibited both mTORC1 and mTORC2 signaling in vivo as indicated by the decrease in the phosphorylation level of downstream effectors. (Fig. 7c) The response of neuroblastoma xenografts to INK128 treatment establishes its potent antitumor efficacy as a single agent in vivo.
Fig.7.
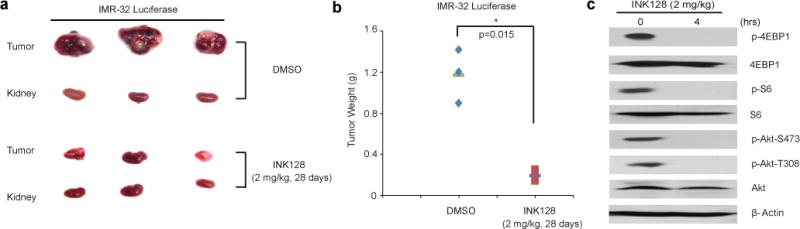
INK128 inhibits neuroblastoma growth in an orthotopic xenograft mouse model. At the end of the indicated treatment periods, (a) IMR32 xenografted tumors and (b) tumor weights from control (N=3) and treatment groups (N=3) were presented. P value <0.05 (*) was indicated. (C) INK128 inhibits mTOR signalings in xenografted tumors. The mice with xenografted tumor for 4 weeks were treated with 2 mg/kg of INK128 for 0 hr and 4 hrs, then xenografted tumor were harvested, lysed, subjected to SDS-PAGE and immunoblotted with indicated antibodies. β-Actin was detected as a loading control for whole cell extracts.
Discussion
mTOR is a cytoplasmic kinase whose activity is often elevated in cancers [20]. mTOR converts signals from activated growth factor receptors into downstream events that are crucial for cell growth, survival, motility, proliferation, protein synthesis and transcription [21]. Frequently activation or deregulation of these pathways through different mechanisms have been reported in human tumors, which makes mTOR an important target for cancer therapy [22]. Previous studies have shown that the PI3K/Akt/mTOR pathway is constitutively activated in neuroblastoma and that mTOR inhibitors targeting key proteins in this pathway may present an approach for the treatment of patients with neuroblastoma [23]. Despite the compelling role of mTOR in cancer aggressiveness and poor prognosis, the first generation of mTOR inhibitors, rapamycin and its derivatives, have had modest to no effect in advanced, relapsed or refractory types of solid cancers [22, 24]. Here we also showed rapamycin demonstrated less of an in vitro effect on neuroblastoma (Supplemental Fig.1 b) This might be attributed to their inability to completely block mTORC1-mediated signaling events, no inhibition on mTORC2, the presence of several feedback loops, and/or the up-regulation of compensatory pathways that promote cell survival and growth [24]. In the last few years, the development of new drugs which block mTOR by a mechanism different from that of rapamycin could represent a useful approach to circumvent the problems associated with rapamycin [25–27]. Small molecules which target the kinase domain of mTOR with an ATP-competitive mechanism should be able to inhibit mTOR both in mTORC1 and mTORC2 and might offer a more complete alternative to rapalogs for the treatment of human cancer. In this study, we investigated the effect of INK128, a more refined mTOR inhibitor, on neuroblastoma growth. INK128 is a potent and selective mTORC1/2 inhibitor which is currently undergoing phase I clinical trials in patients with advanced solid tumors. It showed an IC50 value of 1 nM against mTOR and more than 100 fold selectivity to PI3K kinases [13, 28]. Our results showed that INK128 inhibited both the phosphorylation of p70S6K1 and 4EBP1, the downstream substrates of mTORC1, and the phosphorylation of Akt on Ser473, the downstream substrate of mTORC2 in seven neuroblastoma cell lines. And it is accompanied by decreased cell proliferation, attenuated colony forming ability, as well as G1-phase arrest. Considering the cytostatic activity of INK128 leading to tumor growth retardation, INK128 has the potential to play an important role in future treatment of neuroblastoma patients who are either no longer eligible or not willing to undergo aggressive cytotoxic treatment [29].
In order to meet the high demands of proliferation, cancer cells often have fundamental alterations in nutrient uptake and energy metabolism. A common feature across most cancer types is abnormal glucose metabolism. By switching to glycolysis, cancer cells typically exhibit a high rate of glucose uptake and utilization than their normal counterparts. Unlike in normal cells, glucose is converted to lactate under aerobic conditions in cancer cells, known as the Warburg effect [30]. In cancer cells, a coordinated regulation controlling glycolysis is frequently caused by the action of upstream signaling pathways, including the PI3K/Akt/mTOR pathway, and activation of this pathway results in increased glucose metabolism [15]. So drugs that target mTOR are considered to be promising anticancer agents to control glycolysis. As we expected, INK128 did reduce the glucose uptake and lactate production and further suppress glucose metabolism in neuroblastoma cells. Inhibition of glycolysis and glucose uptake is likely to adversely impact upon cancers more than normal tissues [16, 31]. And it has been reported that combination mTORC1 inhibition with blockade of glycolysis synergistically suppressed glucose uptake and vastly depleted cellular ATP pools, which resulted in a significant enhancement of tumor cell killing [32].
Deregulations in protein synthesis are becoming a hallmark of cancer. High-risk neuroblastoma constitutes a substantial subgroup of neuroblastoma patients, as more than 50% of all neuroblastoma are metastatic at diagnosis and about 20% of all neuroblastoma are MYCN-amplified [1, 33–36]. MYCN is a robust predictor of aggressive biological behavior and is associated with a poor prognosis [1, 33–37]. Given the important role of MYCN expression in high-risk neuroblastoma, the MYCN protein appears to be an attractive candidate for targeted therapy [38]. Some data showed that the degradation of MYCN was a critical downstream effect of the PI3K/mTOR pathway, and other researchers found that INK128 worked better by restraining abnormal protein synthesis when mTOR is hyperactive [38, 39]. In accordance with previous studies, we also found INK128 could reduce the output of MYCN protein in MYCN-amplified neuroblastoma cell lines (Supplemental Fig.3), suggesting mTOR inhibition may leads to destablization of MYCN/MYC proteins in neuroblastoma cells.
Another critical issue frequently raised in the clinical setting is the drug resistance and toxicity to single or combination chemotherapy. The mTOR signaling pathway has been implicated in resistance of multiple anticancer therapies. Many mutations of this pathway in cancer confer survival signals [40, 41]. And several reports revealed that mTOR inhibitors could sensitize tumors to various forms of therapy [41–45]. It is reported that doxorubicin (Dox) elicited additional antitumor activity when administered with rapamycin to animal models of hepatocellular carcinoma [46]. As shown in our study, INK128 also showed a higher inhibitory activity when combined with Dox in neuroblastoma cells. It is possible that combination therapy using INK128 may lower the chemoresistance threshold of neuroblastoma tumor cells and enable less toxicity due to this effect.
In summary, by using a panel of neuroblastoma cell lines and an in vivo orthotopic mouse model of neuroblastoma, we provide compelling evidence that INK128 is able to induce tumor regression as a single agent or in conjunction with chemotherapeutic agents. Therefore, this study suggests that INK128 might serve as a compelling variable in the design of potential clinical trials for refractory neuroblastoma patients. Studies evaluating target-directed therapy such as INK128 for treating neuroblastoma are urgently needed.
Materials and methods
Antibodies and Reagents
mTOR inhibitor INK128 (S2881) was purchased from Selleck. Doxorubicin (Dox, D1515) and anti-β-Actin (A2228) antibodies were purchased from Sigma. Mouse monocolonal anti-MYCN was purchased from Calbiochem. Rabbit monoclonal pSer473 Akt(4060S), rabbit monoclonal pThr308 Akt(4056S), rabbit monocolonal Akt(9272), rabbit monoclonal pSer235/236 S6 ribosomal protain (4858S), rabbit monocolonal S6 ribosomal protain(2217S), rabbit monoclonal pThr37/46 4EBP1(2855S), rabbit monoclonal 4EBP1(9644S), rabbit monoclonal PARP (9532S), rabbit polyclonal caspase 3 (9662S) and anti-Mouse (7076S) or anti-Rabbit (7074S) Ig G were purchased from cell signaling technology.
Cell Culture
The MYCN-amplified (IMR-32, NGP and NB-19), and non-MYCN-amplified (CHLA-255, SK-N-AS and SH-SY5Y) human neuroblastoma cell lines were cultured in RPMI 1640 (Lonza, Walkersville, MD USA) supplemented with 10% (v/v) heat-inactivated Fetal Bovine Serum (FBS, SAFC Biosciences), 100 units/mL penicillin and 100 μg/mL streptomycin. The chemoresistant neuroblastoma cell line LA-N-6 was grown in RPMI1640 containing 20% (v/v) heat-inactivated FBS, 100 units/mL penicillin, and 100 μg/mL streptomycin. All cells were maintained at 37 °C in 5% CO2. All experiments were performed with cells under exponential growth conditions. NB-19 was from Dr. A. Davidoff (St. Jude’s Children’s Hospital) and LA-N-6 was kindly provided by Dr. R. Seeger (Children’s Hospital of Los Angeles).
Cell Viability Assay
Cells were plated and grown in 96-well clear-bottom plates at 104 cells/ well. One day after the cells settled, media was changed and drugs or vehicle was added at the graded concentrations in sextuplicate wells and the cells were then incubated at 37 °C for 48 hrs or 72 hrs. Then a mixture of 10 μL CCK-8 (Dojindo Laboratories) and 190 μL RPMI 1640 with 10% FBS was added into each well. After 1 hr of incubation, luminescence was measured at 450 nm using a microplate reader. Background reading of the media was subtracted from each well to standardize the results.
Cell Imaging
A total of seven neuroblastoma cell lines were seeded in 12-well plates respectively at appropriate concentrations, 48 hrs or 72 hrs after treatments with indicated concentrations of INK128, Dox or combination of the two drugs, cell morphologies were observed and captured by using the optical microscope. Each result was performed in triplicate.
Colony Forming Assay
For clonogenic assay, 1×10³ cells were seeded into 6-well tissue culture plates and allowed to settle for 24 hrs. Then treatment of different concentrations of INK128 was applied to the cells. Three weeks later, the colonies generated were fixed with methonal for 10 min, stained with 0.05% crystal violet dye for 10 min, washed twice with tap water, and air dried overnight. The plates were then photographed and the colonies were counted. Each result was performed in triplicate.
For the soft agar assay, 5% (w/v) base agar layer was made by adding agar (214220, Difco Laboratories) into distilled water, this mixture were autoclaved for 50 min then cooled in water bath to 56 °C. This solution was then mixed with RPMI 1640 with 10% FBS to a final concentration of 0.5%. The bottom agar was made by adding 2 mL of agar/RPMI solution each well and cooling until semi-solid. To make the top agar layer, base agar was diluted with RPMI 1640 with 10% FBS to 0.3%. Each neuroblastoma cell line was trypsinized, counted and added to the mixture at 1×10⁴/ well along with graded concentrations of INK128. After mixing, 1.5 mL of mixture was added to the top of each bottom agar layer. Cells were grown at 37 °C for 2 to 3 weeks, then stained with 500 μL of 5 mg/mL Thiazolyl Blue Tetrazolium Bromide (MTT, M5655, sigma). Pictures were captured by the microscope and colonies were counted after 4 hrs. Each result was performed in triplicate.
Protein Immunoblotting
After each treatment, cells were washed twice with ice cold PBS and then lysed on rotator in 4 °C for 30 min in cooled RIPA buffer (50 mM Tris-HCl at pH 7.4, 150 mM NaCl, 1 mM EDTA, 1% NP-40, 0.25% sodium deoxycholate, 1 mM phenylmethylsulfonyl fluoride, 1 mM benzamidine, 10 μg/mL leupeptin, 1 mM dithiothreitol, 50 mM sodium fluoride, 0.1 mM sodium orthovanadate, and phosphatase inhibitor cocktail 2 and 3 (p5726 and p0044, Sigma)). After centrifuging at 13,000 rpm for 15 min, supernatants were used as cell lysates. Protein concentrations were measured using Bradford reagent (BioRad), and each samples were mixed 3:1 with 4× loading buffer and heated to 100 °C for 5 min. Lysates were then separated by SDS-PAGE, transferred to polyvinylidence fluoride (PVDF) membranes (BioRad), blocked with 5% milk or BSA for 1 hr at RT (25°C) and probed with appropriate dilutions of indicated primary antibodies overnight at 4 °C. The membranes were incubated with anti-mouse or rabbit IgG conjugated with horseradish peroxidase at RT for 1hr, then ECL-Plus Western detection system (GE Health Care, Buckinghamshire, UK) was used for chemiluminescent visualization. β-Actin and the full-length protein (for all phosphorylated proteins) were used to ensure equal protein loading.
Cell Cycle Analysis
Cells were cultured as described above and treated with INK128 (2 μM) for 36 hrs. Then cells were washed with ice cold PBS, centrifuged for 5 min at 500 g, and the pellet was resuspended in 200 μL of PBS/0.1% FBS using a small tip pipette. Four milliliters of ice cold 70% ethanol was added to the cells drop wise. The fixed cells were then incubated overnight at 4°C. Next day, the cell pellet was then incubated in 1mL of propidium iodide (PI) solution (50 μg/mL PI (Biotium) and 100 μg/mL RNaseA) at 37 °C for 1 hr. We then filtered the cells through a 40–70 μm mesh prior to analysis. The samples were analyzed using flow cytometry within 1 hr. The results were analyzed using software (FCSExpress 4 Flow Research Edition) to determine the distribution of different cell cycle phases.
Apoptosis Assay by Flow Cytometry
LA-N-6 cells were planted in 10 cm dishes and allowed to settle, then treated with 0.5 μM INK128, 0.5 μM Dox and combination of the two for 24 hrs. After that cells were collected and washed with ice cold PBS twice, and resuspended at a density of 1×10⁶ cells/ mL in ice cold PBS. One milliliter was transferred into a new tube and 5 μL of 50 μg/mL PI staining solution was added. The tubes were gently mixed and incubated for 15 min at RT in dark conditions. The samples were then analyzed using flow cytometry within 1 hr. Unstained cells were used as negative control.
Glucose Uptake Assay
A glucose uptake assay was performed essentially as described in the instructions from the Glucose Assay Kit (MBL, MA, USA). Briefly, cells were seeded in RPMI-1640 containing 10% FBS and 25 mM of glucose overnight. The cells were then starved by placing them in medium without glucose or FBS, after 16 hrs, the medium was changed back to the original one and 5μM INK128 was added into the medium for 0 hr, 4 hrs and 6 hrs separately. Medium and cells were collected separately for the glucose uptake assay and protein estimation. Fluorescence values were normalized based on protein estimation data and were presented as fold change.
Lactate Production Assay
For assessment of lactate production, the cells were seeded in a similar manner and medium was collected and diluted 1:50 in lactate assay buffer. The amount of lactate presented in the medium was then estimated using the Lactate Assay Kit (MBL, MA, USA) according to the manufacturer’s instructions. The amount of lactate produced by the cells in each sample was calculated by subtracting the amount of lactate in the medium (without cells) from the amount of lactate in the medium from each sample.
Antitumor Efficacy in an Orthotopic Mouse Model of Neuroblastoma
Five to six-week-old female athymic Ncr nude mice were purchased from Taconic (Taconic, Hudson, NY, USA) and maintained under barrier conditions (pathogen-free conditions provided by plastic cages with sealed air filters). The preclinical mouse model of neuroblastoma was established using orthotopic (intrarenal) implantation of the neuroblastoma cells as described previously [47, 48]. Briefly, an transverse incision was created over the left flank of the nude mouse, exposing the left kidney. An inoculum of 3×10⁶ luciferase-transduced IMR32 cells in 0.1 ml of PBS was injected towards the superior pole of the left kidneys of mice with a 25-g needle. The flank muscles were closed with a single 4–0 Polysorb suture (US Surgical, Norwalk, CT) and the skin closed with staples. After allowing them to engraft for 2 to 3 weeks, mice bearing tumors with similar sizes (using bioluminescent imaging to monitor tumor growth) were randomly divided into two groups: DMSO control group and INK128 treatment group (2 mg/kg by intraperitoneal (i.p.) injection once daily for 28 days or 2 mg/kg by intraperitoneal (i.p.) injection for 4 hrs). Both control and experimental groups included 3 mice. At the end of the treatment, all mice were sacrificed. Tumors and the right kidneys (control) were harvested, weighed, photographed and lysed for western blotting. All mice were handled according to protocols approved by Institutional Animal Care and Use Committee of Baylor College of Medicine.
Statistical Analysis
All values were presented as mean ± standard deviation (SD). A P<0.05 was considered to be statistically significant. A two-tailed Student’s t-test was used to analyze the difference between in vitro drug treatment group and control group and to compare tumor sizes between two groups of xenografted neuroblastoma mice.
Each assay was repeated at least twice and representative results were presented.
Supplementary Material
Acknowledgments
We appreciate Dr. Andrew Davidoff (St. Judes’s Children’s Research Hospital, Memphis, TN, USA) and Dr. Robert Seeger (Children’s Hospital of Los Angeles, Los Angeles, CA, USA) for providing the neuroblastoma cell lines described in this paper. This work was supported by the NIH/NINDS grants 1R01NS072420 (J.Y.) and 1R21NS085467 (J.Y.). Jin Cheng is a recipient of China Scholarship Council training grant.
Footnotes
Conflict of interest: The authors declare no conflict of interest.
References
- 1.Brodeur GM. Neuroblastoma: biological insights into a clinical enigma. Nature Reviews Cancer. 2003;3:203–216. doi: 10.1038/nrc1014. [DOI] [PubMed] [Google Scholar]
- 2.Schwab M, Westermann F, Hero B, Berthold F. Neuroblastoma: biology and molecular and chromosomal pathology. The lancet oncology. 2003;4:472–480. doi: 10.1016/s1470-2045(03)01166-5. [DOI] [PubMed] [Google Scholar]
- 3.Jacinto E, Hall MN. Tor signalling in bugs, brain and brawn. Nature Reviews Molecular Cell Biology. 2003;4:117–126. doi: 10.1038/nrm1018. [DOI] [PubMed] [Google Scholar]
- 4.Hsieh AC, Costa M, Zollo O, Davis C, Feldman ME, Testa JR, et al. Genetic dissection of the oncogenic mTOR pathway reveals druggable addiction to translational control via 4EBP-eIF4E. Cancer Cell. 2010;17:249–261. doi: 10.1016/j.ccr.2010.01.021. [DOI] [PMC free article] [PubMed] [Google Scholar]
- 5.Li J, Xue L, Hao H, Han Y, Yang J, Luo J. Rapamycin provides a therapeutic option through inhibition of mTOR signaling in chronic myelogenous leukemia. Oncology Reports. 2012;27:461–466. doi: 10.3892/or.2011.1502. [DOI] [PubMed] [Google Scholar]
- 6.Hirase C, Maeda Y, Takai S, Kanamaru A. Hypersensitivity of Ph-positive lymphoid cell lines to rapamycin: Possible clinical application of mTOR inhibitor. Leukemia Research. 2009;33:450–459. doi: 10.1016/j.leukres.2008.07.023. [DOI] [PubMed] [Google Scholar]
- 7.Glienke W, Maute L, Wicht J, Bergmann L. The dual PI3K/mTOR inhibitor NVP-BGT226 induces cell cycle arrest and regulates Survivin gene expression in human pancreatic cancer cell lines. Tumour Biology. 2012;33:757–765. doi: 10.1007/s13277-011-0290-2. [DOI] [PubMed] [Google Scholar]
- 8.Dowling RJ, Topisirovic I, Fonseca BD, Sonenberg N. Dissecting the role of mTOR: lessons from mTOR inhibitors. Biochimica et biophysica acta. 2010;1804:433–439. doi: 10.1016/j.bbapap.2009.12.001. [DOI] [PubMed] [Google Scholar]
- 9.Shor B, Gibbons JJ, Abraham RT, Yu K. Targeting mTOR globally in cancer: thinking beyond rapamycin. Cell Cycle. 2009;8:3831–3837. doi: 10.4161/cc.8.23.10070. [DOI] [PubMed] [Google Scholar]
- 10.Sparks CA, Guertin DA. Targeting mTOR: prospects for mTOR complex 2 inhibitors in cancer therapy. Oncogene. 2010;29:3733–3744. doi: 10.1038/onc.2010.139. [DOI] [PMC free article] [PubMed] [Google Scholar]
- 11.Foster DA, Toschi A. Targeting mTOR with rapamycin: one dose does not fit all. Cell Cycle. 2009;8:1026–1029. doi: 10.4161/cc.8.7.8044. [DOI] [PMC free article] [PubMed] [Google Scholar]
- 12.Johnsen JI, Segerstrom L, Orrego A, Elfman L, Henriksson M, Kågedal B, et al. Inhibitors of mammalian target of rapamycin downregulate MYCN protein expression and inhibit neuroblastoma growth in vitro and in vivo. Oncogene. 2008;27:2910–2922. doi: 10.1038/sj.onc.1210938. [DOI] [PubMed] [Google Scholar]
- 13.Schenone S, Brullo C, Musumeci F, Radi M, Botta M. ATP-competitive inhibitors of mTOR: an update. Current medicinal chemistry. 2011;18:2995–3014. doi: 10.2174/092986711796391651. [DOI] [PubMed] [Google Scholar]
- 14.Lou H, Dean M. Targeted therapy for cancer stem cells: the patched pathway and ABC transporters. Oncogene. 2007;26:1357–1360. doi: 10.1038/sj.onc.1210200. [DOI] [PubMed] [Google Scholar]
- 15.Glunde K, Jiang L, Moestue SA, Gribbestad IS. MRS and MRSI guidance in molecular medicine: targeting and monitoring of choline and glucose metabolism in cancer. NMR in biomedicine. 2011;24:673–690. doi: 10.1002/nbm.1751. [DOI] [PMC free article] [PubMed] [Google Scholar]
- 16.Mathupala SP, Ko YH, Pedersen PL. Hexokinase II: cancer’s double-edged sword acting as both facilitator and gatekeeper of malignancy when bound to mitochondria. Oncogene. 2006;25:4777–4786. doi: 10.1038/sj.onc.1209603. [DOI] [PMC free article] [PubMed] [Google Scholar]
- 17.Dazert E, Hall MN. mTOR signaling in disease. Current opinion in cell biology. 2011;23:744–755. doi: 10.1016/j.ceb.2011.09.003. [DOI] [PubMed] [Google Scholar]
- 18.Fan YH, Cheng J, Vasudevan SA, Dou J, Zhang H, Ratal RH, et al. USP7 inhibitor P22077 inhibits neuroblastoma growth via inducing p53-mediated apoptosis. Cell death & disease. 2013;4:e867. doi: 10.1038/cddis.2013.400. [DOI] [PMC free article] [PubMed] [Google Scholar]
- 19.Cheng J, Fan YH, Xu X, Zhang H, Dou J, Tang Y, et al. A small-molecule inhibitor of UBE2N induces neuroblastoma cell death via activation of p53 and JNK pathways. Cell death & disease. 2014;5:e1079. doi: 10.1038/cddis.2014.54. [DOI] [PMC free article] [PubMed] [Google Scholar]
- 20.Maki CG. Decision-making by p53 and mTOR. Aging. 2010;2:324–326. doi: 10.18632/aging.100166. [DOI] [PMC free article] [PubMed] [Google Scholar]
- 21.Zhou H, Huang S. mTOR signaling in cancer cell motility and tumor metastasis. Critical reviews in eukaryotic gene expression. 2010;20:1–16. doi: 10.1615/critreveukargeneexpr.v20.i1.10. [DOI] [PMC free article] [PubMed] [Google Scholar]
- 22.Wan X, Helman LJ. The biology behind mTOR inhibition in sarcoma. The oncologist. 2007;12:1007–1018. doi: 10.1634/theoncologist.12-8-1007. [DOI] [PubMed] [Google Scholar]
- 23.Berry T, Luther W, Bhatnagar N, Jamin Y, Poon E, Sanda T, et al. The ALK (F1174L) mutation potentiates the oncogenic activity of MYCN in neuroblastoma. Cancer Cell. 2012;22:117–130. doi: 10.1016/j.ccr.2012.06.001. [DOI] [PMC free article] [PubMed] [Google Scholar]
- 24.Li J, Kim SG, Blenis J. Rapamycin: one drug, many effects. Cell metabolism. 2014;19:373–379. doi: 10.1016/j.cmet.2014.01.001. [DOI] [PMC free article] [PubMed] [Google Scholar]
- 25.Richard DJ, Verheijen JC, Zask A. Recent advances in the development of selective, ATP-competitive inhibitors of mTOR. Current opinion in drug discovery & development. 2010;13:428–440. [PubMed] [Google Scholar]
- 26.Garcia-Echeverria C. Allosteric and ATP-competitive kinase inhibitors of mTOR for cancer treatment. Bioorganic & medicinal chemistry letters. 2010;20:4308–4312. doi: 10.1016/j.bmcl.2010.05.099. [DOI] [PubMed] [Google Scholar]
- 27.Albert S, Serova M, Dreyer C, Sablin MP, Faivre S, Raymond E. New inhibitors of the mammalian target of rapamycin signaling pathway for cancer. Expert opinion on investigational drugs. 2010;19:919–930. doi: 10.1517/13543784.2010.499121. [DOI] [PubMed] [Google Scholar]
- 28.Janes MR, Vu C, Mallya S, et al. Efficacy of the investigational mTOR kinase inhibitor MLN0128/INK128 in models of B-cell acute lymphoblastic leukemia. Leukemia. 2013;27:586–594. doi: 10.1038/leu.2012.276. [DOI] [PMC free article] [PubMed] [Google Scholar]
- 29.Wacheck V. mTOR pathway inhibitors in cancer therapy: moving past rapamycin. Pharmacogenomics. 2010;11:1189–1191. doi: 10.2217/pgs.10.113. [DOI] [PubMed] [Google Scholar]
- 30.Warburg O. On respiratory impairment in cancer cells. Science. 1956;124:269–270. [PubMed] [Google Scholar]
- 31.Fantin VR, St-Pierre J, Leder P. Attenuation of LDH-A expression uncovers a link between glycolysis, mitochondrial physiology, and tumor maintenance. Cancer Cell. 2006;9:425–434. doi: 10.1016/j.ccr.2006.04.023. [DOI] [PubMed] [Google Scholar]
- 32.Xu RH, Pelicano H, Zhang H, Giles FJ, Keating MJ, Huang P. Synergistic effect of targeting mTOR by rapamycin and depleting ATP by inhibition of glycolysis in lymphoma and leukemia cells. Leukemia. 2005;19:2153–2158. doi: 10.1038/sj.leu.2403968. [DOI] [PubMed] [Google Scholar]
- 33.Das A, Banik NL, Ray SK. Retinoids induce differentiation and downregulate telomerase activity and N-Myc to increase sensitivity to flavonoids for apoptosis in human malignant neuroblastoma SH-SY5Y cells. International Journal of Oncology. 2009;34:757–765. doi: 10.3892/ijo_00000201. [DOI] [PMC free article] [PubMed] [Google Scholar]
- 34.Prochazka P, Hrabeta J, Vicha A, Cipro S, Stejskalova E, Musil Z, et al. Changes in MYCN expression in human neuroblastoma cell lines following cisplatin treatment may not be related to MYCN copy numbers. Oncology Reports. 2013;29:2415–2421. doi: 10.3892/or.2013.2383. [DOI] [PubMed] [Google Scholar]
- 35.Calero R, Morchon E, Johnsen JI, Serrano R. Sunitinib suppress neuroblastoma growth through degradation of MYCN and inhibition of angiogenesis. PLoS One. 2014;9:e95628. doi: 10.1371/journal.pone.0095628. [DOI] [PMC free article] [PubMed] [Google Scholar]
- 36.Kushner BH, Modak S, Kramer K, LaQuaglia MP, Yataghene K, Basu EM, et al. Striking dichotomy in outcome of MYCN-amplified neuroblastoma in the contemporary era. Cancer. 2014;120:2050–2059. doi: 10.1002/cncr.28687. [DOI] [PMC free article] [PubMed] [Google Scholar]
- 37.Modak S, Cheung NK. Neuroblastoma: Therapeutic strategies for a clinical enigma. Cancer treatment reviews. 2010;36:307–317. doi: 10.1016/j.ctrv.2010.02.006. [DOI] [PubMed] [Google Scholar]
- 38.Gustafson WC, Weiss WA. Myc proteins as therapeutic targets. Oncogene. 2010;29:1249–1259. doi: 10.1038/onc.2009.512. [DOI] [PMC free article] [PubMed] [Google Scholar]
- 39.Fulda S. The PI3K/Akt/mTOR pathway as therapeutic target in neuroblastoma. Current cancer drug targets. 2009;9:729–737. doi: 10.2174/156800909789271521. [DOI] [PubMed] [Google Scholar]
- 40.Burris HA., 3rd Overcoming acquired resistance to anticancer therapy: focus on the PI3K/AKT/mTOR pathway. Cancer Chemotherapy and Pharmacology. 2013;71:829–842. doi: 10.1007/s00280-012-2043-3. [DOI] [PubMed] [Google Scholar]
- 41.Liu H, Scholz C, Zang C, Schefe JH, Habbel P, Regierer AC, et al. Metformin and the mTOR inhibitor everolimus (RAD001) sensitize breast cancer cells to the cytotoxic effect of chemotherapeutic drugs in vitro. Anticancer Research. 2012;32:1627–1637. [PubMed] [Google Scholar]
- 42.Wang ZG, Fukazawa T, Nishikawa T, Watanabe N, Sakurama K, Motoki T, et al. RAD001 offers a therapeutic intervention through inhibition of mTOR as a potential strategy for esophageal cancer. Oncology reports. 2010;23:1167–1172. [PubMed] [Google Scholar]
- 43.Mishra R, Miyamoto M, Yoshioka T, Ishikawa K, Matsumura Y, Shoji Y, et al. Adenovirus-mediated eukaryotic initiation factor 4E binding protein-1 in combination with rapamycin inhibits tumor growth of pancreatic ductal adenocarcinoma in vivo. International journal of oncology. 2009;34:1231–1240. [PubMed] [Google Scholar]
- 44.Johnston PB, Inwards DJ, Colgan JP, Laplant BR, Kabat BF, Habermann TM, et al. A Phase II trial of the oral mTOR inhibitor everolimus in relapsed Hodgkin lymphoma. American journal of ematology. 2010;85:320–324. doi: 10.1002/ajh.21664. [DOI] [PMC free article] [PubMed] [Google Scholar]
- 45.Nagai T, Ohmine K, Fujiwara S, Uesawa M, Sakurai C, Ozawa K. Combination of tipifarnib and rapamycin synergistically inhibits the growth of leukemia cells and overcomes resistance to ipifarnib via alteration of cellular signaling pathways. Leukemia Research. 2010;34:1057–1063. doi: 10.1016/j.leukres.2009.12.011. [DOI] [PubMed] [Google Scholar]
- 46.Piguet AC, Semela D, Keogh A, Wilkens L, Stroka D, Stoupis C, et al. Inhibition of mTOR in combination with doxorubicin in an experimental model of hepatocellular carcinoma. Journal of hepatology. 2008;49:78–87. doi: 10.1016/j.jhep.2008.03.024. [DOI] [PubMed] [Google Scholar]
- 47.Kim ES, Serur A, Huang J, Manley CA, McCrudden KW, Frischer JS, et al. Potent VEGF blockade causes regression of coopted vessels in a model of neuroblastoma. Proceedings of the National Academy of Sciences of the United States of America. 2002;99:11399–11404. doi: 10.1073/pnas.172398399. [DOI] [PMC free article] [PubMed] [Google Scholar]
- 48.Patterson DM, Shohet JM, Kim ES. Preclinical models of pediatric solid tumors (neuroblastoma) and their use in drug discovery. Current Protocols in Pharmacology. 2011:14.17.1–14.17.18. doi: 10.1002/0471141755.ph1417s52. [DOI] [PubMed] [Google Scholar]
Associated Data
This section collects any data citations, data availability statements, or supplementary materials included in this article.