Abstract
In this study, Acoustic Radiation Force Impulse (ARFI) and Shear Wave Elasticity Imaging (SWEI) were applied to the skin to investigate the feasibility of their use in assessing sclerotic skin diseases. Our motivation was to develop a non-invasive imaging technology with real-time feedback of sclerotic skin disease diagnosis. This paper shows representative results from an ongoing study recruiting subjects with and without sclerosis. The stiffness of the imaged site was evaluated using two metrics: mean ARFI displacement magnitude and bulk shear wave speed inside the region of interest (ROI). In a subject with localized Graft versus Host Disease (GVHD), the mean ARFI displacement inside sclerotic skin was 61% lower (p<0.01) and shear wave speed 128% higher (p<0.005) compared to those in normal skin— indicating stiffer mechanical properties in the sclerotic skin. This trend persisted through disease types. We conclude ARFI and SWEI can successfully differentiate sclerotic lesions from normal dermis.
Keywords: Acoustic Radiation Force, Shear Wave Speed, Acoustic Radiation Force Impulse (ARFI) Imaging, Cutaneous Sclerotic Diseases
Introduction
ARFI/SWEI
Acoustic Radiation Force Impulse Imaging (ARFI) and Shear Wave Elasticity Imaging (SWEI) are ultrasound-based non-invasive imaging techniques used to assess the underlying stiffness of soft tissues. These techniques have been employed to assess the mechanical elasticity of various organs of different shapes and sizes. Previous studies showed promising results in evaluating liver fibrosis (Palmeri et al., 2011, Bavu et al., 2011, Nierhoff et al., 2013, Sporea et al., 2013 and Zhang et al., 2014), breast lesions (Meng et al., 2011), vascular plaques (Doherty et al., 2012), prostate cancers (Zhai et al., 2012 and Correas et al., 2013), and muscle anisotropy(Gennisson et al., 2010). Other organs where ARFI and SWEI have been explored include the bladder (Nenadic et al., 2013), cervix (Feltovich et al., 2012), and cornea (Tanter et al., 2009). Recent commercialization of ARFI/SWEI modes in various ultrasound clinical systems such as Siemens ACUSON S2000™, Supersonic Imagine’s Aixplorer, and Philip’s iU22 scanners support their clinical success in the context of hepatic fibrosis staging and lesion characterization and furthermore, indicates a more widespread clinical use in the near future. Some studies have used SWEI to assess skin elasticity and have concluded that shear wave speeds in the skin correlated well to underlying stiffness (Gennisson et al., 2004) and disease pathology of systemic sclerosis (Santiago et al., 2014 and Hou et al., 2015). Nonetheless, there has not yet been a clinical effort exploring both ARFI and SWEI in the skin to examine other cutaneous sclerosis diseases or to investigate the feasibility of longitudinal monitoring.
Both ARFI and SWEI techiniques use acoustic radiation force (ARF) to induce micron-level displacement around the beam focus, also known as the “push,” and track the transient response of the tissue to evaluate the stiffness. Modeling the tissue as a viscous fluid under ultrasonic wave propagation, ARF (F) is related to acoustic absorption (α), speed of sound inside the tissue (c), and temporal average intensity of the acoustic pulse (1) as shown by the equation derived by Nyborg under plane wave assumptions (Nyborg, 1965):
| [1] |
ARFI tracks the on-axis displacement, in the region of excitation, and uses the displacement magnitude at a given time after excitation to characterize the stiffness (Nightingale et al, 2002). Because force magnitude depends not only on tissue stiffness but also on attenuation, the displacement magnitude is not directly correlated with the material stiffness, but rather is indicative of the stiffness relative to the surrounding tissue. On the other hand, SWEI tracks the displacement off-axis, a known distance away from the location of the push, to compute the propagation speed of the transverse wave.
For plate-like media, the plate thickness introduces a frequency dependence of the transverse wave, and a Lamb wave model is generally used to convert the measured wave propagation speed to shear and elastic moduli. Under the assumption that the tissue is linear, isotropic and elastic, the transverse wave speed CT of an anti-symmetric (A0) Lamb wave can be found from the measured phase velocity C(ω) using equation [2] where ω is the angular frequency and h is the plate thickness (Royer et al, 1996).
| [2] |
Then, the shear wave speed (CT) can be related to the shear and Young’s moduli (µ and E , respectively) by relations [3] and [4],
| [3] |
| [4] |
where ρ is the tissue density and v is the Poisson’s ratio (Lai et al, 1999). Soft tissues are generally considered homogeneous and incompressible with a Poisson’s ratio of 0.5; therefore, equation [4] can be simplified to µ=E/3 for many clinical purposes. For example, studies done by Nenadic et al. (2013) and Tanter et al. (2009) use Lamb wave and leaky Lamb wave models to describe the bladder wall and the cornea respectively as thin plate-like media surrounded by fluid. Although dermis is a thin layer, its boundary conditions are more complicated than a simple plate in that it is free on one side and bounded to subcutaneous tissue on the other. For this reason, we do not attempt to extend our measured SWS to elastic moduli through simplifying assumptions. However, the fact remains that higher velocity indicates greater underlying stiffness when all other structural conditions are equal. As such, we report SWS herein as an absolute indicator of dermal stiffness when comparing metrics taken from symmetrical sites of a given patient.
Since both ARFI and SWEI are designed to characterize tissue stiffness, ARFI displacement estimates and SWEI-derived SWS estimates should be correlated. A previous phantom study has shown strong correlation of SWS and ARFI displacement magnitude with an R2 value of 0.87, high SWS corresponding to low ARFI displacement and vice versa (Rosenzweig et al., 2012); both metrics are valid indicators of tissue stiffness. In this study, we compare their performance in the characterization of dermal stiffness.
Sclerotic Cutaneous skin Diseases
Immunologic disorders such as morphea and sclerotic GVHD are associated with progressive sclerosis or thickening and scarring of the skin. These conditions are histologically characterized by increased fibrosis and collagen hyalinization in the dermis and deeper soft tissue (Shulman et al., 2006). This altered quality and organization of dermal collagen is thought to significantly contribute to the abnormal mechanical properties of the tissue. In addition, extensive progression of these diseases causes significant pain and restriction of motion which is often treated with aggressive immunosuppressive therapy which significantly worsens quality of life due to major side effects including immunodeficiency (Arai et al., 2011). There is an unmet need for a reliable measure to quantify disease severity in both the clinical and research setting to quantify the inflammatory and sclerotic features of cutaneous lesions. Development of these tools will help determine the optimal treatment regimen, minimizing both disease and treatment associated with morbidity and mortality.
According to Edwards and Marks (1995), evaluating the stiffness of the skin has been challenging due to its thin nature and complicated surrounding structures, including subcutaneous fat, muscle, and bone. Although popular in vivo methods to measure skin stiffness include indentometry, which uses a durometer, and dynamic suction methods that measure the height of the raised skin, these metrics are heavily operator and equipment dependent, and they are known to be effective only in certain areas of the body (Edwards and Marks, 1995). The difficulty to measure skin stiffness comes from the fact that only the outer boundary of the skin is visible, and therefore, its biomechanical property cannot be directly measured without biopsy. Furthermore, there is not any analytical model that relates the in vivo results to basic skin properties (Edwards and Marks, 1995). Skin stiffness can be measured ex vivo but excising the skin changes the boundary condition, and the surrounding conditions, including temperature and hydration state.
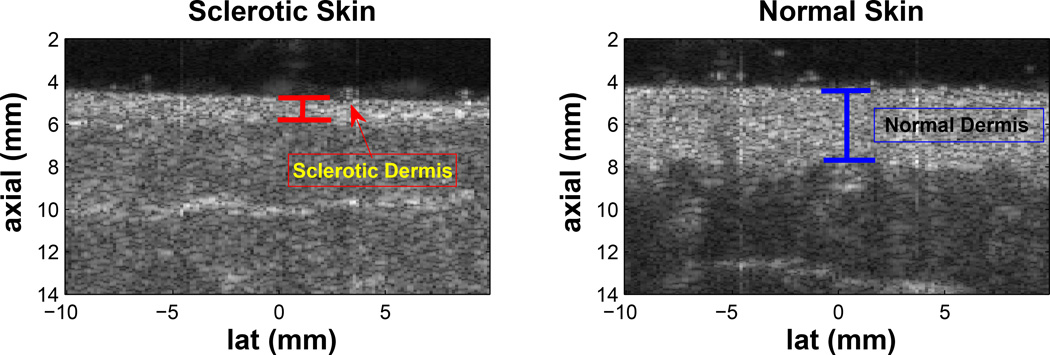
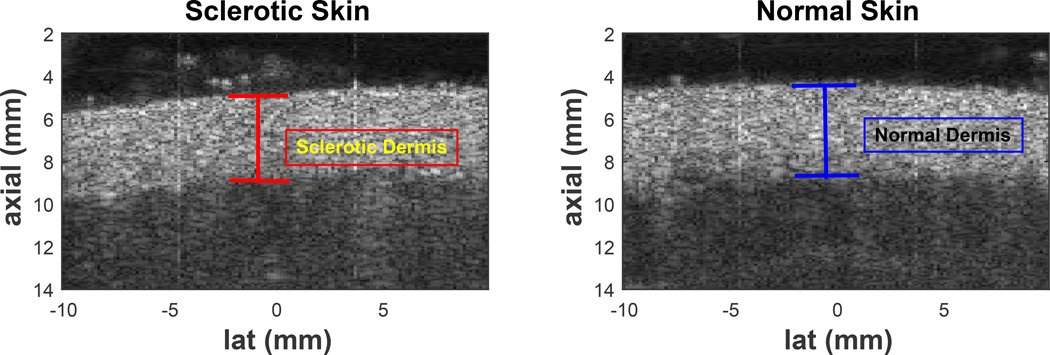
Although there are several scoring systems and imaging devices proposed and currently being used to clinically assess the severity of these diseases, none of them have yet proven to be effective enough to accurately diagnose or predict outcome. The Localized Scleroderma Cutaneous Assessment Tool (LoSCAT) is a recently developed clinical tool for the assessment of morphea, including modified Localized Skin Severity Index (mLoSSI) and Localized Scleroderma Damage Index (LoSDI) measuring disease activity and damage respectively (Kelsey and Torok, 2013). Unfortunately, these metrics are subject to operator judgment and further validation is required to determine its utility in monitoring disease progression both in clinical trials and actual practice (Arkachaisri et al., 2010). The skin specific 2005 NIH Consensus Score for the chronic GVHD showed significance only when compared to other outcome measurements and also incorporated measures such as the physician and patient perception of change and overall mortality (Arai et al., 2011). Cutaneous sclerosis that is accompanied by atrophy, inflammation, and extensive scarring of the subcutaneous tissue, can be effectively seen as thinner or thicker than normal dermis and hyper-echoic subcutaneous layer using 14–50 MHz high frequency B-mode imaging (Nezafati et al., 2011) (Figure 1); however, often sclerosis does not deform the skin in ways visible by B-mode imaging (Figure 2) and moreover, B-mode images does not measure tissue stiffness.
Figure 1.
The left and right plots are B-mode images of sclerotic and contralateral normal upper back sites from a study subject. When sclerosis is accompanied by atrophy, disease severity can be indicated by the change in thickness of the dermis; however, normal B-mode images do not provide any information on stiffness changes.
Figure 2.
The left and right plots are B-mode images of sclerotic and contralateral normal upper back sites from a study subject. Atrophy can often not occur in sclerosis, making B-mode imaging alone not useful in characterizing sclerosis.
In this paper, we employed ARFI/SWEI technology to characterize sclerotic changes in the skin by simultaneously measuring the tissue thickness as well as the stiffness. Imaging parameters were customized to best evaluate the elasticity of the skin, which is thin and superficial. To properly assess the effect of sclerosis on the change of dermal stiffness, we imaged not only the sclerotic sites but also the normal contralateral sites as controls. We further imposed valid measurement criteria in all acquisitions as described below.
Methods
Imaging Sequence Parameters
The aim of this study was to design custom sequences and to perform elasticity measurements to assess the clinical feasibility of ARFI/SWEI measurements in skin with and without diseases, and to determine which method has the most potential for aiding in the diagnosis of sclerotic skin diseases. Using a modified Siemens Medical Solutions ACUSON S2000™ scanner and the Siemens 14L5 linear array transducer (Siemens Medical Ultrasound Business Division, Mountain View CA), a custom imaging sequence was generated with the parameters shown in Table 1. Harmonic tracking was used to improve B-mode image quality with reduced clutter noise and higher resolution (Tranquart et al., 1999 and Doherty et al., 2013), using a pulse inversion technique that gives better SNR than the filter-based approach (Ma et al., 2005 and Doherty et al., 2013).
Table 1.
Imaging Parameters for ARFI and SWEI (note: due to image quality challenges, parallel receive beamforming was not employed.)
| ARFI Push | Tracking TX | Tracking Rx | |
|---|---|---|---|
| Frequency | 7.27 MHz | 6.15 MHz | 12.3 MHz |
| Focal Depth | 5.5 mm | 5.5 mm | Dynamic Receive |
| # Cycles | 500 | 2 | NA |
| F-number | 1 | 1 | 1 |
| PRF | NA | 8.87 kHz | |
| Beam Spacing | NA | 0.3 mm (ARFI) 0.9 mm (SWEI) |
|
| Lateral FOV | NA | 7.2mm | |
| Parallel Receive | NA | 1:1 | |
| Track Duration | NA | 5.7ms | |
The transmit pulse was inverted every other frame for displacement tracking. After acquisition, each positive and negative pair was summed for harmonic imaging to create high-resolution B-modes that accurately resolve the skin. By summing not only the subsequent (+, −) pairs but also the (−,+) pairs, the original transmit PRF was preserved as described in Doherty et al (2013).
Imaging methods
Imaging has been performed in 22 patient volunteers to date through the Department of Dermatology at Duke University Medical Center over a period of 14 months in an IRB-approved study. Several patients were imaged over multiple sessions at three month intervals. Disease types and the number of subjects (n) per type are as follows: normal control (n=4), morphea (n=12), systemic scleroderma (n=1), and GVHD (n=5). All subjects were individually informed about the study and written consent forms were obtained. The following locations of the patients’ body were imaged: upper back, lower back, abdomen, upper arm, forearm, thigh, calf, and additional affected sites and their corresponding contralateral normal sites. Because SWS and displacement magnitude depend both on material stiffness and geometry, the contralateral site that shares the same anatomy was imaged as the normal control. The images were acquired by placing the transducer directly above the skin, coupled by water-based ultrasound gel. To control the location of the beam focus inside the dermis, a gel-bridge was mounted on top of the skin to create a flexible offset, and care was taken to avoid compressing the skin and to avoid air bubbles trapped in the gel in the region of interest. Five repeated measures were taken from each imaging location.
Displacement estimation
Displacement was estimated using normalized 1-D cross-correlation with the reference frame. A correlation coefficient mask with a threshold of 0.96 was applied to the displacement data to reject unreliable displacement estimates.
ARFI displacement magnitude and Shear wave speed estimation
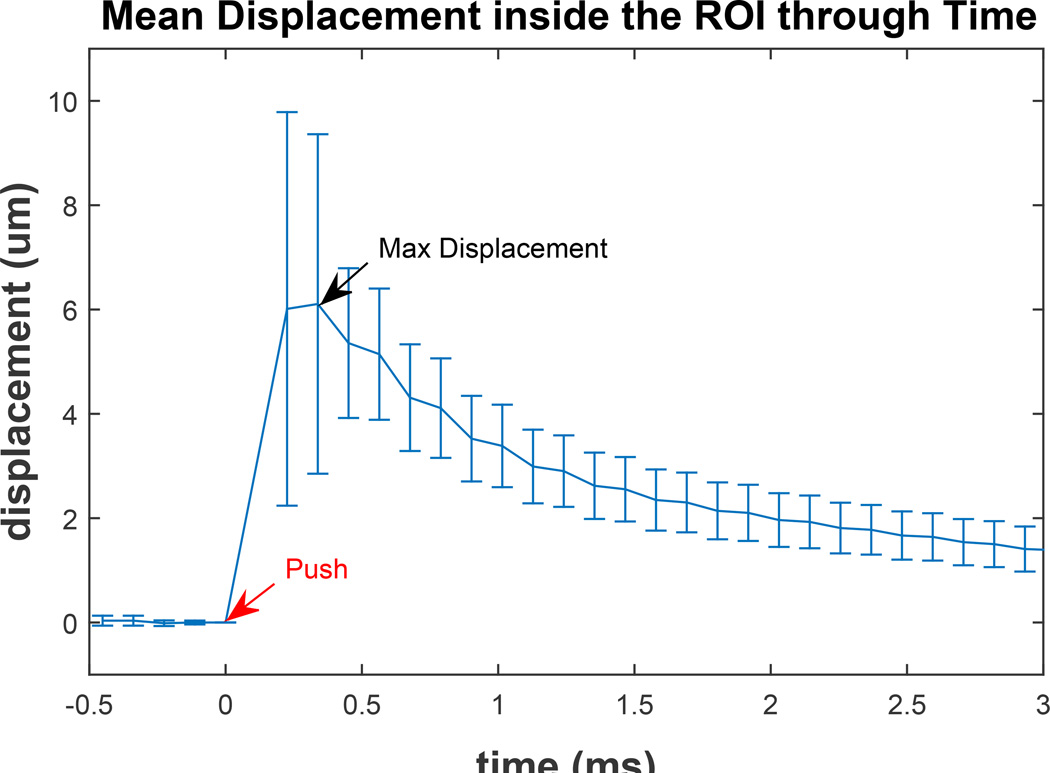
The on-axis displacement profiles were processed with a bandpass filter (fcutoffs = 50, 1800Hz) to reduce the low frequency motion artifact and high frequency jitter noise. To generate the ARFI images, the frame acquired 0.23 ms after the push was used as the characteristic displacement since it has empirically yielded images with the greatest image contrast and correlation with underlying tissue stiffness (Palmeri et al., 2005). The 0.23 ms displacement tracking time was chosen from empirical observation as the time of maximum displacement inside the ROI (Figure 3). A median filter with an axial-by-lateral kernel of 0.5 × 0.9mm2 was applied to the final images.
Figure 3.
Mean and standard deviation of displacements inside the Region of Interest (ROI) of a healthy subject’s upper back. The Acoustic Radiation Force (ARF) push occurs at time 0 (red arrow) and maximum mean displacement occurs at the second track time (black arrow). The displacement at the first track time after the push is comparable to maximum displacement; however, the standard deviation of the second track time is slightly lower due to decrease in shearing of the tissue as it is recovering from the push. The displacement amplitude quickly decreases after the time of maximum displacement.
The off-axis displacement profile was processed with a lowpass filter (fcutoff = 1800Hz) to reject high frequency jitter. A lowpass filter, rather than the bandpass filter that was used in the on-axis displacement profiles, was applied because time derivatives of the off-axis displacement profiles were then taken to find the wave arrival times for processing using the time-of-flight SWS on time-to-peak-slope data. This temporal differentiation adequately removed high frequency noise in the data. SWS was estimated using Radon sum transformation on time-to-peak-slope data (Rouze et al., 2010).
The inclusion criteria for successful data acquisition were:
Region of interest (ROI) was confined within the dermis: The range of the ROI was 1.77 × 7.2 mm2 axial-by-lateral. A subset of the ROI was manually selected by restricting the axial range using B-mode and ARFI images to be confined within the dermis with well correlated displacements (correlation coefficient > 0.96). The region where the correlation coefficient value was lower than the threshold was discarded in the analysis. ARFI displacement magnitude was found by taking the mean of the displacement field inside the ROI. Shear wave speed was measured by axially averaging the displacement field within the ROI prior to speed estimation.
ROI was located in a uniform region of tissue: ARFI displacement field inside the ROI with SNR (µ/σ; µ=mean displacement magnitude; σ=standard deviation of displacement field) greater than 1. Acquisitions where σ was greater than µ were discarded. An example of a successful acquisition is shown in Figure 4.
Estimates accurately reflect tissue region: For a single imaging site, the total number of successful measures had to be greater than 3 out of 5 trials with the ratio between the interquartile range and the mean of all valid trials ≤ 0.3.
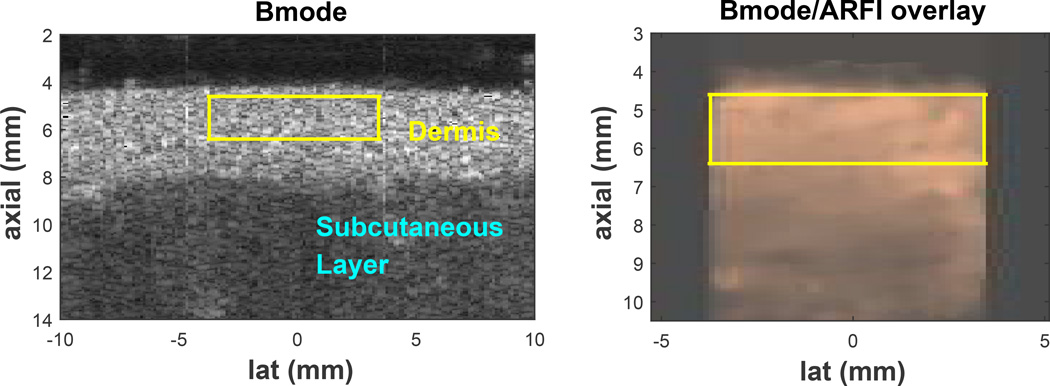
Figure 4.
B-mode image of the upper back skin (left), Acoustic Radiation Force Impulse (ARFI) displacement field in copper colormap overlaid on top of the corresponding gray B-mode image (middle), and differentiated displacement profile of shear wave through time (right) of a valid acquisition. The yellow box represents the region of interest (ROI) where the stiffness metrics are taken from. The color-bar unit of the middle image is [µm] and of the right image is [µm/ms]. Layers of the skin, dermis and subcutaneous layer, are well delineated by the difference in B-mode brightness and often by the difference in ARFI displacement magnitude. On the right plot, the slope of the white line represents the shear wave speed determined by Radon sum transformation. In this acquisition, the shear wave speed was 3.48 m/s.
Skin Thickness Measurements and Normalization
The thickness of the imaged skin was measured using the measuring tool in ImageJ, a freely distributed image processing program developed at the National Institute of Health (http://imagej.nih.gov/ij/). In parts of the analysis, shear wave speed inside sclerotic skin was normalized by the thickness of the skin using equation [5] shown below, where hhealthy is the height of contralateral healthy skin, hsclerotic corresponding height of the sclerotic skin, and N the normalization factor.
| [5] |
The equation indicates that the true shear wave speed inversely proportional to the skin thickness, an assumption used for thin media as shown in the Lamb wave equation [2].
Results
B-mode, ARFI, and SWEI
Figures 4 shows examples of a typical B-mode scan of the skin, ARFI displacement field overlaid on top of the matching B-mode, and the corresponding shear wave propagation profile inside the ROI. Shown in the B-mode image (left) of Figure 4, the uppermost hyper-echoic layer is the dermis (annotated in yellow). The image shows clear delineation of the skin and the subcutaneous fat and muscle layer (annotated in light blue) by difference in brightness. The yellow box represents the region of interest (ROI) for ARFI and SWEI inside the dermis. As seen in the middle image, relatively uniform brightness of the ARFI displacement field inside the ROI indicates homogeneity of the skin stiffness; mean displacement was 7.35 µm with standard deviation of 2.57 µm (SNR=2.86). In this acquisition, the ROI is entirely contained inside the dermis, which maximizes the ROI. The right image is the SWEI data showing tissue velocity versus time and lateral position inside the ROI displayed in a two-dimensional image. The image shows wave motion with peak velocity (differentiated displacement) moving away from the excitation (lat = −4.6 mm) with increasing time. The trajectory of the wave corresponding to the peak Radon sum is indicated by the white line and there is good agreement between the wave motion and the estimated trajectory.
Invalid acquisitions included those where the dermis was not contained inside the ROI due to poor positioning of the transducer or air bubbles trapped between the transducer and the skin interface causing poor coupling. These acquisitions were discarded due to poor ARFI SNR (SNR < 1) and weak shear wave propagation.
Out of 3409 total acquisitions, 2178 satisfied the inclusion criteria as explained above (Table 2).
Table 2.
Reconstruction Success Rate. From all acquisitions, data not satisfying the first 2 inclusion criteria (i.e. data for which the dermis was not contained inside the ROI and data with ARFI SNR<1) were discarded from the analysis. The numbers under the column “ROI within Dermis with High SNR” indicates the number of acquisitions for the dermis was successfully imaged with ARFI image SNR>1. “Successful Reconstruction” lists the number of acquisitions that fulfilled all three criteria aforementioned in the Methods section. The percentage numbers in parenthesis represent the success rate when compared with “ROI within Dermis with High SNR.”
| Total Acquisition | ROI within Dermis with High SNR |
Valid Reconstruction | |
|---|---|---|---|
| All locations | 3409 | 2562 | 2178 (85.0%) |
| Back Only | 908 | 807 | 930 (92.4%) |
Comparison of stiffness metrics inside left and right side of normal skin
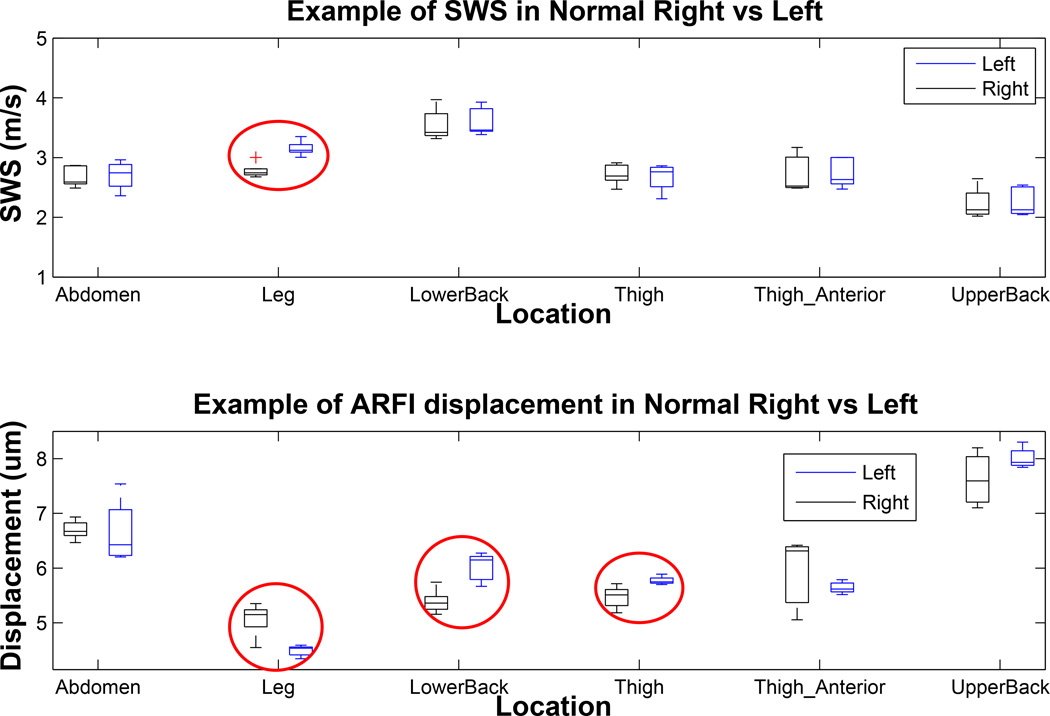
As shown in Figure 5, the shear wave speeds from right and symmetric left body sites were mostly consistent in a single patient; in all locations except for the leg (circled red in Figure 5, top plot), the shear wave speeds in the two symmetric areas were not statistically different using the Student t-test (mean p=0.84). The shear wave speeds inside the dermis of the left and right leg were different from each other (p<0.002). As shown in the bottom plot of Figure 5, the ARFI displacement magnitudes differ more frequently between the symmetric locations than the SWS likely because, unlike SWS, they are not absolute measurements of true material stiffness and depend upon tissue attenuation and acoustic parameters; the circled cases were significantly different with mean p<0.05.
Figure 5.
Shear wave speed and Acoustic Radiation Force Impulse (ARFI) displacement comparison in contralateral right/left pairs in different body locations of a normal control study subject. The top plot shows the range of shear wave speeds reconstructed in left and right pairs of normal skin on various body sites. The bottom plot shows corresponding mean ARFI displacement inside the Region of Interest (ROI). Each box represents distribution of 3–5 individual estimates at an imaging location (total valid acquisition of 55 for this subject). All acquisitions were made in a single imaging session. The red circles indicate cases in which the stiffness metrics inside left and right contralateral sites were significantly different.
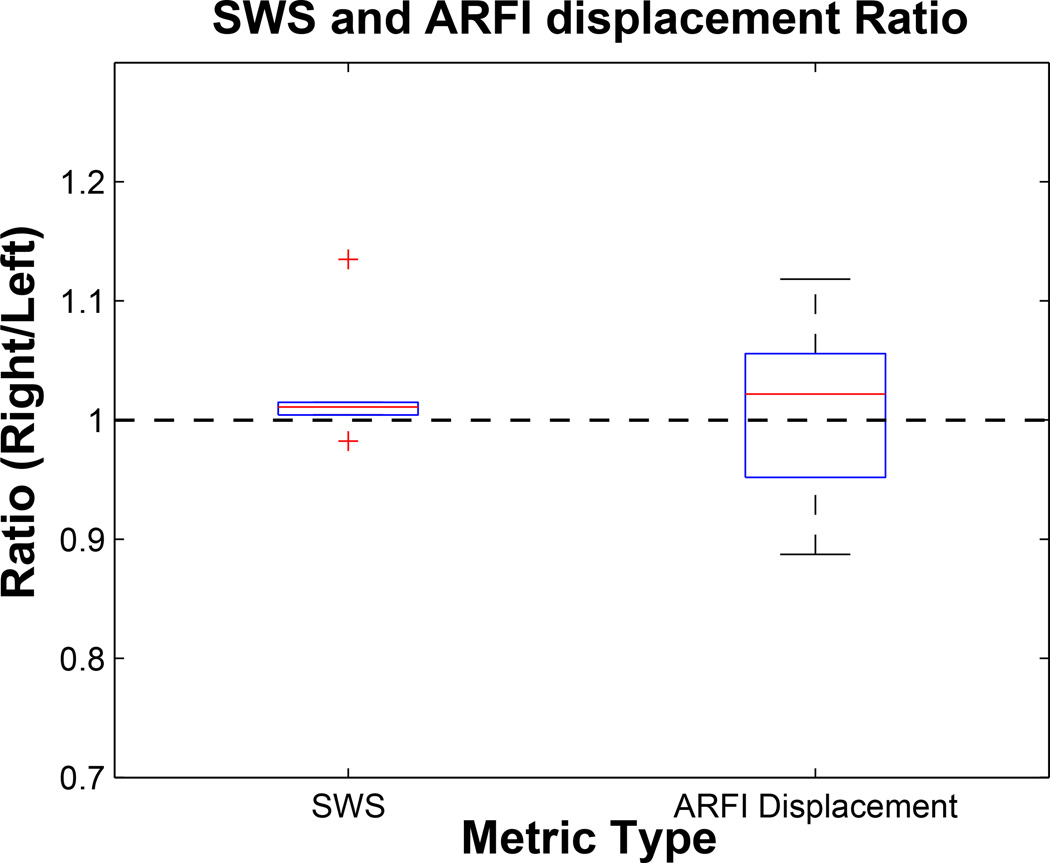
From Figure 6, we can conclude that these stiffness of healthy left and contralateral right matched imaging locations are consistent to within 1–2% and that, from the tighter IQR, SWS is a more consistent metric in comparing stiffness than ARFI displacement.
Figure 6.
The distribution of ratio values of shear wave speed (SWS) and Acoustic Radiation Force Impulse (ARFI) displacement magnitude measurements inside each pair of left and symmetric right sides of healthy skin in a single patient. Data correspond to those shown in Figure 5. The ratio was taken by normalizing the metrics from the right side of the body to by those from the left. The distributions of the ratios taken from each pair were plotted as above. Median and interquartile range (IQR) of these ratios were (1.01, 0.01) and (1.02, 0.10) for SWS and ARFI displacement, respectively. The mean and standard deviation p-values for t-test between each pair of normal right and left stiffness metrics were 0.68±0.36 and 0.22±0.31 for SWS and ARFI displacement, respectively. For both SWS and ARFI displacement magnitude, there was no statistical difference.
Comparison of stiffness metrics inside sclerotic and normal skin
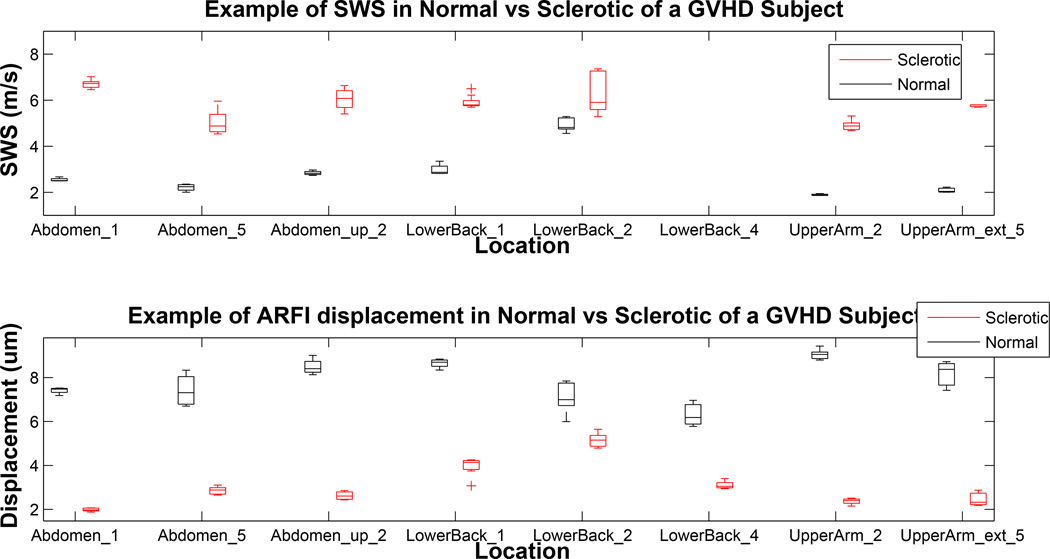
Shown in the top plot of Figure 7 is the comparison of the measured SWS between normal and sclerotic skin of a subject with localized GVHD. In all cases, the shear wave speed inside sclerotic skin was higher than the speed inside contralateral normal skin (mean p<0.005). The bottom plot shows difference in ARFI displacement level inside the normal and sclerotic skin. In all cases, the displacement magnitude inside the normal skin was higher than that of the sclerotic skin. The distributions of normal and sclerotic skin were statistically significant from each other (mean p<0.01). The p-values for SWS were lower, meaning that there was more significant differentiation between sclerotic and normal skin using SWS. These data, under the hypothesis that sclerosis causes significant stiffening of the skin, support the conclusion that SWS provides better differentiation between normal and sclerotic skin in this patient than ARFI displacement data.
Figure 7.
Shear wave speed and Acoustic Radiation Force Impulse (ARFI) displacement comparison in contralateral normal/sclerotic pairs in different body locations of a study subject with Graft versus Host Disease (GVHD). This patient was imaged through five imaging sessions at three month intervals. Acquisitions made in the same location but different imaging sessions were considered to be from a “different” location, and therefore, there are repeated locations on the x-axis. The numbers noted in location names represent the imaging sessions for the acquisition. Blank locations indicate unsuccessful acquisitions at a given body site. The boxes in the top plot represent distribution of shear wave speed (SWS) estimations over 106 acquisitions; boxes in the bottom plot represent distribution of ARFI displacement level inside the region of interest (ROI) over 74 acquisitions.
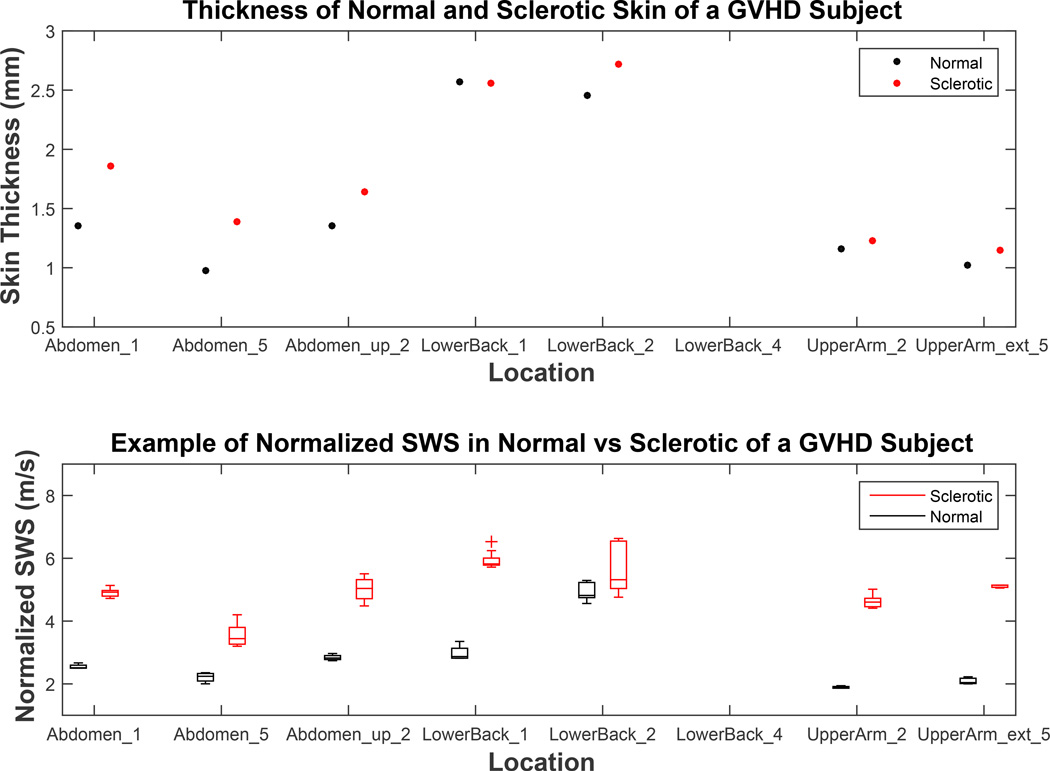
In this subject with GVHD, sclerotic skin tended to be similar to or slightly thicker than normal skin (Figure 8, top). Therefore, skin thickness normalized SWS inside sclerotic skin was generally lower than measured the SWS, nonetheless, greater than SWS measured inside normal skin. On average, sclerotic skin of a GVHD subject was 18% thicker than the respective healthy skin (Figure 8). The bottom plot of Figure 8 compares the SWS in normal and sclerotic skin after normalization by respective skin thicknesses. The distributions of SWS in normal and sclerotic skin were significantly different from each other (mean p<0.02).
Figure 8.
The difference in skin thickness between healthy and sclerotic skin (top) and normalized shear wave speed (SWS) comparison in contralateral normal/sclerotic pairs in difference body locations of a study subject with Graft versus Host Disease (GVHD). The top plot shows the difference in skin thickness between sclerotic and contralateral healthy normal skin. The bottom plot is a modified analysis of the top plot of Figure 7, replacing measured SWS inside sclerotic skin to SWS normalized to respective skin thickness.
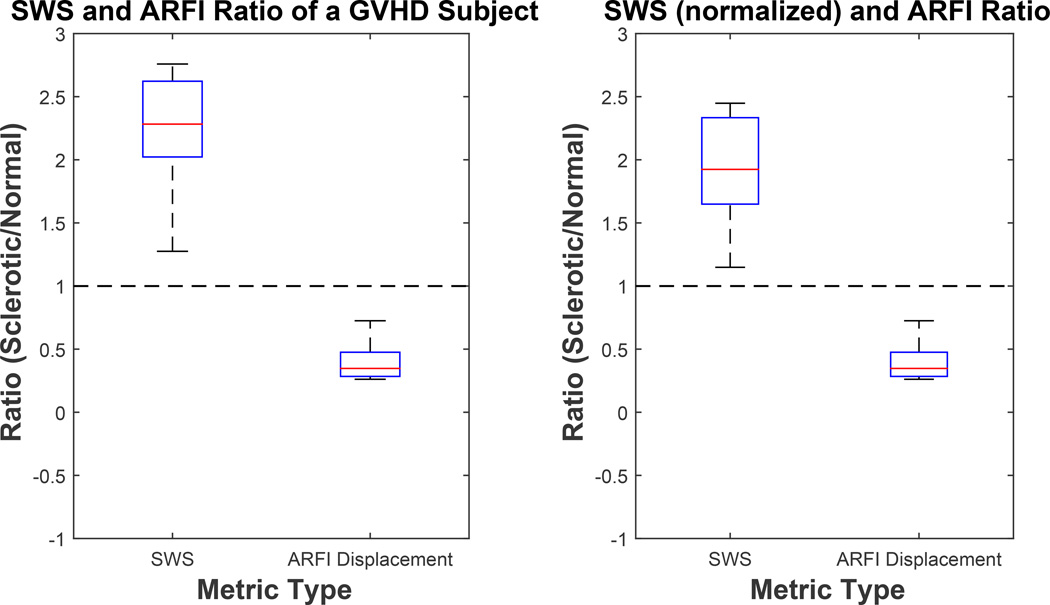
From Figure 9, we can conclude that SWS inside sclerotic skin in the patient with GVHD was, on average, 2.25x faster than healthy skin SWS using measured SWS (left plot) and 2x faster using normalized SWS (right plot). Mean ARFI displacement level was about 40% lower than in normal skin. Higher shear wave speed and lower ARFI displacement both indicate that the diseased dermis was stiffer than healthy dermis.
Figure 9.
Ratios of shear wave speed (SWS) and Acoustic Radiation Force Impulse (ARFI) displacement magnitude measurements inside the sclerotic and contralateral healthy skin. SWS ratio using measured SWS is shown in the left plot (corresponding to data shown in Figure 7) and SWS ratio using skin thickness normalized SWS is shown in the right plot (corresponding to data shown in Figure 8). Median and interquartile range (IQR) of these ratios was (2.28, 0.60), (0.34, 0.19), (1.92, 0.68), (0.34, 0.19) from left to right for SWS, ARFI displacement, SWS, and ARFI displacement respectively.
The same analysis was repeated on the data from a subject with morphea (Figures 10, 11, and 12).
Figure 10.
Shear wave speed and Acoustic Radiation Force Impulse (ARFI) displacement comparison in contralateral normal/sclerotic pairs in different body locations of a study subject with morphea. This patient was imaged through three imaging sessions at three month intervals. Each box represents the distribution of 3–5 individual acquisition for an imaging location. There were a total of 38 acquisitions for this subject.
Figure 11.
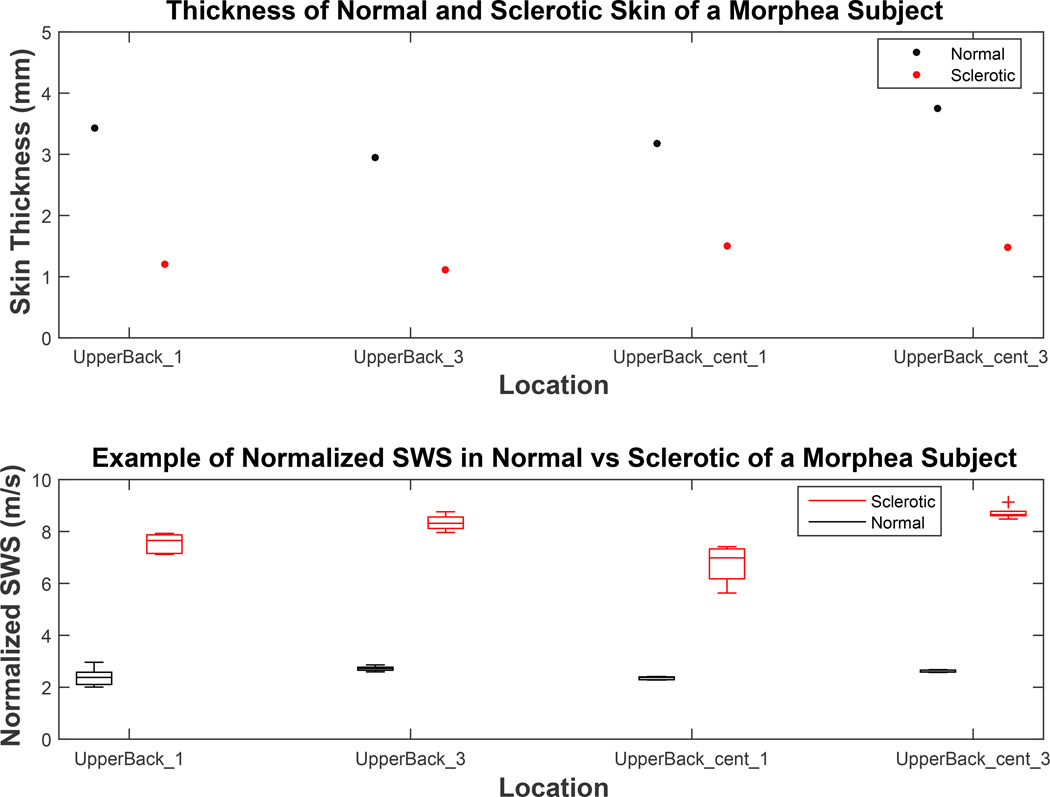
The difference in skin thickness between healthy and sclerotic skin (top) and normalized shear wave speed (SWS) comparison in contralateral normal/sclerotic pairs in difference body locations of a study subject with morphea. The top plot compares skin thickness in sclerotic and contralateral healthy normal skin. The bottom plot is a modified analysis of the top plot in Figure 10, replacing measured SWS inside sclerotic skin to skin thickness normalized SWS.
Figure 12.
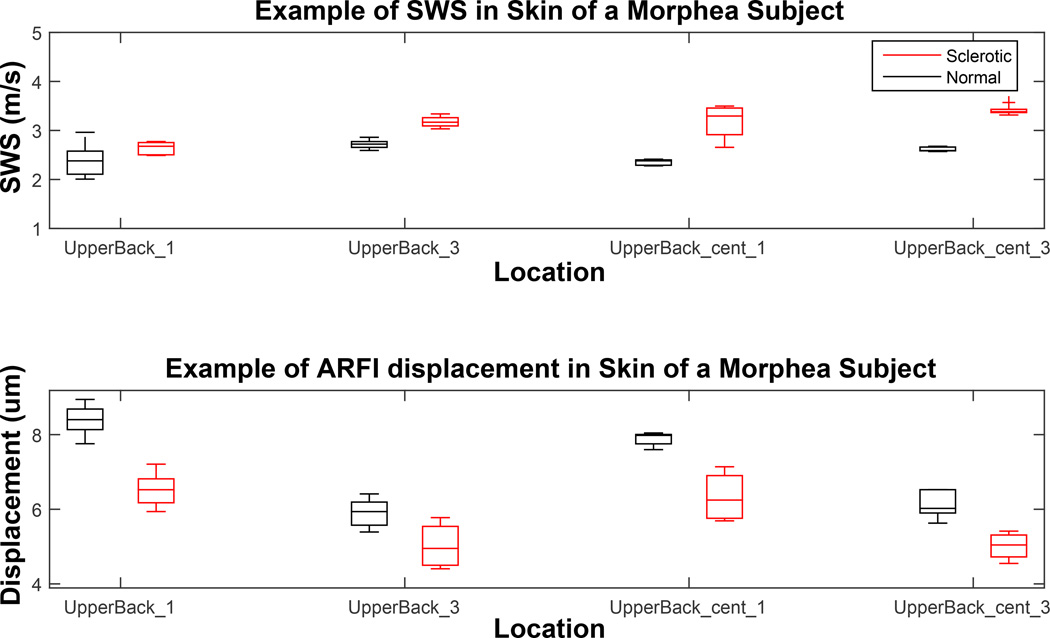
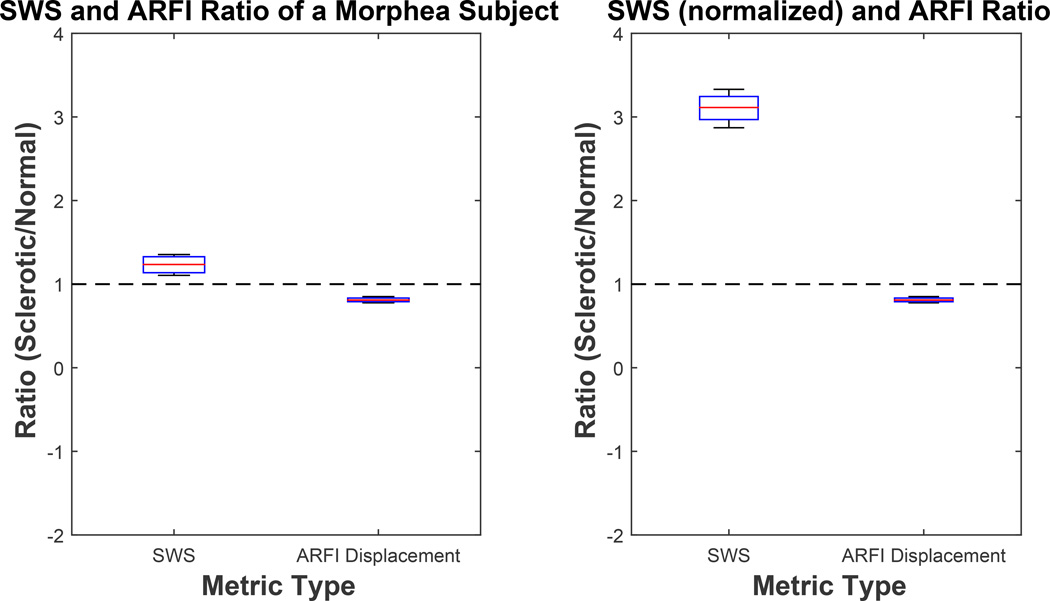
Ratio of shear wave speed (SWS) and Acoustic Radiation Force Impulse (ARFI) displacement magnitude measurements inside the sclerotic and contralateral healthy skin. SWS ratio using measured SWS is shown in the left plot (corresponding to data shown in Figure 10) and SWS ratio using skin thickness normalized SWS is shown in the right plot (corresponding to data shown in Figure 11). Median and interquartile range (IQR) of these ratios was (1.24, 0.19), (0.81, 0.04), (3.11, 0.28), (0.81, 0.04) from left to right for SWS, ARFI displacement, SWS, and ARFI displacement, respectively.
The distributions of normal and sclerotic region were both statistically different with mean p<0.05 and p<0.01 for SWS and ARFI displacement magnitude respectively (Figure 10). This trend of clear separation between metrics taken from the normal control and the diseased site is consistent with what was seen in Figures 7 and 8 of the GVHD subject. However, unlike the GVHD case, the thickness of sclerotic region was consistently thinner than the respective normal region (Figure 11, top). On average, the morphea sclerotic skin was 60% thinner than the normal skin and the separation between SWS inside normal and sclerotic was greater after normalization (mean p<0.001) (Figure 11, bottom). Figure 12 shows that measured SWS inside sclerotic skin is about 24% higher than healthy skin, 300% higher after skin thickness normalization, and ARFI displacement was 20% lower than measurements taken inside normal skin. These data quantitatively support how much stiffer sclerotic skin is than normal skin.
Longitudinal monitoring of the stiffness metrics of healthy locations
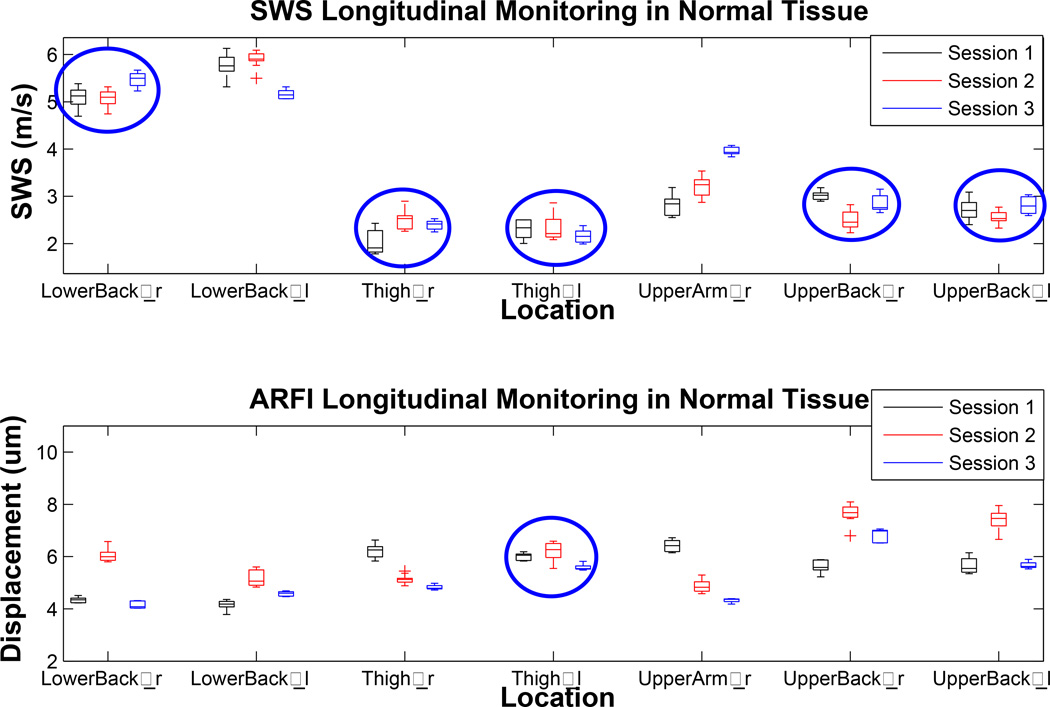
Figure 13 shows the stiffness metrics from normal locations of a subject monitored through three imaging sessions. SWS within a single location was more consistent through time that ARFI displacement level. The SWS measured in most locations (5/7) through all sessions were in good agreement (mean p=0.44, circled in blue). There were also cases (no circle) where the speeds measured in each session were different from the others (mean p<0.1). Mean ARFI displacement levels tend to vary more than SWS because they depend on the magnitude of the force which may change with transducer position (such as standoff height and angle) with each individual acquisition (mean p<0.01). Nonetheless, there was one case (circled in blue) where the displacement level did stay relatively constant through time (mean p=0.23).
Figure 13.
Longitudinal consistency of shear wave speed (SWS) and Acoustic Radiation Force Impulse (ARFI) displacement level of the healthy “normal” locations. This subject was imaged in three separate sessions at three months intervals. The top plot shows estimated SWS of the same location from three different imaging sessions. “r” or “l” noted next to the location name refers to the side of the body where the acquisitions were made. The bottom plot shows change in ARFI displacement magnitude monitored through time. 5 out of 7 locations showed consistency in SWS (circled in blue), whereas only 1 out of 7 locations (circled in blue) showed consistency in ARFI displacement level.
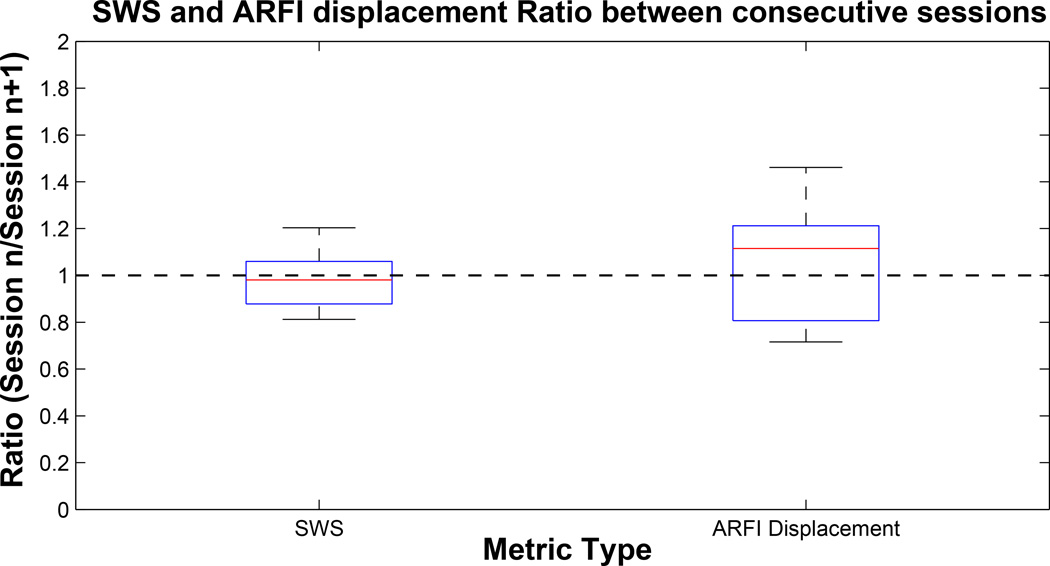
We can see from Figure 14 that the median values of both boxplots are close to 1, indicating that both metrics are expected to be consistent through time without any bias; however, IQR values show that there is appreciable variance that is larger for ARFI displacements (41%) than for SWS (18%). Including all patient acquisitions, the rate of successful reconstruction out of total acquisitions is shown in Table 2.
Figure 14.
Ratio of shear wave speed (SWS) and Acoustic Radiation Force Impulse (ARFI) displacement magnitude measured between consecutive imaging sessions. Median and interquartile range (IQR) of these box plots are (0.98, 0.18) and (1.06, 0.41) for SWS and ARFI displacement, respectively.
Successful reconstruction rate (85.0% and 92.4%) in Table 2 indicates good reliability of the ARFI and SWEI imaging techniques once the dermis is properly imaged. The numbers were analyzed with restriction to the back to show the significantly improved rate of successful reconstruction in areas where the dermis is relatively thicker and therefore easier to position the ROI properly within the dermis.
Discussion
We were able to successfully reconstruct ARFI displacement images and shear wave speed estimates inside the dermis of various locations in the body. ARFI image displacements ranged from 2–10 µm in our patients, providing for high SNR data in valid datasets. SWS ranged from 1.8–7.0 m/s, which could be readily resolved with our SWEI configuration.
Figure 4 shows exemplary shear wave propagation inside the dermis with linear projections, which was typical in all valid acquisitions; this linear projection of the wave front validates the assumption that the skin is an elastic material to a first-order approximation. We chose to report the SWS metric instead of converting it to an elastic modulus due to uncertain boundary conditions that may affect the conversion.
Using a clinically-available, high frequency 14L5 transducer in harmonic imaging mode, we were able to acquire high-quality B-mode images of the skin that clearly delineated the dermis and subcutaneous layer boundary (Figure 4, left). When the region of excitation was well within the dermis and the ARFI displacement field yielded sufficient SNR (Figure 4, middle), we saw clear shear wave propagation (Figure 4, right) and were able to estimate the speed with a high success rate of 85.0% (Table 2). The greatest challenge was to properly fit the ROI inside the thin dermis. Locations where the skin is thick, such as the upper and the lower back, had higher overall success rates (Table 2).
To confirm the validity of using the contralateral normal site as the control, we compared the SWS and mean ARFI displacement magnitude in symmetric left/right locations on healthy normal control subjects. Since contralateral sites should have similar normal anatomic geometry, the difference in stiffness metrics should come from the changes caused by the lesions. As shown in Figures 5 and 6, there was good agreement between stiffness metrics taken from contralateral normal sites. SWS was shown to be more consistent with smaller variation between the two sides than was ARFI displacement level; this result was expected because SWS, unlike ARFI imaging, does not depend on the magnitude of acoustic radiation “push” force or acoustic attenuation. For example, mean displacement magnitudes taken in right anterior thigh and right upper back (Figure 5, bottom) have larger variance among acquisitions compared to other ARFI or SWEI acquisitions. This difference is most likely due to small axial repositioning of the transducer that changes the strength of the force field inside the ROI. Both metrics varied with body location with no particular trend as shown in the spread of values across imaging sites in Figures 5, 7, 10, and 13. This variation is due to both the change in inherent stiffness and changes in geometry of dermis.
Once we concluded that contralateral normal sites are valid controls for sclerotic sites (Figures 5 and 6), we analyzed the difference in stiffness metrics between sclerotic and normal sites for a patient with GVHD. As shown in Figures 7, 8, and 9, sclerotic skin had higher SWS and lower ARFI displacement magnitude, indicating stiffer mechanical properties. Overall, the SWS in sclerotic skin was 200% higher and ARFI displacement level 61% lower than in normal skin (Figure 9, right). This result was consistent with the hypothesis that sclerotic sites are stiffer than normal sites due to higher fibrotic collagen content. This trend, that metrics inside sclerotic site indicates higher stiffness than that inside healthy skin, was not sensitive to disease type, as similar results were found in a subject with morphea (Figures 10, 11, and 12). As the comparison of contralateral healthy sites showed (Figure 6), the variance in ARFI metric was greater than in SWS and, therefore, SWEI showed more clear separation of the normal and diseased states. Disease severity varied among patients and imaged body sites, and, as might be expected, the magnitude of the difference varied between these two example subjects. As shown in Figures 1 and 2, sclerosis can be accompanied by atrophy, inflammation, and other scarring causing significant changes in the skin geometry, especially thickness. In these cases, the sclerotic site and the contralateral normal sites are not structurally matched and therefore, the comparison of the measured SWS may not be an accurate measure of disease severity. Therefore, the normalized SWS may be a more accurate representative of the true stiffness. For example, if the disease is accompanied by atrophy, true transverse wave speed inside these sites is higher than the measured velocity (Figures 11 and 12).
We found that skin thickness varied as a function of sclerosis etiology between GVHD and morphea. In the subject with GVHD, the skin thickness of sclerotic sites were either similar to or slightly thicker than normal sites (Figure 8) while in the subject with morphea, the sclerotic skin thickness was significantly decreased (Figure 11). These results demonstrate that skin geometry is a function of sclerotic skin etiology.
Lastly, we compared the stiffness metrics acquired from different imaging sessions, each separated by three month intervals in a subject, to analyze the consistency of these metrics through time (Figures 13 and 14). Although the expected ratio of metrics measured in the same location in consecutive sessions were near 1 (Figure 14), the IQR values of both SWS and ARFI displacement metrics were 0.18 and 0.41 respectively, which are greater than the IQR values of 0.01 and 0.10 (SWS and ARFI displacement respectively), between normal left and right (Figure 6). Factors that may cause this greater difference include variation in imaging location or transducer position and change in general skin condition such as hydration during the three month interval between imaging sessions.
We expect the stiffness difference to change with disease progression; however, we were not able to correlate the amount of difference to the severity of fibrosis because the amounts of collagen content and clinical scoring in these sites were unknown to us. Additionally, monitoring the stiffness of a location through time may be challenging due to variations in imaging location, transducer position, and skin condition such as hydration which lead to variance in measurements between imaging sessions (Hendriks et al., 2004). Therefore, to monitor the treatment progress of sclerotic sites, each imaging session should include re-imaging contralateral normal controls rather than relying on the change in absolute stiffness metrics through time.
While this study demonstrated feasibility of using ARFI and SWEI to measure the stiffness of normal and sclerotic skin, we also had challenges and early stage technical implementation limitations. As mentioned earlier, challenges included lack of an analytical model that may convert the ARFI and SWEI measurements to skin’s elastic modulus. In addition, because there are no existing in vivo methods that we can reference as the ground truth of the skin stiffness, we were not able to validate the ultrasound elasticity measurements to find their accuracy and sensitivity (Edwards and Marks, 1995). Several technical aspects that could be optimized are as follows. First, the harmonic tracking was utilized to achieve high resolution with low clutter noise (Tranquart et al., 1999 and Doherty et al., 2013). Use of a higher-frequency array would allow for even finer resolution and reduced displacement estimation jitter that may improve the image quality. Second, multi-track-location SWEI was used in this study. However, studies by Elegbe et al. (2013) and Hollender et al. (2015) show that single-track-location SWEI (STL-SWEI) significantly reduces speckle bias noise in each track line. Therefore, implementing STL-SWEI may enhance the accuracy of the SWS estimates in the skin as well. Additionally, a higher PRF would enhance the temporal resolution of the system hence allowing speed estimation for greater range of stiffness.
Conclusion
This study showed that successful reconstruction of ARFI displacement and shear wave speed estimation is possible in the skin as long as the ROE (region of excitation) is placed inside the dermis with sufficient displacement SNR. The results of the study are consistent with the pathology of fibrotic sclerosis, by which the affected sites are mechanically stiffened. Both shear wave speed and mean ARFI displacement magnitude in the sclerotic skin indicated higher stiffness. There was a 200% increase in shear wave speed and 61% decrease in mean ARFI displacement magnitude, compared to the contralateral normal sites for a subject with GVHD and a 300% increase in shear wave speed and 19% decrease in mean ARFI displacement magnitude, compared to the contralateral normal sites, for a subject with morphea. ARFI displacement magnitude metrics had greater variability among measurements than SWS due to the direct correlation to the strength of the ARF field inside the ROI that may change with small shifts in the axial transducer position between acquisitions. More clear separation between normal and sclerotic skin was achieved using SWEI shear wave speeds.
Lastly, to properly monitor the disease progression or treatment effect through time, the ratio of the metrics taken from the contralateral healthy and the sclerotic sites should be used rather than the absolute values of the metrics—under the assumption that factors influencing the skin stiffness other than disease itself are normalized through this process.
Acknowledgements
Funding: NIH grant EB002132, Duke Skin Research Center and Pinnell Center for Investigative Dermatology Translational and Innovative Research Support Program, Dermatology Foundation
Dr. Joanna Hooten for her help with imaging and administrative works
Footnotes
Publisher's Disclaimer: This is a PDF file of an unedited manuscript that has been accepted for publication. As a service to our customers we are providing this early version of the manuscript. The manuscript will undergo copyediting, typesetting, and review of the resulting proof before it is published in its final citable form. Please note that during the production process errors may be discovered which could affect the content, and all legal disclaimers that apply to the journal pertain.
References
- Arai S, Jagasia M, Storer B, Chai X, Pidala J, Cutler C, Arora M, Weisdorf DJ, Flowers MED, Martin PJ, Palmer J, Jacobsohn D, Pavletic SZ, Vogelsang GB, Lee SJ. Global and organ-specific chronic graft-versus-host disease severity according to the 2005 NIH Consensus Criteria. 2011;118:4242–4249. doi: 10.1182/blood-2011-03-344390. [DOI] [PMC free article] [PubMed] [Google Scholar]
- Arkachaisri T, Vilaiyuk S, Torok KS, Medsger T. Development and initial validation of the localized scleroderma skin damage index and physician global assessment of disease damage: a proof-of-concept study. Rheumatology (Oxford) 2010;49:373–381. doi: 10.1093/rheumatology/kep361. [DOI] [PMC free article] [PubMed] [Google Scholar]
- Bavu E, Gennisson J-L, Couade M, Bercoff J, Mallet V, Fink M, Badel A, Vallet-Pichard A, Nalpas B, Tanter M, Pol S. Noninvasive in vivo liver fibrosis evaluation using supersonic shear imaging: a clinical study on 113 hepatitis C virus patients. Ultrasound Med. Biol. 2011;37:1361–1373. doi: 10.1016/j.ultrasmedbio.2011.05.016. [DOI] [PubMed] [Google Scholar]
- Correas J-M, Tissier A-M, Khairoune A, Khoury G, Eiss D, Hélénon O. Ultrasound elastography of the prostate: state of the art. Diagnostic and Interventional Imaging. 2013;94:551–560. doi: 10.1016/j.diii.2013.01.017. [DOI] [PubMed] [Google Scholar]
- Doherty JR, Dahl JJ, Trahey GE. Harmonic tracking of acoustic radiation force-induced displacements. IEEE Trans. Ultrason. Ferroelectr. Freq. Control. 2013;60:2347–2358. doi: 10.1109/TUFFC.2013.6644738. [DOI] [PMC free article] [PubMed] [Google Scholar]
- Edwards R, Marks R. Evaluation of biomechanical properties of human skin. Clin. Dermatol. 1995;13:375–380. doi: 10.1016/0738-081x(95)00078-t. [DOI] [PubMed] [Google Scholar]
- Elegbe EC, McAleavey SA. Single tracking location methods suppress speckle noise in shear wave velocity estimation. Ultrasonic Imaging. 2013;35:109–125. doi: 10.1177/0161734612474159. [DOI] [PMC free article] [PubMed] [Google Scholar]
- Feltovich H, Hall TJ, Berghella V. Beyond cervical length: emerging technologies for assessing the pregnant cervix. Am. J. Obstet. Gynecol. 2013;207:345–354. doi: 10.1016/j.ajog.2012.05.015. [DOI] [PMC free article] [PubMed] [Google Scholar]
- Gennisson J-L, Baldeweck T, Tanter M, Catheline S, Fink M, Sandrin L, Querleux B. Assessment of elastic parameters of human skin using dynamic elastography. IEEE Trans. Ultrason. Ferroelectr. Freq. Control. 2004;51(8):980–989. doi: 10.1109/tuffc.2004.1324402. [DOI] [PubMed] [Google Scholar]
- Gennisson J-L, Deffieux T, Macé E, Montaldo G, Fink M, Tanter M. Viscoelastic and anisotropic mechanical properties of in vivo muscle tissue assessed by supersonic shear imaging. Ultrasound Med. Biol. 2010;36:789–801. doi: 10.1016/j.ultrasmedbio.2010.02.013. [DOI] [PubMed] [Google Scholar]
- Hendriks FM, Brokken D, Oomens CW, Baaijens FPT. Influence of hydration and experimental length scale on the mechanical response of human skin in vivo, using optical coherence tomography. Skin Res. Technol. 2004;10:231–241. doi: 10.1111/j.1600-0846.2004.00077.x. [DOI] [PubMed] [Google Scholar]
- Hollender PJ, Rosenzweig SJ, Nightingale KR, Trahey GE. Single- and multiple-track-location shear wave and acoustic radiation force impulse imaging: matched comparison of contrast, contrast-to-noise ratio and resolution. Ultrasound Med. Biol. 2015;41:1043–1057. doi: 10.1016/j.ultrasmedbio.2014.11.006. [DOI] [PMC free article] [PubMed] [Google Scholar]
- Hou Y, Zhu Q, Liu H, Jiang Y, Wang L, Xu D, Li M, Zeng X, Zhang F. A preliminary study of acoustic radiation force impulse quantification for the assessment of skin in diffuse cutaneous systemic sclerosis. J. Rheumatol. in press doi: 10.3899/jrheum.140873. [DOI] [PubMed] [Google Scholar]
- Kelsey C, Torok K. The Localized Scleroderma Assessment Tool (LoSCAT): Responsiveness to change in a pediatric clinical population. J. Am. Acad. Dermatol. 2013;69(2):214–220. doi: 10.1016/j.jaad.2013.02.007. [DOI] [PMC free article] [PubMed] [Google Scholar]
- Lai WM, Rubin D, Krempl E. Introduction to continuum mechanics. Woburn, MA: Butterworth-Heinmann; 1999. [Google Scholar]
- Ma Q, Ma Y, Gong X, Zhang D. Improvement of tissue harmonic imaging using the pulse-inversion technique. Ultrasound Med. Biol. 2005;31:889–894. doi: 10.1016/j.ultrasmedbio.2005.03.006. [DOI] [PubMed] [Google Scholar]
- Meng W, Zhang G, Wu C, Wu G, Song Y, Lu Z. Preliminary results of acoustic radiation force impulse (ARFI) ultrasound imaging of breast lesions. Ultrasound Med. Biol. 2011;37:1436–1443. doi: 10.1016/j.ultrasmedbio.2011.05.022. [DOI] [PubMed] [Google Scholar]
- Nenadic I, Mehrmohammadi M, Urban MW, Alizad A, Greenleaf JF, Fatemi M. In vivo patient measurements of bladder elasticity using Ultrasound Bladder Vibrometry (UBV) Conf. Proc. IEEE Eng. Med. Biol. Soc. 2013:113–116. doi: 10.1109/EMBC.2013.6609450. [DOI] [PubMed] [Google Scholar]
- Nezafati CA, Cayce RL, Susa JS, Setiawan AT, Tirkes T, Bendeck SE, Jacobe HT. 14-MHz ultrasonography as an outcome measure in morphea (Localized Scleroderma) Archives of Dermatology. 2011;147(9):1112–1115. doi: 10.1001/archdermatol.2011.243. [DOI] [PubMed] [Google Scholar]
- Nyborg WLM. Acoustic streaming. In: Mason WP, editor. Physical acoustics. New York, NY: Academic Press; 1965. pp. 265–331. [Google Scholar]
- Nierhoff J, Chávez Ortiz AA, Herrmann E, Zeuzem S, Friedrich-Rust M. The efficiency of acoustic radiation force impulse imaging for the staging of liver fibrosis: a meta-analysis. Eur. Radiol. 2013;23:3040–3053. doi: 10.1007/s00330-013-2927-6. [DOI] [PubMed] [Google Scholar]
- Nightingale K, Soo MS, Nightingale R, Trahey G. Acoustic radiation force impulse imaging: in vivo demonstration of clinical feasibility. Ultrasound Med. Biol. 2002;28:227–235. doi: 10.1016/s0301-5629(01)00499-9. [DOI] [PubMed] [Google Scholar]
- Palmeri ML, Member S, Sharma AC, Bouchard RR, Nightingale RW, Nightingale KR. A Finite-Element Method Model of Soft Tissue Force. 2005;52:1699–1712. doi: 10.1109/tuffc.2005.1561624. [DOI] [PMC free article] [PubMed] [Google Scholar]
- Palmeri ML, Wang MH, Rouze NC, Abdelmalek MF, Guy CD, Moser B, Diehl AM, Nightingale KR. Noninvasive evaluation of hepatic fibrosis using acoustic radiation force-based shear stiffness in patients with nonalcoholic fatty liver disease. J. Hepatol. 2011;55:666–672. doi: 10.1016/j.jhep.2010.12.019. [DOI] [PMC free article] [PubMed] [Google Scholar]
- Rosenzweig S, Palmeri M, Rouze N, Lipman S, Kulbacki E, Madden J, Polascik T, Nightingale K. Comparison of Concurrently Acquired In Vivo 3D ARFI and SWEI Images of the Prostate. IEEE Int. Ultrason. Symp. 2012:8–11. [Google Scholar]
- Rouze NC, Wang MH, Palmeri ML, Nightingale KR. Robust estimation of time-of-flight shear wave speed using a radon sum transformation. IEEE Trans. Ultrason. Ferroelectr. Freq. Control. 2010;57:2662–2670. doi: 10.1109/TUFFC.2010.1740. [DOI] [PMC free article] [PubMed] [Google Scholar]
- Royer D, Dieulesaint E. Elastic Waves in Soild. Vol. 1. Berlin, Germany: Springer-Verlag; 1996. [Google Scholar]
- Santiago TL, Coutinho M, Salvador MJ, Del Galdo F, Redmond A, Da Silva J. Shear-wave elastography: A new imaging method for evaluating scleroderma skin. Ann. Rheum. Dis. 2014;73:669. [Google Scholar]
- Shulman HM, Kleiner D, Lee SJ, Morton T, Pavletic SZ, Farmer E, Moresi JM, Greenson J, Janin A, Martin PJ, McDonald G, Flowers MED, Turner M, Atkinson J, Lefkowitch J, Washington MK, Prieto VG, Kim SK, Argenyi Z, Diwan aH, Rashid A, Hiatt K, Couriel D, Schultz K, Hymes S, Vogelsang GB. Histopathologic diagnosis of chronic graft-versus-host disease: National Institutes of Health Consensus Development Project on Criteria for Clinical Trials in Chronic Graft-versus-Host Disease: II. Pathology Working Group Report. Biol. Blood Marrow Transplant. 2006;12:31–47. doi: 10.1016/j.bbmt.2005.10.023. [DOI] [PubMed] [Google Scholar]
- Sporea I, Bota S, Jurchis A, Sirli R, Grădinaru-Tascău O, Popescu A, Ratiu I, Szilaski M. Acoustic radiation force impulse and supersonic shear imaging versus transient elastography for liver fibrosis assessment. Ultrasound Med. Biol. 2013;39:1933–1941. doi: 10.1016/j.ultrasmedbio.2013.05.003. [DOI] [PubMed] [Google Scholar]
- Tanter M, Touboul D, Gennisson J-L, Bercoff J, Fink M. High-resolution quantitative imaging of cornea elasticity using supersonic shear imaging. IEEE Trans. Med. Imaging. 2009;28:1881–1893. doi: 10.1109/TMI.2009.2021471. [DOI] [PubMed] [Google Scholar]
- Tranquart F, Grenier N, Eder V, Peourcelot L. Clinical use of ultrasound tissue harmonic imaging. Ultrasound Med. Biol. 1999;25:889–894. doi: 10.1016/s0301-5629(99)00060-5. [DOI] [PubMed] [Google Scholar]
- Zhai L, Polascik T, Foo W, Rosenzweig SJ, Palmeri M, Madden Nightingale KR. Acoustic radiation force impulse imaging of human prostates: initial in vivo results. Ultrasound Med. Biol. 2012;38(1):56–61. doi: 10.1016/j.ultrasmedbio.2011.10.002. [DOI] [PMC free article] [PubMed] [Google Scholar]
- Zhang D, Li P, Chen M, Liu L, Liu Y, Zhao Y, Wang R. Non-invasive assessment of liver fibrosis in patients with alcoholic liver disease using acoustic radiation force impulse elastography. Abdom. Imaging. 2014 doi: 10.1007/s00261-014-0154-5. 2014. [DOI] [PubMed] [Google Scholar]


