

Abstract
Purpose
To evaluate a pulse sequence combining stimulated echo diffusion preparation with a 3D segmented spoiled gradient echo (SPGR) acquisition for diffusion tensor imaging (DTI) of knee cartilage in healthy and osteoarthritis (OA) populations for early diagnosis and characterization of OA.
Methods
Diffusion weighted images of 40 subjects (20 healthy, 20 OA) at baseline and 20 subjects (10 healthy, 10 OA) at one year were obtained. The subjects were classified according to Kellgren Lawrence (KL) and whole organ magnetic resonance imaging scoring (WORMS) method acquired at 3T. Cartilage full thickness and laminar mean diffusivity (MD) and fractional anisotropy (FA) values were quantified. The reproducibility of MD and FA values was assessed in five healthy human subjects based on test-retest scans.
Results
In general, the full thickness MD values were higher in subjects with knee OA compared to healthy controls in both the baseline and follow up cohort. Laminar analysis MD and FA results were significantly different (p<0.05) between the bone-articular and articular layer with the articular layer having higher MD and lower FA value compared to the bone layer. The global reproducibility error was 6.5% for MD and 11.6% for FA.
Conclusion
The diffusion weighted stimulated echo based sequence may be used as a valuable tool for early diagnosis and characterization of knee OA at 3T in future.
Keywords: Diffusion tensor imaging (DTI), stimulated echo (STE) pulse sequence, 3T, cartilage, laminar analysis, osteoarthritis (OA)
Introduction
Knee osteoarthritis (OA) is a common degenerative disorder that occurs due to aging and abnormal loading of the joint, resulting in a series of biochemical and morphological changes of the joint. Often in knee OA, biochemical degenerative changes manifest before morphological changes in the joint (1). Previous research has shown that subtle changes in biochemical and structural composition of tissue correlate with changes in restricted diffusion of water, which manifest as signal changes on diffusion-weighted (DW) MR images (2,3,4). In diffusion tensor imaging (DTI), the mean diffusivity (MD) quantifies the average displacement of water molecules and fractional anisotropy (FA) measures the deviation from isotropy of diffusing water molecules. DTI at high magnetic field strength (7T and greater) has been shown to have a strong potential in diagnosing early cartilage damage and has clinical implications in OA (2,5,6). Recently, a line scan diffusion acquisition technique (with acquisition time=2:33 minutes per slice) was used by Raya et al to measure and validate DTI in healthy controls and OA subjects’ in-vivo at 7T, showing differences in diffusion values between the two groups. The subjects with OA had significantly increased MD and decreased FA values compared to healthy controls (6,7,8). Currently most MR-DTI sequences for knee imaging use a diffusion weighted spin echo preparation with a single shot echo planar imaging (SSEPI) readout. However, SSEPI sequences are characterized by low bandwidth in the phase encoding direction and in general suffer from geometric distortions (9,10). Sequences like steady state precession imaging and others (11,12,13) have been proposed to overcome the limitations of SSEPI, but are prone to ghosting artifacts and increased acquisition time (10,14,15). Thus, there is a need for new diffusion imaging pulse sequences that can yield suitable images at clinical magnetic field strength (3T) within reasonable acquisition time.
Recently, Hiepe et al have demonstrated the feasibility of a stimulated echo acquisition mode (STEAM) based diffusion preparation MRI technique in combination with a fast low-angle shot (FLASH) readout sequence to detect degenerative changes in skeletal muscle of rabbit shank at 3T (16). The purpose of this study is to evaluate a DTI sequence using a stimulated echo (STE) diffusion preparation for knee cartilage imaging at 3T. Diffusion weighted images were acquired with the new sequence in healthy volunteers and patients with knee OA at baseline and after one year to determine differences between the populations using full thickness and laminar MD and FA values. The laminar organization of cartilage has been previously established (17). We evaluated the relationship between diffusion values and the laminar structure of the knee cartilage. To assess the reproducibility of the MD and FA diffusion values, test-retest scans with repositioning were performed in five healthy volunteers.
Methods
Sequence development and optimization
The sequence used in this study consists of two parts: diffusion weighted signal preparation (STE) and a 3D segmented spoiled gradient echo (SPGR) called magnetization prepared angle modulated partitioned k-space (MAPSS) (18) sequence for signal acquisition. For representative purpose, a detailed diagram of the developed sequence (STEMAPSS) along with the acquisition scheme is shown in Figure 1. At the start of the sequence, the magnetization reset pulses are used to spoil all longitudinal magnetization. A user controlled dead time (~1200 ms) close to the T1 relaxation time of the cartilage is used with the magnetization-reset RF pulses to allow for consistent T1 recovery between repetitions. During the dead time a fat selective inversion pulse for nulling fat signal is played. After the fat saturation pulse, the stimulated echo diffusion preparation sequence includes four 90° hard RF pulses. The first 90° pulse flips the spins from longitudinal (z axis) to the transverse (x-y) plane. The second pulse flips the spins back along the longitudinal axis but in the opposite direction compared to the first pulse. Between the end of the second and beginning of the third pulse a “mixing time (Tmix)” is allowed. It helps to compensate for the shorter TE and the shorter diffusion gradient time, which increases the diffusion weighting without increasing the diffusion gradient duration and TE. The fourth hard pulse flips the remaining spins back to the spatially uniform longitudinal axis preparing them for the segmented SPGR acquisition. The residual transverse magnetization after the preparation is crushed using spoiler gradients and the accumulated longitudinal magnetization is read out immediately using the segmented 3D SPGR acquisition sequence, where the k-space is traversed in segmented fanbeams (Figure 1b). Spatially selective pulses of the 3D SPGR acquisition negate the whole volume excitation of the diffusion preparation. The acquisition starts from the center of k-space to obtain the maximum diffusion weighted contrast. A variable flip angle train is utilized (from 18° to 90°) during the acquisition, which is an effective way to limit signal intensity variations produced from using a train of RF pulses (19,20).
Figure 1.

a). Deatiled sequence diagram of stimulated echo diffusion prepared sequence with MAPSS acquisition. b). Representative figure showing k-space trajectory of fanbeam acquistion in a segment of k-space. The entire k-space is acquired and filled in the same manner.
In-vivo diffusion measurements
Qualitative and quantitative visualization
Subjects
Subject characteristics based on KL and WORMS scoring data set are listed in Table 1. No significant differences were seen in the age or body mass index (BMI) of the subjects at the one year mark. All subjects were part of an ongoing OA study at our institution. 40 subjects (20 healthy, 20 OA) were scanned at baseline, out of which 20 subjects (10 healthy and 10 OA) came back for one year follow up scan. Informed written consent was obtained from all subjects after the nature of the study had been fully explained. The study was approved by and performed in accordance with the rules and regulations of the Committee for Human Research at our institution. To be a part of the study, the OA patients had to be more than 35 years of age, showed frequent clinical symptoms and radiographic signs of OA. The controls were also older than 35 years and without any history of diagnosed OA, had no previous injuries, did not show any clinical OA symptoms or signs of OA on radiographs. In addition, exclusion criteria for all subjects included pain in any lower extremities except knees, a history of lower extremity or spine surgery, total joint replacement of any lower extremity joint, self reported inflammatory arthritis, any conditions limiting the ability to walk and contraindications to MR imaging. Subjects were also asked to complete the Western Ontario and McMasters University (WOMAC) questionnaire to assess pain, stiffness and function through a 100-point scale (21). A score of 100 meant that the subject experienced no pain or stiffness and had a fully functional knee.
Table 1. Subject characteristics for baseline and follow up cohort based on KL and WORMS scoring methods.
Subject characteristics for baseline and follow up cohort based on KL (top) and WORMS (below) scoring method representing mean patient age (standard deviation), number of patients in the group. For longitudinal comparison, only those subjects from baseline were considered who were also a part of one year follow up cohort (n=20 for both)
| Baseline (n=40) | Follow up (n=20) | |||||||
|---|---|---|---|---|---|---|---|---|
| Subject characteristic | Control (n=20) | OA (n=20) | Control (n=10) | OA (n=10) | ||||
| Female | Male | Female | Male | Female | Male | Female | Male | |
| Age (years) | 53.8 (8.3), 12 | 55.1 (9.4), 8 | 60.2 (9.1), 10 | 55.7 (8.9), 10 | 50 (10.8), 7 | 52 (9.1), 3 | 60.6 (2.3), 3 | 53.2 (10.2), 7 |
| BMI (Kg/m2) | 24.5 (4.02) | 25.3 (3.08) | 24.7 (3.49) | 26.8 (1.44) | 24.2 (3.3) | 23.1 (3.4) | 28 (3.3) | 25.9 (1.8) |
| Baseline (n=40) | Follow up (n=20) | |||||||
|---|---|---|---|---|---|---|---|---|
| Knee compartment | Control (n=20) | OA (n=20) | Control (n=10) | OA (n=10) | ||||
| Female | Male | Female | Male | Female | Male | Female | Male | |
| LFC | 58(10.1), 5 | 51.6(6), 3 | 53.8(8.4), 17 | 56.2(8.8), 15 | 51.4(9.1), 7 | 56.1(8.6), 8 | 59.6(8.3), 3 | 49.5(12), 2 |
| MFC | 53.8(7.6), 15 | 55.2(10.2), 10 | 56.8(9.1), 7 | 55.7(7.6), 8 | 51.1(6.1), 6 | 56.3(13.8), 3 | 58(12.6), 4 | 54.1(7.6), 7 |
| PATELLA | 54.5(0.7), 2 | 56.4(8.3), 9 | 54.8(8.4), 20 | 54.4(9.8), 9 | 0 | 55.2(8.8), 5 | 54.2(9.6), 10 | 54.4(10.3), 5 |
| LAT-TIBIA | 55.4(7.7), 15 | 55.6(9.4), 9 | 53.3(9), 7 | 55.2(8.9), 9 | 53.4(9), 5 | 51.7(6.2), 4 | 54.4(10.6), 5 | 56.8(10.6), 6 |
| MED-TIBIA | 53.1(8.6), 16 | 56.2(9.4), 11 | 59.1(3.8), 6 | 54.1(8.6), 7 | 49.8(8.1), 7 | 57(10), 5 | 63.3(2.1), 3 | 52.6(8.5), 5 |
| TROCHLEA | 53.8(9.2), 11 | 54.5(10.2), 11 | 55.7(7), 11 | 56.8(6.7), 7 | 45.5(6), 4 | 55.6(11), 5 | 59.5(6.4), 6 | 54(7.9), 5 |
MR Imaging
All subjects were scanned on a GE wide bore 3T scanner (MR750w) with an 8-channel phased array knee coil (Invivo Corp, Gainesville, FL) using the stimulated echo diffusion sequence. The parameters for the stimulated echo sequence were: number of diffusion sensitizing directions=6, δ (diffusion gradient duration)=4.25ms, Tmix=150ms, total diffusion time (Δ)=155ms, b0-value=0.86sec/mm2, b-value=260.4sec/mm2, maximum gradient amplitude=3.3×10⁻⁵T/mm, TR=7.7ms, TE=13.4ms and scan time=6:40 minutes. To maintain stimulated echo behavior, the non-diffusion weighted image (b0=0.86sec/mm2) was acquired with very small diffusion gradients (amplitude 0.25×10⁻⁵T/mm). Further sequence (acquisition) parameters were: image matrix=256×128, field of view=14×14cm, bandwidth=62.5kHz, slice thickness=4mm, TE=3.6ms, TR=8.1ms, number of slices=22, views per segment=48. GRAPPA (generalized Autocalibrating partially parallel acquisition) with a phase acceleration factor of 2 was used. For morphological assessment of knee cartilage, separate oblique sagittal images were obtained using a 3D fast spin echo (FSE) sequence with variable flip angle (commercial name CUBE). The sequence parameters for this sequence were: image matrix=512×512, number of slices=248, field of view=14×14cm, number of excitations (NEX)=0.5, bandwidth=50kHz, slice thickness=0.5mm, TE=26ms, TR=1500ms.
Image Analysis
The articular cartilage was semi-automatically segmented on the non-diffusion weighted (b0) image of the STEMAPSS sequence using an image processing program developed in Matlab (The Mathworks Inc., Natick, MA) (22). The cartilage was divided into six compartments namely, lateral femoral condyle (LFC), medial femoral condyle (MFC), patella, trochlea, lateral tibia (LT) and medial tibia (MT) as shown in Figure 2. To minimize error due to patient motion, diffusion-weighted images were rigidly registered to the non-diffusion weighted (b0) image acquired in the same examination using the VTK CISG Registration Toolkit (Kitware Inc., Clifton Park, NY). For quantitative analysis, 3–5 slices in tibial and femoral compartments and 7–10 slices in the trochlea and patella regions were segmented. The MD and FA values were calculated using a custom non-linear diffusion tensor-fitting algorithm written in Matlab (The Mathworks Inc., Natick, MA).
Figure 2.
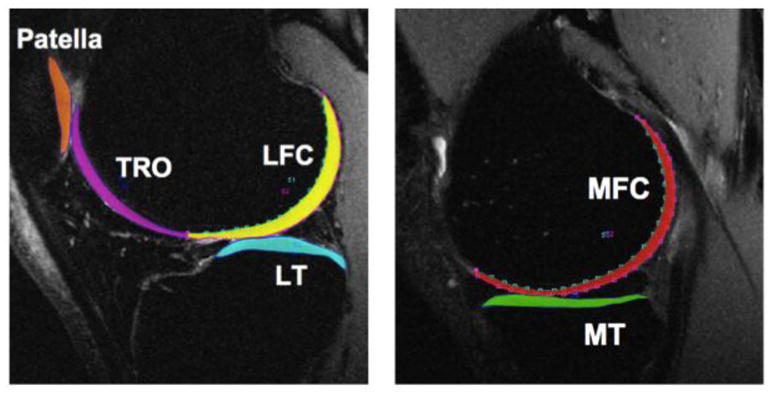
Example of cartilage segmentation used for quantitative analysis on a representative 3D fast spin echo (CUBE) sequence image. Colors indicate different cartilage regions. TRO: trochlea (purple), LFC: lateral femoral condyle (yellow), LT:lateral tibia (teal), MFC: medial femoral condyle (red), MT:medial tibia (green) and patella (orange).
For morphological assessment of the knee cartilage, two scoring systems were used. One was performed using the radiographic (x-rays) and second using MR images by two experienced radiologists. The radiographic images were graded using the Kellgren-Lawrence (KL) grading system and the MR knee images obtained with the CUBE sequence were graded using the modified Whole Organ Magnetic Resonance Imaging Score (WORMS) classification (23,24). Cartilage lesions were assessed using WORMS for each of the six knee compartments with the highest grade recorded for each compartment. Cartilage was graded as: 0: normal signal and thickness; 1:alteration in signal intensity and normal thickness; 2: partial thickness focal defect less than 1 cm in width; 2.5: full thickness focal defect less than 1 cam width; 3: multiple areas of partial thickness focal defects mixed with areas of normal thickness or a grade 2 defect wider than 1 cm but less than 75% of the region; 4: diffuse partial thickness loss (>75% of the region); 5: multiple areas of full thickness cartilage loss less than 1 cm or a full thickness lesion greater than 1m but less than 75% of the region; 6: diffuse full thickness cartilage loss (>75%). KL 0 and 1 and WORMS score of 0 was considered healthy and considered separately from those with KL score ≥ 2 and WORMS > 0. Since the scoring criteria for both systems are different, the KL scored group was different from the WORMS group, for example, the subjects classified as healthy in KL group were not necessarily classified as healthy according to WORMS and vice versa (Table 2). The full thickness diffusion measurement (MD and FA) values were compared with a 2-tailed t-test.
Table 2.
Table showing the distribution of subjects classified according to the KL and WORMS scoring for each of the six compartments at baseline (n=40) and one year follow up cohort (n=20).
| Knee Compartments | KL Healthy/WORMS Healthy | KL Healthy/WORMS OA | KL OA/WORMS Healthy | KL OA/WORMS OA | ||||
|---|---|---|---|---|---|---|---|---|
| Baseline | Follow up | Baseline | Follow up | Baseline | Follow up | Baseline | Follow up | |
| LFC | 19 | 9 | 1 | 1 | 13 | 6 | 7 | 4 |
| MFC | 15 | 5 | 5 | 5 | 10 | 4 | 10 | 6 |
| Patella | 7 | 2 | 13 | 8 | 4 | 3 | 16 | 7 |
| Tibia-lateral | 13 | 4 | 7 | 6 | 11 | 5 | 9 | 5 |
| Tibia-medial | 17 | 8 | 3 | 2 | 10 | 4 | 10 | 6 |
| Trochlea | 15 | 5 | 5 | 5 | 7 | 4 | 13 | 6 |
Reproducibility
To assess the reproducibility, five healthy volunteers (1 female aged 24 years, 4 males aged between 24–37 years) were imaged twice in the same session, with a break between the two scanning sessions in which the volunteer was asked to walk for 5 minutes before getting back in the scanner for the second scan. Scanning was done on the same wide bore 3T MR750w GE scanner using the same imaging parameters as used to image the study cohort. Reproducibility of MD and FA values for each of the six knee compartments was calculated as root mean square average of the coefficient of variation (RMS-CV) across the five volunteers.
Laminar analysis and regional variation in diffusion
In order to perform the laminar analysis of both MD and FA values for baseline and follow up cohorts, cartilage from all compartments was divided into two layers, deep (closest to the subchondral bone) and superficial (closer to articular surface), using custom Matlab software (25). For the laminar analysis, the deep (bone-cartilage layer) and the superficial (articular) layer MD and FA values were evaluated and compared using 2-tailed t-test. Analysis was done for all the six knee compartments and statistical significance was set at p values ≤0.05.
Results
In-vivo diffusion in cartilage
Qualitative Visualization
Representative diffusion weighted images with the overlaid MD and FA maps of a healthy volunteer and OA subject (KL2) are shown in Figure 3. For these set of images, higher MD and lower FA diffusion values can be seen in regions of cartilage damage of the OA patient compared to healthy control.
Figure 3.
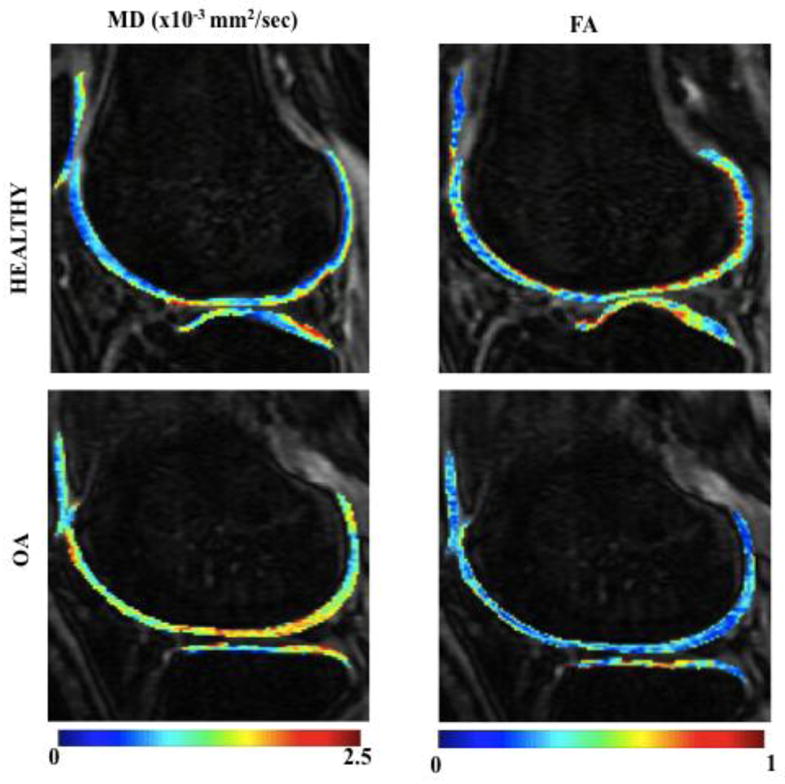
Representative knee MRI images obtained using STEMAPSS sequence of lateral region in a healthy (KL0) and OA (KL score 2) subject with MD and FA colormap overlaid are shown. The colorbar indicates MD values from 0–2.5(x10−3mm2/sec) and FA values from 0–1. The high MD and low FA diffusion values can be seen in regions of cartilage degeneration in OA subject compared to healthy control.
Quantitative visualization
The MD and FA values (means ± standard deviations) of baseline (n=40, 20 healthy, 20 OA) subjects classified according to KL and WORMS (Figure 4a and b respectively) are shown. In the baseline cohort, based on the KL scoring, the MD values of all compartments were higher in OA subjects (KL≥2) except lateral tibia values, which did not show any increase or decrease. Significant increase (p≤0.05) was seen in LFC, patella and trochlea of OA subjects compared to healthy subjects (KL0 and 1) with the MFC approaching significance (p=0.06). The FA values of the OA patients did not decrease and were not significantly different compared to healthy controls in any knee compartment. In the follow up (n=20, 10 healthy, 10 OA) cohort, similar trends were observed. The MD values were higher but not significantly higher in OA (KL≥2) subjects compared to healthy controls in all six compartments except for the lateral tibia. FA values, except for LFC did not decrease in subjects with higher KL scores and were not significantly different from the healthy control values for any of the compartments.
Figure 4.
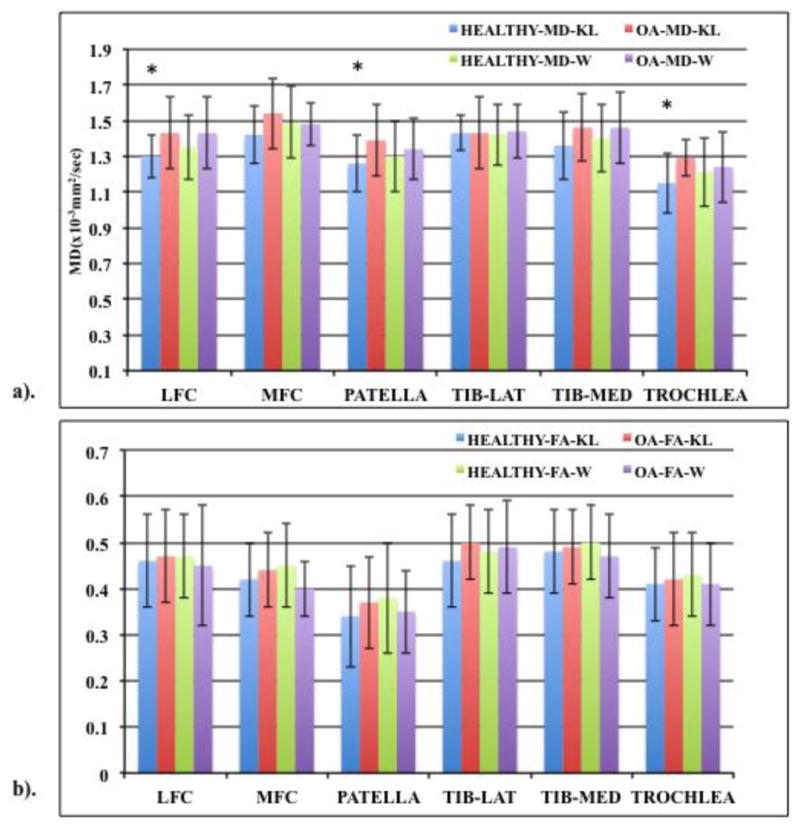
Bar graph showing (a) MD and (b) FA values (means ± standard deviation in the form of error bars) of healthy (KL 0 and 1, WORMS 0) and OA subjects (KL≥2, WORMS≥1) in the six knee cartilage compartments based on KL and WORMS scoring at baseline. MD and FA values of KL and WORMS dataset represented by ‘KL’ and ‘W’ respectively. Based on 40 subjects (20 healthy, 20 OA). “*” represents significance (p<0.05).
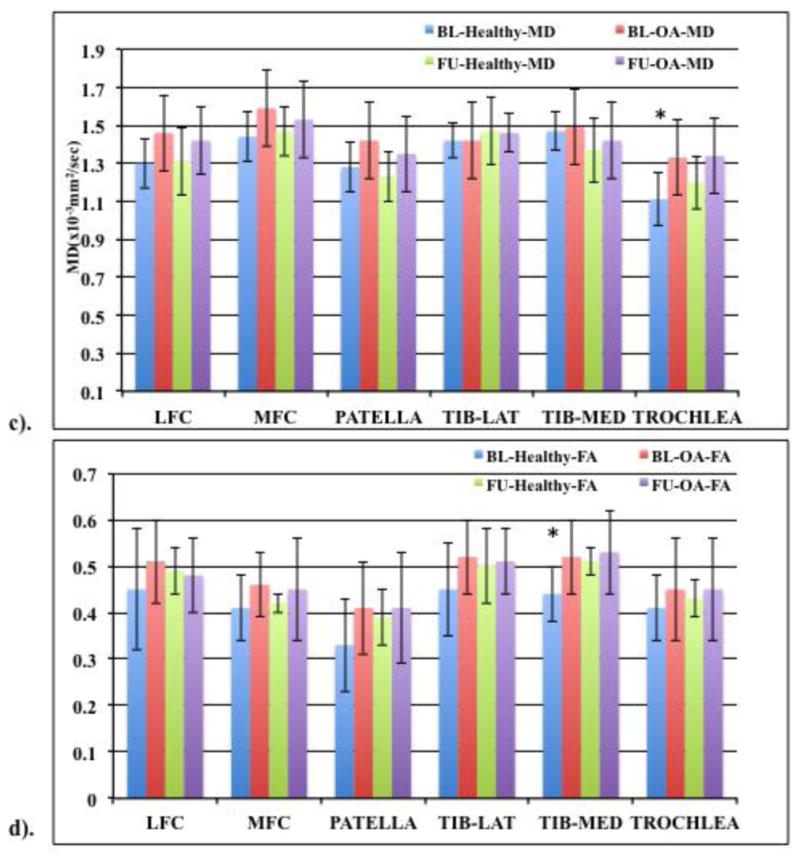
(c) MD and (d) FA values (means ± standard deviations in the form of error bars) of healthy (KL 0 and 1) and OA subjects (KL≥2). Based on 20 (10 healthy, 10 OA) baseline (BL) and follow up (FU) subjects. “*” represents significance (p<0.05).
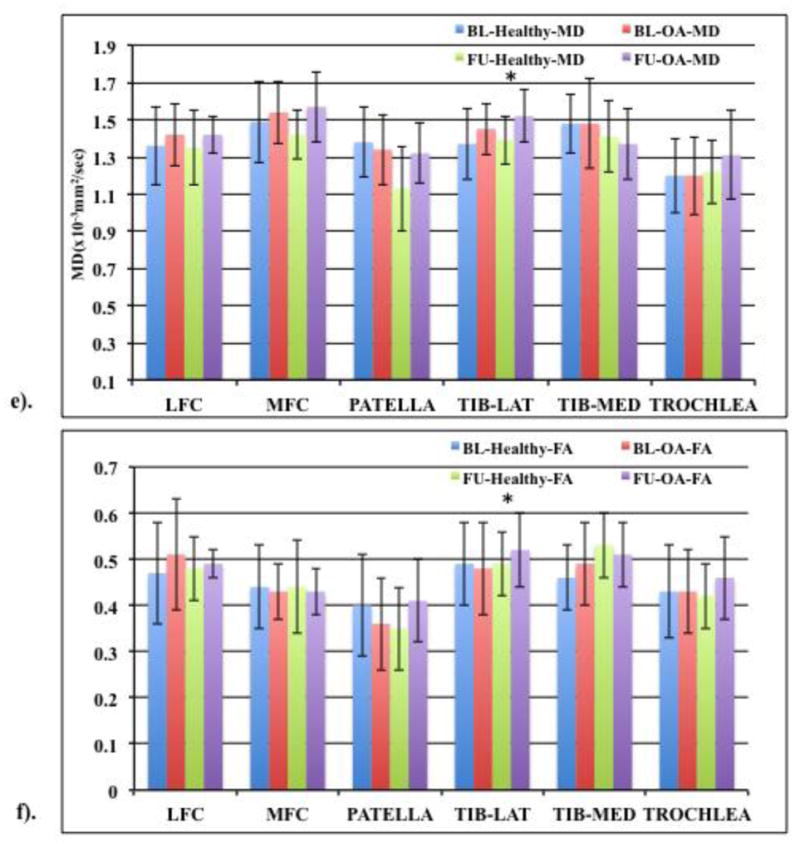
(e) MD and (f) FA values (means ± standard deviations in the form of error bars) of healthy (WORMS 0) and OA subjects (WORMS≥1). Based on 20 (10 healthy, 10 OA) baseline (BL) and follow up (FU) subjects. “*” represents significance (p<0.05).
Figure 4(c &d) shows MD and FA values when comparing only those baseline subjects that were also included in the follow up cohort (n=20, 10 healthy and 10 OA in both cohorts) based on KL scores. For these cohorts, higher OA MD values were seen at both baseline and one year except for lateral tibia which showed no change at both time points. Compared to healthy controls, trochlea MD values were significantly higher (p=0.01) in OA subjects at baseline with the LFC and MFC approaching significance (p=0.07 and 0.08 respectively). FA values did not decrease at both time points expect for one year LFC OA FA value which was slightly lower compared to healthy controls. When comparing the baseline healthy controls with the follow up OA subjects, higher MD values were observed for all compartments except in the medial tibia. No significant differences were observed between the two cohorts except for trochlea (p=0.02), with the LFC approaching significance (p=0.09). The FA values did not decrease with higher KL scores after one year compared to baseline healthy control. Significant differences were observed between follow up OA and healthy baseline control FA value for the medial tibia (p=0.01) compartment.
For the same cohorts, the cartilage MD and FA values based on WORMS score were also compared. In the baseline cohort (n=40) a trend of higher MD and lower FA values was observed for all knee compartments except for the MD MFC and lateral tibia region for FA (Figure 4a and b) Additionally, MFC FA value of subjects with lesions was observed approaching significance (p=0.08) compared to healthy controls. In the follow up cohort (n=20), MD values were generally higher in the subjects with lesions compared to healthy controls except for the medial tibia compartment. The lateral tibia MD value was significantly higher (p=0.05) in OA subjects with the MFC approaching significance (p=0.07). MFC FA value was lower in the OA subjects compared to healthy controls but were not significantly different for any of the compartments.
Figure 4(e & f) shows MD and FA values when comparing only those baseline subjects that were also included in the follow up cohort (n=20, 10 healthy and 10 OA in both cohorts) based on WORMS scores. Higher OA MD values were seen in LFC, MFC and lateral tibia compared to healthy controls at baseline and all compartments except medial tibia in the follow up cohort. Lateral tibia MD values were significantly different (p=0.05) in subjects with lesions compared to those without lesions at both baseline and after one year with the MFC approaching significance (p=0.07) in the follow up cohort. Compared to healthy controls, lower FA values were seen in the MFC, patella and lateral tibia compartments of OA subjects at baseline and in the MFC and medial tibia compartments at one year mark. When comparing the baseline healthy controls with the follow up OA subjects, higher MD values were observed for all compartments except medial tibia and patella. For MD values, no significant differences were observed between baseline healthy and follow up OA subjects for any of the compartments except lateral tibia (p=0.05). The FA values did not decrease with higher WORMS scores except for the MFC compartment and no significant differences were observed between baseline healthy and follow up OA subjects for any of the compartments.
Reproducibility
The reproducibility results for MD diffusion values had RMS-CVs ranging from 4–10% and 6–17% for FA diffusion values across the six knee compartments. The global reproducibility RMS-CV values, which is the average of MD and FA RMS-CV values across all six knee compartments was 6.5% and 11.6% for MD and FA respectively.
Laminar Analysis and regional variation in diffusion
Laminar analysis results are shown as bar graphs in Figure 5a and b. In our analysis of the entire baseline and follow up patient cohort (n=40 and 20 respectively), MD values increased and FA values decreased going from bone-cartilage to the articular layer. The bone layer MD and FA values were significantly different from the articular layer MD (p<0.0001) and FA (p<0.05) values for all the six knee compartments for both the baseline and follow up cohorts except for the baseline trochlea FA values, which approached significance (p=0.07). In addition, when the baseline and follow up healthy and OA subjects classified separately according to KL scores, the same trend of MD values increasing and FA values decreasing going from the bone-cartilage to the articular layer was seen. For baseline patient cohort (n=20 healthy, 20 OA subjects) the bone layer MD and FA values were significantly different from the articular layer MD (p<0.005 for healthy and p<0.01 for OA subjects) and FA (p<0.01 for healthy and p<0.02 for OA subjects) values for all the six knee compartments except for the patella FA values for healthy subjects and OA trochlea FA values. For the follow up patient cohort (n=10 healthy, 10 OA subjects) as well, the bone layer MD and FA values were significantly different from the articular layer MD and FA values (p<0.01 for healthy and OA subjects) for all the six knee compartments except for the OA patella with the healthy trochlea values approaching significance (p=0.08).
Figure 5.
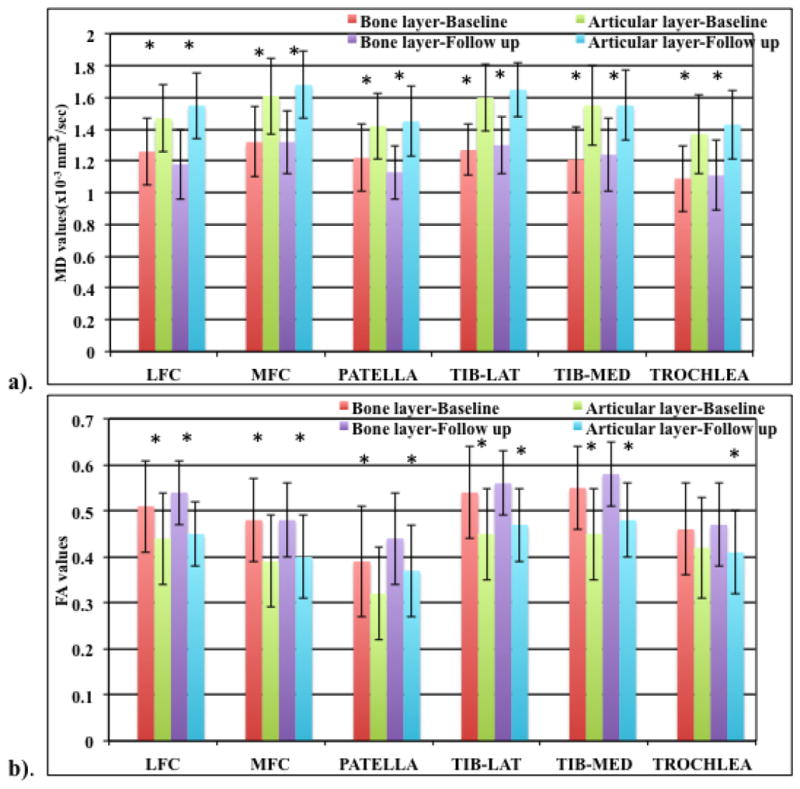
Bar graph showing a). MD and b). FA (means ± standard deviations in the form of error bars) laminar analysis results for the bone and articular layer for baseline and follow up patient cohort “*” represents significance (p<0.05).
Discussion
In this study, a stimulated echo diffusion preparation sequence with 3D segmented spoiled gradient echo acquisition scheme for in vivo diffusion imaging of healthy subjects and knee OA patients at 3T at baseline and one year mark is investigated. Sequences for diffusion imaging of knee have been proposed in the past, but require long acquisition times and images often suffer from artifacts. Diffusion imaging of knee is technically challenging since the cartilage tissue has a short T2 and the diffusion gradients increase TE and motion sensitivity. These difficulties have been overcome by using a stimulated echo preparation and variable flip angle MAPSS acquisition.
Stimulated echo preparation has already been shown to provide high signal to noise ratio (SNR) in muscle, which has a short T2 (15). In stimulated echo preparations, relaxation dependent signal losses are lower in the mixing time interval (Tmix, which is T1 sensitive) compared to that in echo-time (TE, which is T2 sensitive) for tissue with short T2 and long T1 relaxation times, such as cartilage (13,26,27,28). The diffusion preparation is added to the MAPSS acquisition provides consistent signal preparation across different repetition time (TR) periods to prevent T1 and T2 contamination and allows for efficient k-space acquisition (18).
Our scan time (6:40 minutes for 6 directions, 22 slices, including a non-diffusion weighted and diffusion weighted scans) is significantly less than the acquisition time of the sequences that have been proposed in the past including steady state DWI sequence (13), double echo steady state (DESS) sequence (11) and the line scan diffusion sequence (8).
The in-vivo MD and FA values reported are similar to values obtained with other sequences used in knee imaging (8,11,12). In this study, we have considered KL and WORMS scoring systems to classify the baseline and follow up cohorts. The scoring criteria for both these systems are different because KL uses radiographic evidence and WORMS scoring is compartment wise based on MR images. Thus the KL segregated group may have a different cohort compared to WORMS group depending on the definition of OA. Baseline in-vivo quantitative analysis shows that the MD values were generally higher with increased KL. Compared to the healthy subjects the LFC, patella and trochlea MD values were significantly increased in OA subjects (KL≥2) at baseline (n=40). At one year follow up (n=20), higher MD values were seen in the subjects with higher KL scores. In the same baseline cohort based on WORMS scoring, higher MD and lower FA values were observed in the subjects with lesions compared to healthy controls except for MD MFC and lateral tibia FA values. Although lower FA values were observed in OA subjects in some compartments, no significant differences were seen in the FA values between the healthy and OA subjects in any of the compartments at baseline and after one year for both scoring systems. Increase in MD values is seen as an indication of proteoglycan depletion and is an early indication of OA (8,29). Few research studies in the past have shown FA to be useful for reflecting cartilage damage. Raya et al have shown lower FA values in OA subjects compared to healthy controls in-vivo at 7T and ex-vivo at 17.6T, but observed no significant difference in KL score 1–3 group. Additionally, although diagnosis of OA is possible, it is difficult to estimate the extent of degeneration caused by OA just by studying FA values (29).
For further analysis, we compared only those subjects from baseline who were also scanned at the one year mark as part of the follow up cohort (both n=20). Although, the MD values were higher with increased KL scores in the follow up OA subjects compared to baseline healthy controls, they were not significantly different for any of the compartments except trochlea. Subjects with higher KL scores at one year mark did not show lower FA values compared to baseline controls and the medial tibia FA value was significantly different between the two cohorts. Motion induced phase errors, partial volume effects and a smaller dataset could explain this. In the dataset classified according to WORMS scoring, MD values were generally higher in follow up OA subjects compared to baseline healthy controls and were significantly different for lateral tibia compartment. FA values were not lower in the follow up OA subjects (except for MFC) and were not significantly different for any of the compartments. A small sample size and an uneven distribution of healthy and OA subjects in each of the knee compartments in WORMS dataset may explain these results. Also, due to the small sample size, only a few subjects progressed to OA in one year from being healthy at baseline (none in KL, 1 subject each in the lateral tibia, patella, MFC and trochlea compartment in the WORMS dataset). It would be interesting to perform a progression study in the future. Lastly, although our reproducibility sample size was relatively small, the MD and FA reproducibility values were similar to previously reported values (8).
One of the interesting findings of this study was the laminar analysis. In previous T2 and T1ρ imaging studies, the sensitivity of laminar analysis showing significant changes between the bone and articular layers, correlating with the structural differences between the two layers has been established (30, 31). Recently Raya et al have studied laminar analysis of diffusion measurements in full cartilage at 7T (32). However, a longitudinal laminar analysis for the entire cartilage at 3T has not yet been reported in literature. Our laminar analysis results suggest that the cartilage structure is very organized near the bone layer (low MD, high FA) and less organized near the articular surface (high MD, low FA), which has been previously confirmed in histological studies (5,8).
There were some limitations to this study. First, although the signal preparation using the stimulated echo sequence enables longer diffusion times, the stimulated echo preparation eliminates approximately half of the signal. But the low TE offsets this loss in the STEMAPSS sequence, as the relaxation dependent signal losses are lower in the mixing time interval (Tmix, which is T1 sensitive) compared to that in TE (T2 sensitive) for tissues with short T2. The number of diffusion sensitizing directions acquired was limited due to time constraints, which may have resulted in some fitting errors, particularly for the FA measurements. Motion induced phase errors are one of the most limiting factors in diffusion sequences when k-space is acquired over multiple RF excitations. Such phase errors remain a significant limitation in our sequence causing potential signal variations in the acquired images. Additionally, partial volume effects as a result of the slightly low resolution (0.547mm×1.094mm) are also responsible introducing errors in quantitative measurements. Lastly, another limitation of the study is that the b-value (b=260.4 sec/mm2) we used for in-vivo imaging was relatively low. This b-value was chosen to obtain adequate SNR in the cartilage, which has a short T2 while still inducing diffusion weighting. The low b-value may have resulted in less sensitivity to changes in diffusion in vivo, but we have still obtained significant changes in the diffusion values with the current b-value.
In conclusion, in vivo diffusion weighted imaging of knee using stimulated echo-based sequence and MAPSS acquisition at clinical magnetic field strength (3T) is successfully investigated in this study. Significant differences between healthy controls and subjects with OA were seen in MD values, suggesting the use of diffusion as potential tool for early diagnosis of OA. The structural spatial differences in the cartilage using diffusion have also been validated using laminar analysis. Quantitative methods such as diffusion, when used complementarily with standard MR morphological imaging may potentially increase a clinician’s ability to detect subtle early cartilage matrix changes associated with early OA and help them design treatment strategies and follow up accordingly. Our findings are relevant to diagnosis and quantification of cartilage damage in OA and therefore, the STEMAPSS sequence presented here may act as a fast and efficient investigative tool for early diagnosis of knee cartilage degeneration through diffusion imaging at 3T.
Acknowledgments
This work was supported by NIH/NIAMS grants R01AR046905, R01AG017762, and 1F32AR062964.
Abbreviations
- DWI
diffusion weighted imaging
- DTI
diffusion tensor imaging
- STEMAPSS
Stimulated echo with MAPSS: Magnetization prepared angle modulated partitioned k-space sequence
- SPGR
spoiled gradient echo
- Tmix
mixing time interval
- MD
mean diffusivity
- FA
fractional anisotropy
- TE
echo time
- SNR
signal-to-noise ratio
- KL score
Kellgren-Lawrence score
- WORMS
whole organ magnetic resonance imaging score
- MFC
medial femoral condyle
- LFC
lateral femoral condyle
- LT
lateral tibia
- MT
medial tibia
- OA
osteoarthritis
Footnotes
Publisher's Disclaimer: This is a PDF file of an unedited manuscript that has been accepted for publication. As a service to our customers we are providing this early version of the manuscript. The manuscript will undergo copyediting, typesetting, and review of the resulting proof before it is published in its final citable form. Please note that during the production process errors may be discovered which could affect the content, and all legal disclaimers that apply to the journal pertain.
References
- 1.Mankin HJ. The reaction of articular cartilage to injury and osteoarthritis (first of two parts) NEJM. 1974;291:1285–1292. doi: 10.1056/NEJM197412122912406. [DOI] [PubMed] [Google Scholar]
- 2.Filidoro L, Dietrich O, Weber J, Rauch E, Oerther T, Wick M, Reiser M, Glaser C. High resolution diffusion tensor imaging of human patellar cartilage: feasibility and preliminary findings. Magn Reson Med. 2005;53:993–998. doi: 10.1002/mrm.20469. [DOI] [PubMed] [Google Scholar]
- 3.Braun H, Gold G. Advanced MRI of articular cartilage. Imaging Med. 2011;3(5):541–555. doi: 10.2217/iim.11.43. [DOI] [PMC free article] [PubMed] [Google Scholar]
- 4.Shapiro L, Harish M, Hargreaves B, Staroswiecki E, Gold G. Advances in musculoskeletal MRI: Technical considerations. J Magn Reson Imaging. 2012;36:775–787. doi: 10.1002/jmri.23629. [DOI] [PMC free article] [PubMed] [Google Scholar]
- 5.Raya JG, Melkus G, Neumair S, Deitrich O, Mutzel E, Reiser M, Putz R, Kirsch T, Jakob P, Glaser C. Diffusion-Tensor Imaging of Human Articular Cartilage Specimens with Early Signs of Cartilage Damage. Radiology. 2013;266(3):831–841. doi: 10.1148/radiol.12120954. [DOI] [PubMed] [Google Scholar]
- 6.Raya JG, Melkus G, Neumair S, Deitrich O, Mutzel E, Reiser M, Putz R, Kirsch T, Jakob P, Glaser C. Change of diffusion tensor imaging parameters in articular cartilage with progressive proteoglycan extraction. Investig Radiol. 2011;46(6):401–409. doi: 10.1097/RLI.0b013e3182145aa8. [DOI] [PubMed] [Google Scholar]
- 7.Gudbjartsson H, Maier SE, Mulkern RV, Morocz IA, Patz S, Jolesz FA. Line scan diffusion imaging. Magn Reson Med. 1996;36(4):509–519. doi: 10.1002/mrm.1910360403. [DOI] [PubMed] [Google Scholar]
- 8.Raya JG, Horng A, Deitrich O, Krasnokutsky S, Beltran LS, Storey P, Reiser MF, Recht MP, Sodickson DK, Glaser C. Articular cartilage: in vivo diffusion-tensor imaging. Radiology. 2012;262(2):550–559. doi: 10.1148/radiol.11110821. [DOI] [PubMed] [Google Scholar]
- 9.McNab JA, Miller KL. Steady-state diffusion-weighted imaging: theory, acquisition and analysis. NMR Biomed. 2010;23(7):781–793. doi: 10.1002/nbm.1509. [DOI] [PubMed] [Google Scholar]
- 10.Le Bihan D, Poupon C, Amadon A, Leithimonnier F. Artifacts and pitfalls in diffusion MRI. J Magn Reson Imaging. 2006;24(3):478–488. doi: 10.1002/jmri.20683. [DOI] [PubMed] [Google Scholar]
- 11.Bieri O, Ganter C, Scheffler K. Quantitative In Vivo Diffusion Imaging of Cartilage Using Double Echo Steady-State Free Precession. Magn Reson Med. 2012;68:720–729. doi: 10.1002/mrm.23275. [DOI] [PubMed] [Google Scholar]
- 12.Staroswiecki E, Granlund KL, Alley MT, Gold G, Hagreaves B. Simultaneous estimation of T(2) and apparent diffusion coefficient in human articular cartilage in vivo with a modified three-dimensional double echo steady state (DESS) sequence at 3 T. Magn Reson Med. 2012;67(4):1086–1096. doi: 10.1002/mrm.23090. [DOI] [PMC free article] [PubMed] [Google Scholar]
- 13.Miller KL, Hargreaves B, Gold G, Pauly J. Steady-state diffusion-weighted imaging of in vivo knee cartilage. Magn Reson Med. 2004;51(2):394–398. doi: 10.1002/mrm.10696. [DOI] [PubMed] [Google Scholar]
- 14.Schick F. Signal losses in diffusion preparation: comparison between spin-echo, stimulated echo and SEASON. Magn Reson Mat in Phy, Biol and Med. 1998;6(1):53–61. doi: 10.1007/BF02662512. [DOI] [PubMed] [Google Scholar]
- 15.Karampinos DC, Banerjee S, King KF, Link TM, Majumdar S. Considerations in high-resolution skeletal muscle diffusion tensor imaging using single-shot echo planar imaging with stimulated-echo preparation and sensitivity encoding. NMR Biomed. 2012;25(5):766–778. doi: 10.1002/nbm.1791. [DOI] [PMC free article] [PubMed] [Google Scholar]
- 16.Hiepe P, Herrmann KL, Gullmar D, Ros G, Siebert T, Blickhan R, Hahn K, Reichenbach JR. Fast low angle shot diffusion tensor imaging with stimulated echo encoding in the muscle of rabbit shank. NMR Biomed. 2014;27(2):146–157. doi: 10.1002/nbm.3046. [DOI] [PubMed] [Google Scholar]
- 17.Frangonas E, Mylnarik V, Jellus V, Micali F, Piras A, Toffanin R, Rizzo R, Vittur F. Correlation between biochemical compostion and magnetic resonance appearance of articular cartilage. Osteoarthr Cartil. 1998;6:24–32. doi: 10.1053/joca.1997.0089. [DOI] [PubMed] [Google Scholar]
- 18.Li X, Han ET, Busse RF, Majumdar S. In vivo T1ρ mapping in cartilage using 3D magnetization-prepared angle-modulated partitioned k-space spoiled gradient echo snapshots (3D MAPSS) Magn Reson Med. 2008;59(2):298–307. doi: 10.1002/mrm.21414. [DOI] [PMC free article] [PubMed] [Google Scholar]
- 19.Li X, Wyatt C, Rivoire J, Han E, Chan W, Schooler J, Liang F, Shet K, Souza R, Majumdar S. Simultaneous acquistion of T1ρ and T2 quantification in knee cartilage: Repeatibility and diurnal variation. J Reson Magn Imaging. 2013;00:00–00. doi: 10.1002/jmri.24253. [DOI] [PMC free article] [PubMed] [Google Scholar]
- 20.Kellgren J, Lawrence J. Radiologic assessment of osteoarthritis. Ann Rheum Dis. 1957;16:494–501. doi: 10.1136/ard.16.4.494. [DOI] [PMC free article] [PubMed] [Google Scholar]
- 21.Souza R, Feeley B, Zarins Z, Link T, Li X, Majumdar S. T1rho relaxation in knee OA subjects with varying sizes of cartilage lesions. The knee. 2013;20:113–119. doi: 10.1016/j.knee.2012.10.018. [DOI] [PMC free article] [PubMed] [Google Scholar]
- 22.Carballido-Gamio J, Bauer J, Stahl R, Lee K, Krause S, Link T, Majumdar S. Intersubject comparison of MRI knee cartilage thickness. Med Image Anal. 2008;12(2):120–135. doi: 10.1016/j.media.2007.08.002. [DOI] [PMC free article] [PubMed] [Google Scholar]
- 23.Peterfy CG, et al. Whole-Organ Magentic Resonance Imaging Score (WORMS) of the knee in osetoarthritis. Osteoarthr Cartil. 2004;12:177–190. doi: 10.1016/j.joca.2003.11.003. [DOI] [PubMed] [Google Scholar]
- 24.Prasad AP, Nardo L, Schooler J, Joseph GB, Link TM. T1rho and T2 relaxation times predict progression of knee osteoarthritis. Osteoarthr Cartil. 2013;21(1):69–76. doi: 10.1016/j.joca.2012.09.011. [DOI] [PMC free article] [PubMed] [Google Scholar]
- 25.Carballido-Gamio J, Stahl R, Blumenkrantz G, Romero A, Majumadar S, Link T. Spatial Analysis of magnetic resonance T1ρ and T2 relaxation times improves classification between subjects with and without osteoarthritis. Med Phys. 2009;36(9):4059–4067. doi: 10.1118/1.3187228. [DOI] [PMC free article] [PubMed] [Google Scholar]
- 26.Bammer R. Basic principles of diffusion-weighted imaging. Eur J Radiol. 2003;45(3):169–184. doi: 10.1016/s0720-048x(02)00303-0. [DOI] [PubMed] [Google Scholar]
- 27.Steidle G, Schick F. Echoplanar diffusion tensor imaging of the lower leg musculature using eddy current nulled stimulated echo preparation. Magn Reson Med. 2006;55(3):541–548. doi: 10.1002/mrm.20780. [DOI] [PubMed] [Google Scholar]
- 28.Gibbs SJ, Johnson CS., Jr A PFG NME Experiment for accurate diffusion and flow studies in the presence of eddy currents. J Magn Reson Imaging. 1991;93:395–402. [Google Scholar]
- 29.Ukai T, Sato M, Yamashita T, Imai Y, Mitani G, Takagaki T, Serigano K, Mochida J. Diffusion tensor imaging can detect early stages of cartilage damage: an early study. BMC Musculoskelet Disord. 2015;16:35. doi: 10.1186/s12891-015-0499-0. [DOI] [PMC free article] [PubMed] [Google Scholar]
- 30.Carballido-Gamio J, Blumenkrantz G, Lynch J, Link T, Majumdar S. Longitudinal Analysis of MRI T2 knee cartilage Laminar Organization in a Subset of Patients from the Osteoarthritis Initiative. Magn Reson Med. 2010;63:465–472. doi: 10.1002/mrm.22201. [DOI] [PMC free article] [PubMed] [Google Scholar]
- 31.Li X, Pai A, Blumenkrantz G, Gamio J, Link T, Ma B, Ries M, Majumdar S. Spatial distribution and relationship of T1ρ and T2 relaxation times in knee with osteoarthritis. Magn Reson Med. 2009;61(6):1310–1318. doi: 10.1002/mrm.21877. [DOI] [PMC free article] [PubMed] [Google Scholar]
- 32.Raya JG, Dettmann E, Notohamiprodjo M, Krasnokutsky S, Abramson S, Glaser C. Feasibiltiy of in vivo diffusion tensor imaging of articular cartilage with coverage of all cartilage regions. Eur Radiol. 2014;24(7 ):1700–6. doi: 10.1007/s00330-014-3155-4. [DOI] [PubMed] [Google Scholar]