Abstract
Background
Brown adipose tissue (BAT) consumes glucose when it is activated by cold exposure, allowing its detection in humans by 18-F fluorodeoxyglucose positron emission tomography with computed tomography (18F-FDG PET-CT). We recently described a novel non-invasive and non-ionizing imaging method to assess BAT in mice using contrast enhanced ultrasound (CEUS). Here, we report the application of this method in healthy humans.
Methods
Thirteen healthy volunteers were recruited. CEUS was performed before and after cold exposure in all subjects using a continuous intravenous infusion of perflutren gas filled lipid microbubbles and triggered imaging of the supraclavicular space. The first 5 subjects received microbubbles at a lower infusion rate than the subsequent 8 subjects, and are analyzed as a separate group. Blood flow was estimated by the product of the plateau (A) and the slope (β) of microbubble replenishment curves. All underwent 18F-FDG PET-CT after cold exposure.
Results
An increase in the acoustic signal was noted in the supraclavicular adipose tissue area with increasing triggering intervals in all subjects, demonstrating the presence of blood flow. The area imaged by CEUS co-localized with BAT, as detected by 18F-FDG PET-CT. In a cohort of 8 subjects with an optimized CEUS protocol, CEUS-derived BAT blood flow increased with cold exposure compared to basal BAT blood flow in warm conditions (Aβ 3.3 [0.5–5.7] AU/s vs. 1.25 [0.5–2.6] AU/s; p=0.02). Of these 8 subjects, 5 had a >2-fold increase in their blood flow after cold exposure; these responders had higher BAT activity measured by 18F-FDG PET-CT (SUVmax 2.25 [1.53–4.57] vs. 0.51 [0.47–0.73]; p=0.02).
Conclusions
The present study demonstrates the feasibility of using CEUS as a non-invasive, non-ionizing imaging modality in estimating BAT blood flow in young, healthy humans. CEUS may be a useful and scalable tool in the assessment of BAT and BAT-targeted therapies.
Keywords: Brown adipose tissue, contrast-enhanced ultrasound, imaging, positron-emission tomography, activation
Introduction
Brown adipose tissue (BAT) is a highly vascularized, mitochondria-rich type of adipose tissue characterized by the presence of the uncoupling protein 1 (UCP1) in its mitochondria [1, 2]. UCP1 separates mitochondrial respiration from adenosine triphosphate (ATP) production and allows protons produced by fatty acid and glucose oxidation to re-enter the mitochondrial matrix and generate heat rather than ATP [for a Review, see 3]. This process, utilized mainly for non-shivering thermogenesis, is a highly efficient method of energy conversion. Therefore, the study of BAT has generated high interest, as a target for the treatment of disorders such as obesity [4, 5]. Brown adipose tissue is abundant in rodents, and its thermogenic ability has been documented for decades. Until recently, it was assumed that humans possessed functional BAT only in infancy and that it was absent later in life [6]. This assumption has been challenged by 18F-fluorodeoxyglucose (18F-FDG) studies demonstrating FDG uptake in the supraclavicular space, paravertebral regions, and perivascular tissue surrounding the neck vessels in adults that increases when the subjects are exposed to cold [7–10]. Tissue analysis from these regions demonstrates the presence of BAT [10].
The detection of BAT in vivo in humans remains challenging. Positron-emission tomography (PET) [7–10] and, more recently, near infra-red spectroscopy (NIRS) [11] and MRI [12] have been used to non-invasively assess BAT. Each non-invasive modality has somewhat unfavorable features, such as accuracy, accessibility, exposure to ionizing radiation or cost. Presently, 18F-FDG positron emission tomography with computed tomography (18F-FDG PET-CT) is the only widely-used non-invasive imaging modality that identifies BAT in adult humans. An inexpensive, widely accessible, non-ionizing, non-invasive, in vivo technique that would allow the detection of BAT and assess its response to stimuli is very desirable in order to repeatedly assess BAT activation in response to potential therapies or interventions.
BAT is perfused by a rich network of vessels [13, 14], and activation of BAT is associated with increased blood flow to the tissue [15–17]. These characteristics may be utilized to detect BAT, and to assess its response to external stimuli. As perfusion is tightly regulated to respond to the oxygen demand of tissues, one can anticipate that increased BAT metabolism is mirrored by increased BAT perfusion. Therefore, the assessment of BAT perfusion can be used to evaluate the degree of activation of BAT. Contrast enhanced ultrasound (CEUS) is a non-ionizing, non-invasive imaging modality that has been used extensively to estimate perfusion, in particular in the myocardium [18–20]. More recently, investigators have reported the utility of CEUS in determining muscle microvascular responses to physiologic stimuli [21, 22]. We have recently demonstrated that CEUS of BAT blood flow can detect BAT and estimate its mass and activation in mice [23, 24].
The present study investigates the potential of CEUS to assess BAT in adult humans by imaging blood flow in supraclavicular BAT. To evaluate whether CEUS is able to detect BAT, we co-localized the region where blood flow was detected using CEUS with the region of FDG uptake detected by 18F-FDG PET-CT. We then investigated whether CEUS could detect changes in BAT blood flow induced by a known stimulus such as cold exposure. Because BAT blood flow is an important determinant of the delivery of substrates needed for thermogenesis (such as glucose), we also compared the response of BAT blood flow to cold, as assessed by CEUS, to the metabolic activity of BAT after cold exposure, as assessed by FDG uptake on 18F-FDG PET-CT.
Methods
Protocol
The study was approved by the institutional review boards of the Massachusetts General Hospital and the Joslin Diabetes Center, Boston, MA. Healthy male volunteers between the ages of 18 and 30 years of age were recruited. Participants fasted for 8 hours before CEUS was performed. A limited transthoracic echocardiogram was performed upon arrival to identify any potential contraindication for intravenous echocardiographic contrast (patent foramen ovale/intracardiac shunt) and to determine stroke volume (SV). Stroke volume was measured as the product of the left ventricular outflow tract (LVOT) area and the LVOT time velocity integral. Cardiac output was measured by multiplying stroke volume by heart rate.
The subjects underwent CEUS after two hours exposure to room temperature (referred to in this study as “warm conditions”), followed by CEUS after two hours of cold exposure. Cold exposure was obtained by wearing a cooling vest, with circulating water cooled to 13°C. Imaging was performed in the supine position. Perflutren gas-filled lipid microbubbles (Definity®, Lantheus Medical Imaging, N. Billerica, MA) were used for contrast enhancement. The initial cohort (Group 1; lower infusion rate) of 5 subjects received 1.3mL Definity® suspended in 30 mL of 0.9% saline administered over a 15 minute period with CEUS performed as outlined below. A second cohort (Group 2; higher infusion rate) of 8 volunteers underwent a modified CEUS protocol, with a higher infusion rate (1.3mL Definity® suspended in 30 mL 0.9% saline, infused over 5 minutes). In both cohorts, and within 24 hours of the CEUS, a 18F-FDG PET-CT was performed after two hours of cold exposure.
Ultrasound Protocol
Two-dimensional ultrasound (iE33, Philips Medical Systems, Andover, MA) was performed, using a linear array broadband transducer with a range of 3–9 MHz and a transmit frequency of 3.1 MHz. A multi-pulse cancellation technique (Power Modulation) was used. Lower powered pulses induce a linear response from the structures imaged, and higher powered pulses induce a linear response from tissue, and a non-linear response from microbubbles. Subtracting one from the other allows detection of the non-linear behaviour which emanates from the microbubbles [25]. The ultrasound probe was positioned in the right supraclavicular fossa, 2 cm superior to the junction of the medial one-third and lateral two-thirds of the clavicle, to delineate a region of adipose tissue bordered by the lungs inferiorly and posteriorly, the sternocleidomastoid muscle medially and the trapezius muscle laterally (Figure 1, Panels A and B). Color Flow Doppler was used to exclude vascular structures. The focus was set to the middle of the adipose tissue region, which was 1–3 cm below the surface of the skin. The gain was optimized so that sparse echoes could be seen from the muscles fibres and the gain remained unchanged throughout the procedure. Images were recorded at a low MI setting (MI=0.25) for 90 seconds to ensure that the microbubble concentration reached a steady state. The MI was then adjusted to a higher output (MI=1.6). The triggered imaging sequence was then started, with pulse intervals of 0.06s (baseline), 0.25s, 0.5s, 1s, 2s, 3s, 4s, 5s, 7s, 8s and 10s. At least three images were obtained for each interval. The blood pressure and heart rate were recorded before, during, and for 15 minutes after infusion of contrast. Electrocardiographic monitoring was continuously performed during contrast infusion.
Figure 1.
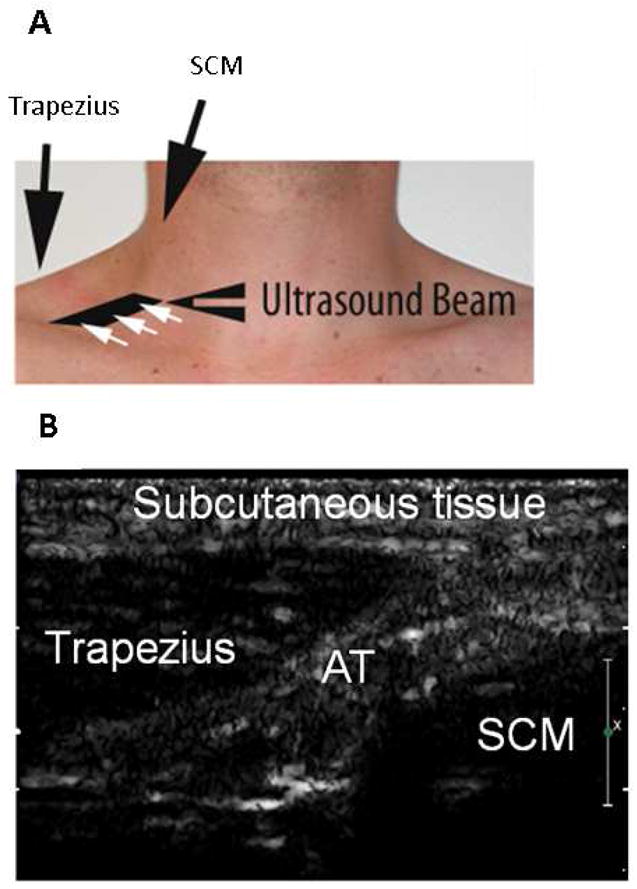
A: Position of ultrasound probe in the right supraclavicular fossa, 2 cm superior to the junction of the medial one-third and lateral two-thirds of the clavicle, allowing imaging of the space between the trapezius and sternocleidomastoid muscle. B: Representative ultrasound image of the supraclavicular fossa. AT: adipose tissue; SCM: sternocleidomastoid.
Ultrasound Analysis
The analysis was performed by an observer blinded to the stage of the protocol. A region of interest (ROI) was traced around the adipose tissue and baseline intensity was measured. The ROI was positioned between the sternocleidomastoid muscle and the trapezius, 1–3 cm below the surface of the skin. The extent of the ROI was determined by the amount of adipose tissue present. This ROI was maintained throughout the pulse sequence and in the warm and cold environments for a given volunteer. The mean signal intensity within the ROI was averaged for each pulse interval. The baseline signal intensity was subtracted from each value and the intensities were plotted on a curve described by the function y = A(1−e−βt), where y is intensity at pulse interval t, A is the plateau intensity (the units of which are Acoustic Units – AU), and β is the rate constant (the units of which are seconds−1) as described previously [18]. Blood flow was estimated by the product of A and β (AU per second).
18F-FDG PET-CT Protocol
18F-FDG PET-CT (Siemens Biograph 64, Siemens, Forcheim, Germany) was performed within 24 hours of the CEUS. All subjects fasted for 8 hours prior to arrival in the Department. Each participant wore a cooling vest with circulating water at 13°C for 60 minutes prior to the intravenous administration of 10mCi 18F-FDG, and continued to wear it for 60 minutes after injection. After 60 minutes of circulation time (2 hours of cold exposure), PET images were acquired in 3D mode starting with a non-contrast CT (120 keV, 50 mAs) for attenuation correction. All subjects were imaged in the supine position. Three bed positions were used, with 15 minutes per bed position.
18F-FDG PET-CT Analysis
18F-FDG PET-CT images were analyzed by an investigator blinded to the subject clinical information.18F-FDG uptake was measured within the right supraclavicular fossa between the sternocleidomastoid and trapezius muscles, 1–3 cm from the skin surface, in an area corresponding to that imaged with CEUS, as described above. Avoiding vascular structures and lymph nodes, an individual volume of interest (VOI) was placed within the supraclavicular fossa to obtain the maximum standardized uptake value (SUVmax). The standard uptake value (SUV) is a unit-less number which describes the decay-corrected tissue concentration of FDG (in kBq/ml) divided by the injected dose per body weight (kBq/g). The average venous blood uptake of the superior vena cava was used to derive a target-to-background ratio (TBR) from the SUVmax as described previously [26].
Statistics
Continuous data are presented as mean ± standard deviation (SD) or median and interquartile range. To determine the intra- and inter-observer variability of the method, five BAT blood flow estimations were performed by two blinded readers (AF and QL). One reader (AF) repeated the measure at least 2 weeks after the first measurement. The difference in measurement between the 2 readers and between the 2 readings of one reader is reported in absolute value and in percentages. Changes in hemodynamic induced by cold were compared using Student t test. Changes in CEUS parameters were compared using Wilcoxon signed rank test. Responders were defined as subjects who increased their BAT blood flow in response to cold by ≥ 2 fold. The comparison of CEUS responders and non-responders to BAT FDG uptake (defined by SUVmax and TBR) was done using Wilcoxon Rank-Sum test. Analysis was performed using JMP, Version 10 (SAS Institute Inc., Cary, NC). A p value ≤0.05 was considered statistically significant.
Results
Population
Thirteen male volunteers (age 24.0 ± 2.4 years, BMI 23.4 ± 3.5 kg/m2), were enrolled in the study.
Proposed BAT detection by CEUS
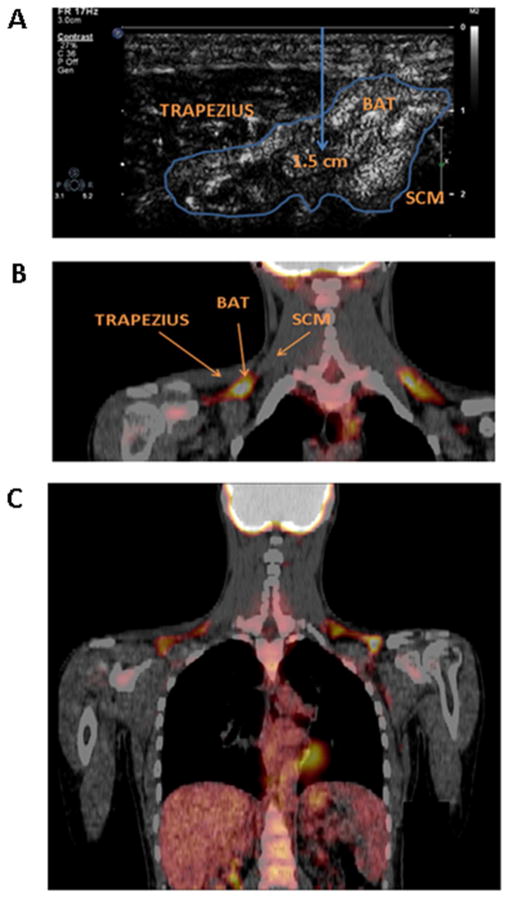
Five subjects underwent CEUS imaging in warm conditions and again after cold exposure (Group 1; lower infusion rate). Cold exposure lowered heart rate, and significantly increased blood pressure (Table 1). During cold exposure, a progressive increase in the acoustic intensity was noted in the adipose tissue area with increasing triggering intervals in all subjects, demonstrating detectable blood flow (Table 2). Sufficient contrast concentration was present in all subjects after cold exposure to allow an exponential curve fitting, therefore allowing an estimation of BAT blood flow. The adipose tissue area visualized on CEUS co-localized with the BAT detected on the 18F-FDG PET-CT (Figure 2). The intra-observer variability of the blood flow measurement was −0.26 ± 16% and the inter-observer variability was −1.78 ± 33%. BAT blood flow in warm conditions could not be reliably detected in Group 1, due to insufficient contrast.
Table 1.
Hemodynamic changes after 2 hours of mild cold exposure in 5 volunteers.
| HR (bpm) | SBP (mmHg) | DBP (mmHg) | |
|---|---|---|---|
| Warm | 63±11 | 106.6 ± 5.0 | 64.4 ± 4.1 |
| Cold | 58±8 | 128.5 ± 11.5† | 81.1 ± 6.0* |
p <0.001 vs. warm,
p<0.005 vs. warm.
bpm: beats per minute; DBP: diastolic blood pressure; HR: heart rate; SBP: systolic blood pressure.
Table 2.
CEUS-estimated BAT blood flow (acoustic intensity per second) for Group 1 volunteers after exposure to cold.
| A (AU) | β (sec−1) | Aβ (AU/s) | |
|---|---|---|---|
| Cold | 5.07 [2.5–9.3] | 0.36 [0.22–0.50] | 1.59 [1.09–2.47] |
BAT: brown adipose tissue; CEUS: contrast enhanced ultrasound.
Figure 2.
A: Representative ultrasound image of brown adipose tissue, located between the trapezius and sternocleidomastoid muscles. The center of the adipose tissue region of interest is approximately 1.5 cm below the skin surface. B: Representative coronal 18F-FDG PET-CT image demonstrating FDG uptake in the region imaged by ultrasound i.e. 2 cm superior to the junction of the medial one third and lateral two thirds of the clavicle, between the trapezius and sternocleidomastoid muscles. C: Representative 18F-FDG PET-CT image of the entire region imaged, demonstrating tracer uptake in the supraclavicular space and in the heart. BAT: brown adipose tissue; SCM: sternocleidomastoid.
Effect of cold exposure on hemodynamic parameters and on blood flow estimated using CEUS
To evaluate whether the BAT blood flow increased with BAT stimulation, eight subjects underwent CEUS before and after cold exposure using a higher contrast infusion rate (Group 2). Cold exposure induced a decrease in heart rate (p<0.001) and cardiac output (p<0.02), and an increase in systolic blood pressure (p<0.02) (Table 3).
Table 3.
Hemodynamic changes after 2 hours of mild cold exposure in 8 volunteers
| HR (bpm) | SBP (mmHg) | DBP (mmHg) | SV (ml/min) | CO (l/min) | |
|---|---|---|---|---|---|
| Warm | 60±10 | 112.6 ± 10.2 | 67.3 ± 4.0 | 74.5±22 | 4.4±1.2 |
| Cold | 50±9* | 119.0 ± 12.3* | 73.5 ± 7.2* | 77.5±21 | 3.8±0.9† |
p <0.001 vs. warm,
p<0.02 vs. warm.
bpm: beats per minute; CO: cardiac output; DBP: diastolic blood pressure; HR: heart rate; SBP: systolic blood pressure; SV: stroke volume.
The CEUS protocol was modified for Group 2, to enhance the detection of BAT blood flow. Using a higher infusion rate (1.3 mL Definity® suspended in 30 mL 0.9% saline, infused over 5 minutes), a plateau in the acoustic intensity was noted 45 ± 10 sec after the initiation of the microbubble infusion in the warm conditions and 43 ± 8 sec after the initiation of the microbubble infusion in the cold conditions (Figure 3). The increase in acoustic intensity with increasing triggering delays was present in all subjects and was sufficient to allow estimation of BAT blood flow both in warm conditions and following cold exposure. All BAT replenishment curves could be fitted to an exponential function (Figure 4). CEUS-estimated BAT blood flow increased significantly following cold exposure (Aβ 3.3 [0.5–5.7] AU/s vs. 1.25 [0.5–2.6] AU/s; p=0.02, Table 4, Figure 5) across the eight subjects. As anticipated, inter-individual variation in the response to cold was observed, which allowed to separate subjects into responders (n=5) and non-responders (n=3), based on an arbitrary relative increase in BAT blood flow of ≥ 2-fold in responders (Table 4). The responders had higher BAT blood flow, both in warm and cold conditions than the non-responders. Blood flow in the trapezius muscle was obtained in all volunteers after cold exposure (Aβ=0.5 [0.25–0.65] AU/s). Blood flow in the trapezius muscle was not obtained in four subjects in warm conditions due to insufficient contrast.
Figure 3.
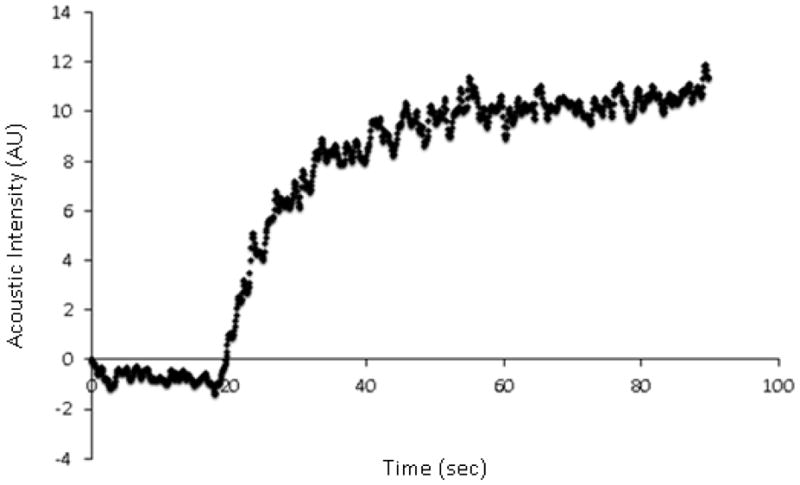
Acoustic intensity (AU) following the administration of perflutren containing lipid microbubbles, demonstrating the plateau being reached after approximately 45 seconds.
Figure 4.
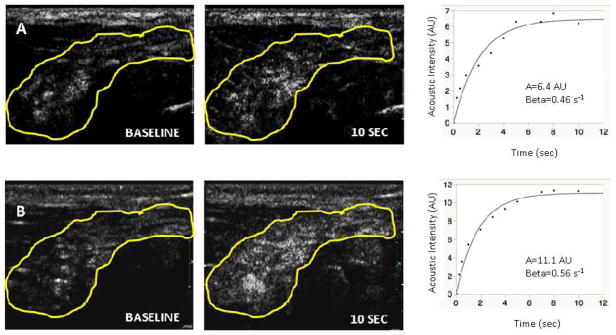
Acoustic intensity measured in adipose tissue region at baseline and at a triggering interval of 10 seconds in warm conditions (Panel A) and cold conditions (Panel B). Corresponding plotted curves of Aβ (AU/sec) are provided for warm conditions and for cold conditions, adjacent to the respective panels.
Table 4.
Effect of cold on BAT blood flow estimated with contrast enhanced ultrasound in 8 volunteers.
| A (AU) | β (s−1) | Aβ (AU/s) | ||
|---|---|---|---|---|
| Warm | 5 [1.7–8.7] | 0.3 [0.2–0.5] | 1.25 [0.5 – 2.6] | |
| Non-Responders n=3 |
2.1 [1.3–6.3] | 0.3 [0.1–0.4] | 0.5 [0.5–0.5] | |
| Responders n=5 |
6.1 [2.6–10.2]† | 0.5 [0.3–0.6]† | 2 [1.3–2.9]† | |
|
| ||||
| Cold | 6.6 [3–11.1] | 0.5 [0.2–0.5] | 3.3 [0.5–5.7]* | |
| Non-Responders n=3 |
2.8 [1.1–3.6] | 0.2 [0.1–0.5] | 0.5 [0.5–0.5] | |
| Responders n=5 |
9.8 [6.6–12.0]*† | 0.6 [0.3–0.9]† | 5.6 [3.2–8.2]*† | |
Median [25–75 percentiles].
p<0.05 vs. warm,
p<0.05 vs. non responders
BAT: brown adipose tissue.
Figure 5.
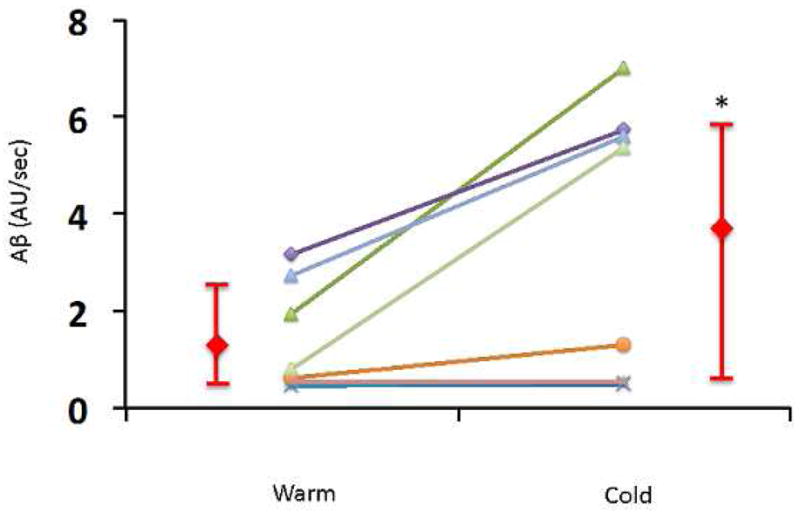
Acoustic intensity per second (Aβ) in each of the eight volunteers in Group 2 during warm conditions and following cold exposure. Data presented individually and as median and interquartile range. *, p=0.03.
Detection of BAT after cold exposure by 18F-FDG PET-CT
The maximum standard uptake value (SUVmax) of the supraclavicular BAT was 1.5 [0.6–2.4] and the TBR was 1.1 [0.5–2.4]. In this small and lean population, there was no correlation between the SUVmax and body mass index (p=0.15).
CEUS-estimated BAT blood flow and BAT activity by 18F-FDG PET-CT
The relationships between CEUS-estimated BAT blood flow and 18F-FDG PET-CT-estimated BAT activity (SUVmax and TBR) were not statistically significant (r2=0.25, p=0.2 and r2=0.28, p=0.2, respectively). However, in those who increased their relative BAT blood flow by ≥2 fold after cold exposure, a higher metabolic activity after cold exposure was observed, as determined by SUVmax (0.51 [0.47–0.73] vs. 2.25 [1.53–4.57]; p=0.02) and TBR (0.36 [0.30–0.42] vs. 1.33 [0.94–3.13]; p=0.02) measured by 18F-FDG PET-CT (Figure 6).
Figure 6.
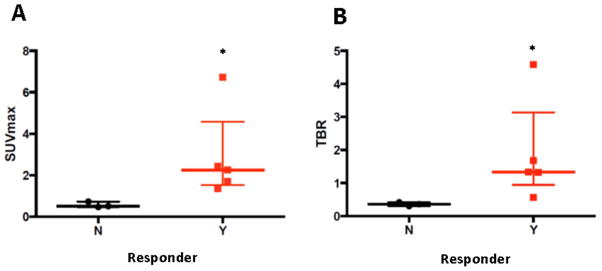
18F-FDG PET-CT derived SUVmax (Panel A) and TBR (Panel B) obtained in cold conditions in subjects who increased (responders) or did not increase (non-responders) their BAT blood flow with cold. BAT: brown adipose tissue; 18F-FDG PET-CT: 18Fluorodeoxyglucose positron emission tomography-computed tomography; SUVmax: maximum standard uptake value; TBR: target to background ratio, N: Non-responders, Y: Responders. Data presented as median and interquartile range. *: p<0.05.
Discussion
In this study, we illustrate the feasibility of a novel non-invasive, non-ionizing imaging modality, contrast enhanced ultrasound, to detect BAT blood flow in healthy humans. In addition, we demonstrate that the increase in BAT blood flow induced by cold-induced BAT stimulation can be detected and estimated by contrast enhanced ultrasound. Finally, we report that the response of BAT blood flow to cold detected by CEUS is related to BAT metabolic activity.
The detection of BAT in humans has been reported using biopsy, 18F-FDG PET-CT, near infrared spectroscopy and recently MRI; however these methods are limited as they are either invasive, irradiating, or not widely available. In the present study, we took advantage of the high vascularity of BAT [13, 14] as an approach to detect BAT. Additionally, BAT blood flow increases to match metabolic requirements [15, 16], suggesting that BAT blood flow imaging may be used to detect BAT activation. Indeed, we demonstrate that the perfusion response to cold is associated with BAT metabolic activity in the same cold conditions, suggesting that the estimation of BAT blood flow by CEUS reflects BAT activity.
Previous studies have demonstrated the ability of CEUS to assess perfusion in humans, particularly in the myocardium [27] and we have recently reported the usefulness of CEUS in assessing BAT blood flow in mice [23, 24]. The magnitude of changes in the blood flow with BAT stimulation was very high in mice (15 fold), raising the issue that the same ultrasound settings would not be able to capture both pre- and post-stimulation blood flow. We anticipated that this would not be an issue in humans, in whom both the concentration of microbubbles and the amplitude of stimulation are lower than in mice. Indeed, the increase in blood flow induced by 2 hours of exposure to mild cold was 2.4±1.9 fold, and both warm and cold conditions could be analyzed using the same settings. However, the low blood flow in warm conditions necessitated a high infusion rate of microbubbles. The rate of infusion of 1.3 ml over 5 minutes, 20-fold lower than the dose used in mice, allowed analysis of human BAT blood flow in warm conditions. The imaging was started after the microbubbles reached a steady concentration in BAT. Also, the longest triggering interval chosen (10s) allowed microbubbles to reach the plateau of signal intensity after their destruction by high-energy ultrasound pulses. Both conditions are necessary to fit an exponential curve to the microbubble signal intensity over time.
Brown adipose tissue was detected in all subjects using an optimized CEUS protocol. On average, an increase of BAT blood flow was noted after cold exposure, which could not be explained by an increase in cardiac output. This finding underlines the capability of CEUS to monitor changes in BAT blood flow due to physiological stimuli. In three subjects, a low BAT blood flow in warm conditions and no increase of the BAT blood flow after cold exposure were noted. Interestingly, these three subjects had the lowest 18F-FDG uptake estimated by PET-CT. As previously noted [28], a large variability was noted in the metabolic response of BAT to cold, which was also noted with CEUS-derived blood flow, and these three subjects appear to have low BAT response to cold, both in terms of blood flow and of metabolism. We elected to parallel the study by Orava et al [28] in which the investigators separated metabolic responders and non-responders. We chose a threshold of two-fold increase in CEUS-derived blood flow for the responders as we surmised that such an increase would have biological relevance.
Whether this finding signifies that the 3 non-responders have a decreased mass of BAT or a normal mass but inactive BAT is unknown, as neither CEUS nor PET can differentiate BAT mass from BAT activity in humans. Of note, the 18F-FDG uptake detected by PET in the volunteers was low compared to other studies [11, 29]; the enrollment of the majority of the volunteers in summer, when BAT is less detectable, may have played a role [9]. Therefore, CEUS appears to be a sensitive technique to detect BAT, at least in healthy, young individuals in whom the likelihood of detecting BAT is high [8,10]. Whether CEUS is equally sensitive in patients with clinical disorders (obesity), or in different populations (female, elderly), remains a subject of future investigations.
In rodents, BAT is present in large depots located mainly between the scapulae. In contrast, in adult humans, BAT is found in smaller clusters throughout the neck (in particular the supraclavicular area), thorax, abdomen and pelvis [30]. Using CEUS as opposed to a whole body technique only allows the assessment of one anatomical region of the body during one procedure. The supraclavicular area was chosen as BAT is prominent in this region and it is readily accessible to ultrasound.
Within the supraclavicular adipose tissue depot, BAT has a heterogeneous distribution - small clusters of BAT are intermixed with white adipose tissue. The heterogeneous distribution of BAT within the adipose tissue represents a limitation for its detection by CEUS. Indeed, tracing a region of interest encompassing small clusters of BAT is challenging. Therefore, we measured the average blood flow in the large adipose depot that is well visualized between the trapezius and sternocleidomastoid muscles. The increase in estimated blood flow with cold stimulation is in line with the increase in BAT blood flow measured by PET [11], underlining the validity of the measurement.
The triggering sequence used for BAT detection did not reliably allow the detection of muscle blood flow in warm conditions. Muscle blood flow could be estimated after cold exposure, when the blood flow had increased [31]. Muscle blood flow in warm conditions is estimated at 2ml/100g/min [32], whereas BAT has a perfusion rate of 7.5ml/100g/min in warm conditions [28], suggesting that either a more sensitive contrast technique, lower frequency probe, higher concentration of contrast or longer triggering intervals may be required to image skeletal muscle in warm conditions [22].
The present study has a small sample size. Despite this, CEUS was able to detect BAT blood flow in each subject during cold exposure, and was able to demonstrate an increase in flow relative to warm/basal conditions in those subjects whose basal BAT flow could be estimated. Only male subjects were studied to decrease the variability of BAT response to cold; since female subjects have a similar or greater occurrence of detectable BAT by PET [7], it is probable that imaging BAT with CEUS would be equally useful in women. The volunteers were young, and therefore more likely to have detectable BAT. Further studies will be required to determine whether CEUS is a sensitive enough modality to detect BAT in older or obese patients, co-morbidities known to decrease BAT activation [7, 9].
In conclusion, we have demonstrated the feasibility of a widely accessible, inexpensive, non-invasive, non-ionizing imaging modality to detect blood flow in BAT. Further evaluation of this modality in different patient populations is required, as CEUS may prove an effective alternative to 18F-FDG PET-CT in assessing BAT blood flow and activation, and therefore may be a useful modality to evaluate the response of BAT to various therapeutic interventions.
Acknowledgments
Funding sources:
This work was supported by grant R21-DK092909 (M.S.-C.) and K23-DK081604 (A.M.C.) from the National Institutes of Health (Bethesda, MD.).
We are grateful to Patrick Rafter, MS, from Philips Medical, for his technical advice.
Abbreviations
- BAT
Brown Adipose Tissue
- CEUS
Contrast Enhanced Ultrasound
- 18F-FDG
18F-fluorodeoxyglucose
- MI
Mechanical Index
- NIRS
Near Infrared Spectroscopy
- PET
Positron Emission Tomography
- ROI
Region of Interest
- SUVmax
Maximum Standard Uptake Value
- TBR
Target to Background Ratio
- UCP1
Uncoupling Protein 1
- VOI
Volume of Interest
Footnotes
Disclosures:
None.
Publisher's Disclaimer: This is a PDF file of an unedited manuscript that has been accepted for publication. As a service to our customers we are providing this early version of the manuscript. The manuscript will undergo copyediting, typesetting, and review of the resulting proof before it is published in its final citable form. Please note that during the production process errors may be discovered which could affect the content, and all legal disclaimers that apply to the journal pertain.
References
- 1.Nicholls DG, Locke RM. Thermogenic mechanisms in brown fat. Physiol Rev. 1984;64:1–64. doi: 10.1152/physrev.1984.64.1.1. [DOI] [PubMed] [Google Scholar]
- 2.Zingaretti MC, Crosta F, Vitali A, Guerrieri M, Frontini A, Cannon B, et al. The presence of UCP1 demonstrates that metabolically active adipose tissue in the neck of adult humans truly represents brown adipose tissue. FASEB. 2009;23:3113–20. doi: 10.1096/fj.09-133546. [DOI] [PubMed] [Google Scholar]
- 3.Cannon B, Nedergaard J. Brown adipose tissue: function and physiological significance. Physiol Rev. 2004;84:277–359. doi: 10.1152/physrev.00015.2003. [DOI] [PubMed] [Google Scholar]
- 4.Lowell BB, Susulic VS, Hamann A, Lawitts JA, Himms-Hagen J, Boyer BB, et al. Development of obesity in transgenic mice after genetic ablation of brown adipose tissue. Nature. 1993;366:740–2. doi: 10.1038/366740a0. [DOI] [PubMed] [Google Scholar]
- 5.Tseng YH, Cypess AM, Kahn CR. Cellular bioenergetics as a target for obesity therapy. Nat Rev Drug Discov. 2010;9:465–82. doi: 10.1038/nrd3138. [DOI] [PMC free article] [PubMed] [Google Scholar]
- 6.Cunningham S, Leslie P, Hopwood D, Illingworth P, Jung RT, Nicholls DG, et al. The characterization and energetic potential of brown adipose tissue in man. Clin Sci. 1985;69:343–348. doi: 10.1042/cs0690343. [DOI] [PubMed] [Google Scholar]
- 7.Cypess AM, Lehman S, Williams G, Tal I, Rodman D, Goldfine AB, et al. Identification and importance of brown adipose tissue in adult humans. N Engl J Med. 2009;360:1509–1517. doi: 10.1056/NEJMoa0810780. [DOI] [PMC free article] [PubMed] [Google Scholar]
- 8.van Marken Lichtenbelt WD, Vanhommerig JW, Smulders NM, Drossaerts JM, Kemerink GJ, Bouvy ND, et al. Cold-activated brown adipose tissue in healthy men. N Engl J Med. 2009;360:1500–1508. doi: 10.1056/NEJMoa0808718. [DOI] [PubMed] [Google Scholar]
- 9.Saito M, Okamatsu-Ogura Y, Matsushita M, Watanabe K, Yoneshiro T, Nio-Kobayashi J, et al. High incidence of metabolically active brown adipose tissue in healthy adult humans: effects of cold exposure and adiposity. Diabetes. 2009;58:1526–1531. doi: 10.2337/db09-0530. [DOI] [PMC free article] [PubMed] [Google Scholar]
- 10.Virtanen KA, Lidell ME, Orava J, Heglind M, Westergren R, Niemi T, et al. Functional brown adipose tissue in healthy adults. N Engl J Med. 2009;360:1518–1525. doi: 10.1056/NEJMoa0808949. [DOI] [PubMed] [Google Scholar]
- 11.Muzik O, Mangner TJ, Leonard WR, Kumar A, Janisse J, Granneman JG. 15O PET measurement of blood flow and oxygen consumption in cold-activated human brown fat. J Nucl Med. 2013;54:523–31. doi: 10.2967/jnumed.112.111336. [DOI] [PMC free article] [PubMed] [Google Scholar]
- 12.Chen YC, Cypess AM, Chen YC, Palmer M, Kolodny G, Kahn CR, et al. Measurement of human brown adipose tissue volumeand activity using anatomic MR imaging and functional MR imaging. J Nucl Med. 2013;54:1584–7. doi: 10.2967/jnumed.112.117275. [DOI] [PMC free article] [PubMed] [Google Scholar]
- 13.Lever JD, Nnodim JO, Symons D. Arteriovenous anastomoses in interscapular brown adipose tissue in the rat. J Anat. 1985;143:207–210. [PMC free article] [PubMed] [Google Scholar]
- 14.Rauch JC, Hayward JS. Topography and Vascularization of Brown Fat in a Small NonHibernator (Deer Mouse, Peromyscus Maniculatus) Can J Zool. 1969;47:1301–14. doi: 10.1139/z69-203. [DOI] [PubMed] [Google Scholar]
- 15.Foster DO, Frydman ML. Nonshivering thermogenesis in the rat. II. Measurements of blood flow with microspheres point to brown adipose tissue as the dominant site of the calorigenesis induced by noradrenaline. Can J Physiol Pharmacol. 1978;56:110–122. doi: 10.1139/y78-015. [DOI] [PubMed] [Google Scholar]
- 16.Foster DO, Frydman ML. Tissue distribution of cold-induced thermogenesis in conscious warm- or cold-acclimated rats reevaluated from changes in tissue blood flow: the dominant role of brown adipose tissue in the replacement of shivering by nonshivering thermogenesis. Can J Physiol Pharmacol. 1979;57:257–270. doi: 10.1139/y79-039. [DOI] [PubMed] [Google Scholar]
- 17.Nagashima T, Ohinata H, Kuroshima A. Involvement of nitric oxide in noradrenaline-induced increase in blood flow through brown adipose tissue. Life Sci. 1994;54:17–25. doi: 10.1016/0024-3205(94)00573-7. [DOI] [PubMed] [Google Scholar]
- 18.Wei K, Jayaweera AR, Firoozan S, Linka A, Skyba DM, Kaul S. Quantification of myocardial blood flow with ultrasound-induced destruction of microbubbles administered as a constant venous infusion. Circulation. 1998;97:473–83. doi: 10.1161/01.cir.97.5.473. [DOI] [PubMed] [Google Scholar]
- 19.Masugata H, Lafitte S, Peters B, Strachan GM, DeMaria AN. Comparison of real-time and intermittent triggered myocardial contrast echocardiography for quantification of coronary stenosis severity and transmural perfusion gradient. Circulation. 2001;104:1550–6. doi: 10.1161/hc3801.095694. [DOI] [PubMed] [Google Scholar]
- 20.Lafitte S, Matsugata H, Peters B, Togni M, Strachan M, Kwan OL, et al. Comparative value of dobutamine and adenosine stress in the detection of coronary stenosis with myocardial contrast echocardiography. Circulation. 2001;103:2724–30. doi: 10.1161/01.cir.103.22.2724. [DOI] [PubMed] [Google Scholar]
- 21.Sjøberg K, Rattigan S, Hiscock N, Richter EA, Kiens B. A new method to study microvascular blood volume in muscle and adipose tissue: real time imaging in humans and rat. Am J Physiol Heart Circ Physiol. 2011;301:H450–H458. doi: 10.1152/ajpheart.01174.2010. [DOI] [PubMed] [Google Scholar]
- 22.Lindner JR, Womack L, Barrett EJ, Weltman J, Price W, Harthun NL, et al. Limb stress-rest perfusion imaging with contrast ultrasound for the assessment of peripheral arterial disease severity. JACC Cardiovasc Imaging. 2008;1:343–50. doi: 10.1016/j.jcmg.2008.04.001. [DOI] [PMC free article] [PubMed] [Google Scholar]
- 23.Clerte M, Baron DM, Brouckaert P, Ernande L, Raher MJ, Flynn AW, et al. Brown Adipose Tissue Blood Flow and Mass in Obesity: A Contrast Ultrasound Study in Mice. J Am Soc Echocardiogr. 2013;26:1465–73. doi: 10.1016/j.echo.2013.07.015. [DOI] [PMC free article] [PubMed] [Google Scholar]
- 24.Baron DM, Clerte M, Brouckaert P, Raher MJ, Flynn AW, Zhang H, et al. In vivo noninvasive characterization of brown adipose tissue blood flow by contrast ultrasound in mice. Circ Cardiovasc Imaging. 2012;5:652–9. doi: 10.1161/CIRCIMAGING.112.975607. [DOI] [PMC free article] [PubMed] [Google Scholar]
- 25.Porter TR, Abdelmoneim S, Belcik JT, McCulloch ML, Mulvagh SL, Olson JJ, et al. Guidelines for the cardiac sonographer in the performance of contrast echocardiography: a focused update from the American Society of Echocardiography. J Am Soc Echocardiogr. 2014;27:797–810. doi: 10.1016/j.echo.2014.05.011. [DOI] [PubMed] [Google Scholar]
- 26.Subramanian S, Tawakol A, Burdo TH, Abbara S, Wei J, Vijayakumar J, et al. Arterial Inflammation in Patients with HIV. JAMA. 2012;308:379–386. doi: 10.1001/jama.2012.6698. [DOI] [PMC free article] [PubMed] [Google Scholar]
- 27.Porter TR, Xie F. Myocardial Perfusion imaging with contrast ultrasound. JACC Cardiovasc Imaging. 2010;3:176–87. doi: 10.1016/j.jcmg.2009.09.024. [DOI] [PubMed] [Google Scholar]
- 28.Orava J, Nuutila P, Lidell ME, Oikonen V, Noponen T, Viljanen T, et al. Different Metabolic Responses of Human Brown Adipose Tissue to Activation by Cold and Insulin. Cell Metab. 2011;14:272–9. doi: 10.1016/j.cmet.2011.06.012. [DOI] [PubMed] [Google Scholar]
- 29.Baba S, Jacene HA, Engles JM, Honda H, Wahl RL. CT Hounsfield Units of brown adipose tissue increase with activation: Pre-clinical and clinical studies. J Nucl Med. 2010;51:246–50. doi: 10.2967/jnumed.109.068775. [DOI] [PubMed] [Google Scholar]
- 30.Heaton JM. The distribution of brown adipose tissue in the human. J Anat. 1972;112:35–9. [PMC free article] [PubMed] [Google Scholar]
- 31.Bell AW, Hilditch TE, Horton PW, Thompson GE. The distribution of blood flow between individual muscles and non-muscular tissues in the hind limb of the young ox (bos Taurus): values at thermoneutrality and during exposure to cold. J Physiol. 1976;257:229–43. doi: 10.1113/jphysiol.1976.sp011365. [DOI] [PMC free article] [PubMed] [Google Scholar]
- 32.Heinonen I, Bengt S, Jukka K, Sipilä HT, Vesa O, Pirjo N, et al. Skeletal muscle blood flow and oxygen uptake at rest and during exercise in humans: a pet study with nitric oxide and cyclooxygenase inhibition. Am J Physiol Heart Circ Physiol. 2011;300:H1510–7. doi: 10.1152/ajpheart.00996.2010. [DOI] [PubMed] [Google Scholar]


