Abstract
Objective
To determine the variation in kidney stone composition and its relationship to risk factors and recurrence among first-time stone formers in the general population.
Patients and Methods
Medical records were manually reviewed and validated for symptomatic kidney stone episodes among Olmsted County, Minnesota residents from January 1, 1984 to December 31, 2012. Clinical and laboratory characteristics and the risk of symptomatic recurrence were compared between stone compositions.
Results
There were 2961 validated first-time symptomatic kidney stone formers. Stone composition analysis was obtained in 1508 (51%) at the first episode. Stone formers were divided into the following mutually exclusive groups: any brushite (0.9%), any struvite (0.9%), any uric acid (4.8%), majority calcium oxalate (76%) or majority hydroxyapatite (18%). Stone composition varied with clinical characteristics. A multivariable model had a 69% probability of correctly estimating stone composition, but assuming calcium oxalate monohydrate stone was correct 65% of the time. Symptomatic recurrence at 10 years was approximately 50% for brushite, struvite, and uric acid, but approximately 30% for calcium oxalate and hydroxyapatite stones (P<.001). Recurrence was similar across different proportions of calcium oxalate and hydroxyapatite (P-trend=.10). However, among calcium oxalate stones, 10-year recurrence rate ranged from 38% for 100% calcium oxalate dihydrate to 26% for 100% calcium oxalate monohydrate (P-trend=.007).
Conclusion
Calcium stones are more common (94% of stone formers) than has been previously reported. While clinical and laboratory factors associate with the stone composition, they are of limited utility for estimating stone composition. Rarer stone compositions are more likely to recur.
Keywords: kidney calculi, chemical composition, recurrence, epidemiology
Introduction
Symptomatic kidney stones are prevalent in 7.2 to 7.7% of the US adult population1,2 and are often classified by stone composition.3–6 Clinical practice guidelines disagree with urological associations recommending,7,8 but the American College of Physicians not recommending stone compositional analysis in all stone formers.9 Prior studies have classified stone composition in the following overlapping groups: any calcium oxalate monohydrate (COM) 40–60%, any calcium oxalate dihydrate (COD) 40–60%, any hydroxyapatite 20–60%, any brushite 2–4%, any uric acid 5–10%, any struvite 5–15%, and any cystine 1–2.5%.10–12 The common calcium stone (calcium oxalate and/or hydroxyapatite) is thought to occur in 75–85% of stone formers. However, most prior studies assessed stone composition in referral centers of prevalent stone formers that may be enriched for stone compositions that are more likely to recur or require surgery. Stone composition characteristics of first-time (incident) stone formers in the general population are unknown.
In practice, stone composition is often not available as the stone is not collected. Clinical and laboratory characteristics of the patient are often used to estimate composition.3 However, the accuracy of estimating stone composition is largely unknown. The stability of stone composition between episodes and the extent to which stone composition predicts recurrence in the community is also unclear. To address these important questions, we carefully analyzed a large population-based cohort of first-time symptomatic stone formers. Our goals were to 1) characterize stone composition of first-time stone formers in detail, including composition stability with recurrence; 2) determine whether stone composition can be estimated when not available; and 3) determine whether risk of recurrence differs by stone composition.
Methods
Study Sample
After institutional review board approval, first-time (incident) symptomatic kidney stone formers in Olmsted County, MN from January 1, 1984 to December 31, 2012 were identified by diagnostic codes and then validated and detailed by chart review using the Rochester Epidemiology Project13 as described in the Supplemental Methods.
Stone composition
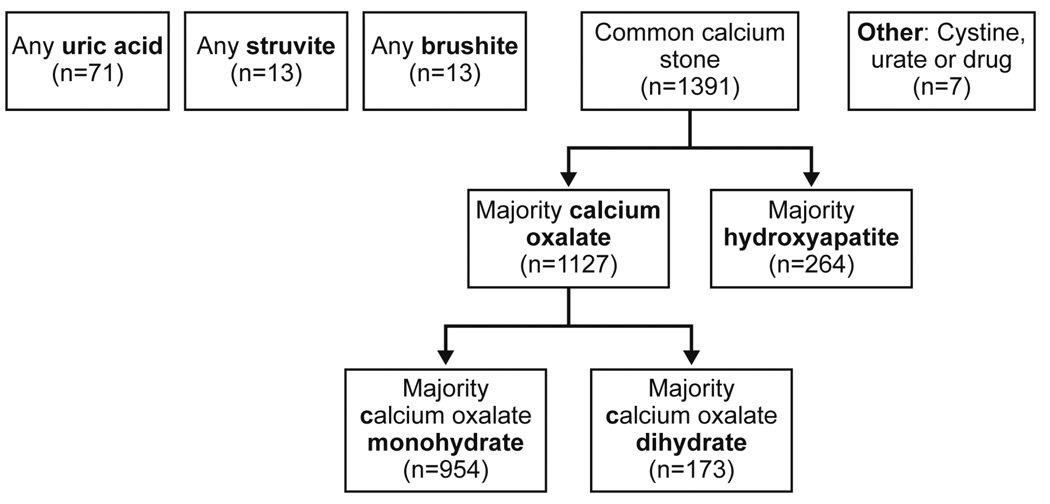
All stone composition reports in these stone formers were identified and reviewed. Stone composition analysis was not routine for each episode, especially after first obtained. Thus, stone composition was assessed at the first episode and compared between the first, second, and third available composition reports (regardless of episode number). Stone compositions were determined by infrared spectroscopy (Supplemental Methods). Stone formers were divided into the following mutually exclusive groups: cystine (if any), brushite (if any), struvite (if any), uric acid (if any), and calcium oxalate (if majority) or hydroxyapatite (if majority) (Figure 1). Majority calcium oxalate stones were further subclassified as COM (if majority) or COD (if majority). Other compositions (e.g. urate and drugs) were too rare for meaningful analysis and excluded.
Figure 1.
Stone composition classification of first-time stone formers in Olmsted County.
Statistical Analysis
A trend in the ratio of stone compositions (common calcium versus other less common compositions) between the first, second, and third available composition report was assessed using a logistic generalized estimating equation model. Clinical and laboratory characteristics were compared across stone composition at the first episode using Kruskal-Wallis and Wilcoxon tests for continuous variables and Chi-square tests for nominal variables. A model to estimate stone composition from clinical and laboratory characteristics was developed using multinomial logistic regression. The highest probability stone composition as determined by the model was treated as the estimated composition for comparison with the actual composition.
The risk of symptomatic recurrence by stone composition at the first episode was estimated using survival methods (log-rank test, Cox model) with censoring at symptomatic recurrence or date of last known residency in the county. The proportionality assumption was tested and confirmed in all models. For calcium oxalate and hydroxyapatite subtypes, linear trend in risk of recurrence was assessed by a Cox model with coding as follows: (1=100% hydroxyapatite, 2=mixed but ≥50% hydroxyapatite, 3=mixed but >50% calcium oxalate, 4=100% calcium oxalate). For struvite and brushite compositions, observed incidence of recurrence was compared to estimated incidence based upon the recurrence of kidney stone (ROKS) nomogram.14 For calcium oxalate subtypes, linear trend in risk of recurrence was assessed by a Cox model with coding as follows: (1=100% COM, 2=mixed but >50% COM, 3=mixed but ≥50% COD, 4=100% COD). Statistical analyses were performed using the SAS software, version 9.3 (SAS Institute, Cary, NC; www.sas.com).
Results
There were 6380 coded stone formers between January 1984 and December 2012, of which, 2961 were validated as first-time symptomatic kidney stone formers. Of these, only 22 (0.7%) were attributed to another disease or disorder (10 primary hyperparathyroidism; 3 intestinal disease causing enteric hyperoxaluria; 4 ileostomy, colostomy, or gastric bypass; 4 renal tubular acidosis; and 1 medullary sponge kidney). A total of 1807/2961 (61%) had at least one stone composition with 1508/2961 (51%) occurring within 3 months of the first stone episode. We further excluded those with no stone material identified on composition analysis (n=13), leaving 1495 for further analysis. Due to small sample size, ammonium urate (n=1), sodium urate (n=1), drug stones (n=3), and cystine stones (n=2) were also excluded from most analyses (n=1488).
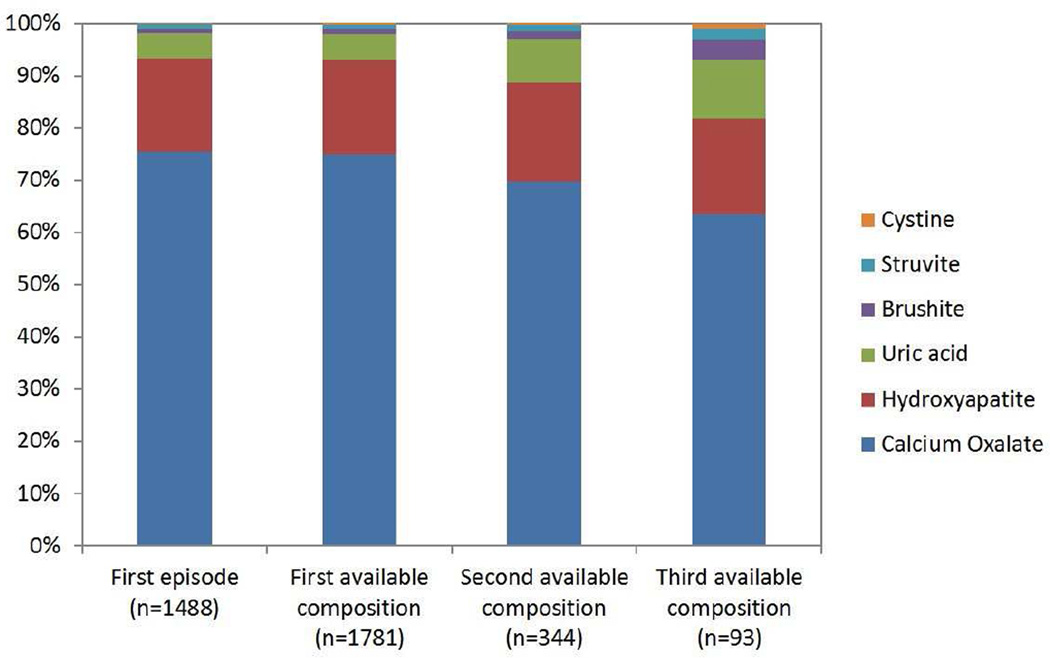
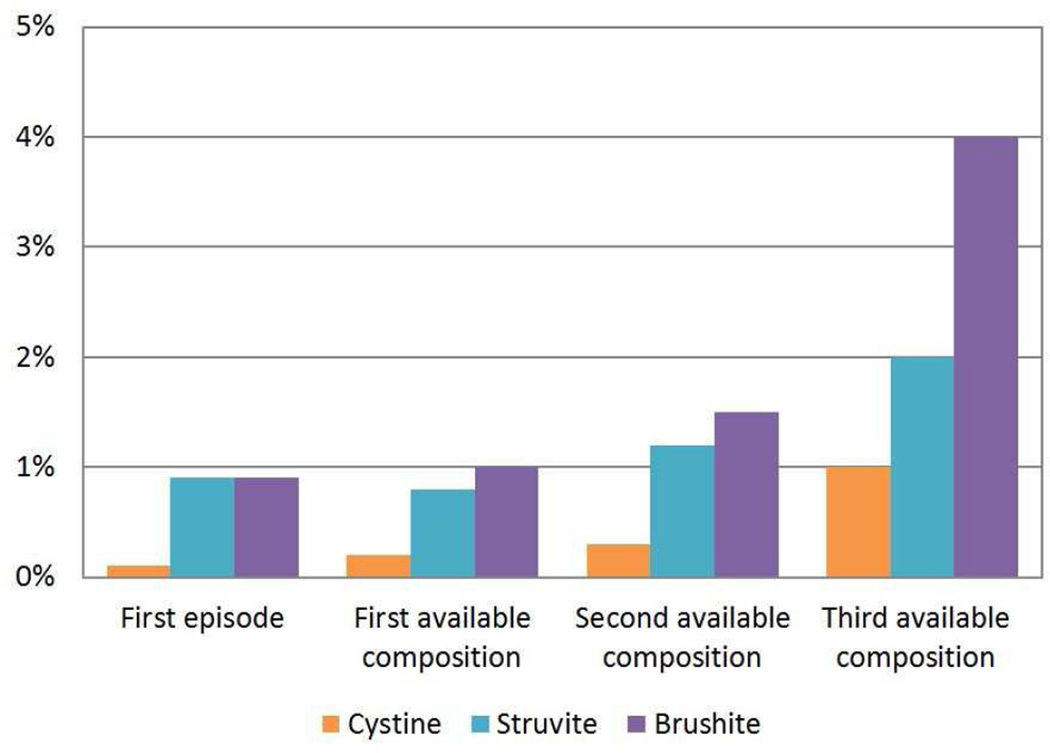
The stone composition distribution at the first episode is presented in Figure 1. At the first episode, 94% (1391/1488) of stones were common calcium stones (76% (1127/1488) calcium oxalate and 18% (264/1488) hydroxyapatite), 4.8% (71/1488) were uric acid, 0.9% (13/1488) were brushite, and 0.9% (13/1488) were struvite. Pure (100%) stone compositions were present in 71% (796/1127) of calcium oxalate, 31% (82/264) of hydroxyapatite, 39% of brushite (5/13), 0% of Struvite (0/13), and 68% (48/71) of uric acid stones. Among calcium oxalate stone formers, 85% (954/1127) were majority COM and 15% (173/1127) were majority COD. The comparison of stone composition distribution at the first episode, the first available composition, the second available composition, and the third available composition is presented in Figure 2 (cystine stones included). Calcium oxalate decreased, whereas cystine, brushite, struvite, and uric acid increased with subsequent compositions. The likelihood of uncommon stone compositions (uric, acid, brushite, and struvite) to common calcium stone compositions (calcium oxalate and/or hydroxyapatite) increased with each subsequent composition analysis (OR=1.39, P-trend=.02)
Figure 2.
Proportion of each stone composition at first episode and at first, second, and third available composition (first available composition could be at a subsequent episode if not obtained at the first episode). The second available composition was a median 3.2 years after the first available composition and the third available composition was a median 7.8 years after the first available composition. A) All compositions. B) Magnified view of the rarer compositions.
Among the 842 recurrent stone formers (at least 2 episodes), 672/842 (80%) had at least one stone composition analysis. Among the 343/842 (41%) recurrent stone formers with both a 1st and 2nd stone composition, stone composition was most stable for calcium oxalate (87% (208/240) no change), followed by uric acid (72% (18/25) no change), and hydroxyapatite (60% (41/68) no change); overall 79% (271/343) had no change in composition and 21% (72/343) had a change in composition (Table 1). Among the common calcium stones, the proportion of hydroxyapatite (versus calcium oxalate) in a stone decreased between the first and second composition (25% vs 20% hydroxyapatite, P<.001), particularly in stones with a high proportion of hydroxyapatite (Supplemental Figure 1).
Table 1.
Second stone composition stratified by first stone composition among 343 first-time stone formers with two stone compositions a median of 3.2 years apart.
| First stone | Second stone | ||||
|---|---|---|---|---|---|
| Majority calcium oxalate n=240 |
Majority hydroxyapatite n=65 |
Any brushite n=5 |
Any struvite n=4 |
Any uric acid n=29 |
|
| Majority calcium oxalate n=240 | 208(87%) a | 19 | 2 | 1 | 10 |
| Majority hydroxyapatite n=68 | 25 | 41 (60%) a | 1 | 1 | 0 |
| Any brushite n=6 | 2 | 2 | 2(33%) a | 0 | 0 |
| Any struvite n=4 | 0 | 1 | 0 | 2(50%) a | 1 |
| Any uric acid n=25 | 5 | 2 | 0 | 0 | 18(72%) a |
The proportion with no change in stone composition between first and second available compositions. Overall, 79% had no change in stone composition.
Table 2 compares stone composition with clinical characteristics, while Table 3 compares stone composition with blood and urine laboratory characteristics. Uric acid stones were associated with older age, male gender, white race, higher body mass index (BMI), hypertension, diabetes, gout, gross hematuria, higher serum uric acid, lower serum bicarbonate, lower urine pH, and higher urine uric acid and were less likely to associate with a family history of stones or require surgery. Struvite stones were associated with older age, female gender, hypertension, gross hematuria, urinary tract infection, fever, and lower serum phosphorus. Struvite stone formers were also more likely to have multiple stones on imaging, staghorn stones, and require surgery; but were unlikely to have stones located in the ureterovesical junction. Brushite stones were more likely to be located at the ureterovesical junction and less likely to present with gross hematuria. Hydroxyapatite stones were associated with younger age, female gender, family history of stones, more stones on imaging, higher urine pH, lower urine oxalate, and were less likely to associate with diabetes or hypertension.
Table 2.
Clinical Characteristics at the first stone episode by different stone compositions
| Known Composition | Composition | Calcium Oxalate | |||||||||||
|---|---|---|---|---|---|---|---|---|---|---|---|---|---|
| Clinical Characteristic | No (n=1453) |
Yes (n=1488) |
P-value b | Calcium Oxalate (n=1127) |
Hydroxy- apatite (n=264) |
Brushite (n=13) |
Struvite (n=13) |
Uric Acid (n=71) |
P-value b | Di- hydrate (n=173) |
Mono- hydrate (n=954) |
P-value b | |
| Mean (SD) Age, years | 42 (16) |
43 (15) |
.009 | 44 (15) |
35 (14) |
47 (19) |
51 (22) |
54 (15) |
<.001 | 38 (15) |
46 (14) |
<.001 | |
| Male, % | 59 | 62 | .08 | 69 | 31 | 54 | 23 | 73 | <.001 | 69 | 69 | .94 | |
| White, % | 88 | 89 | .20 | 90 | 87 | 69 | 96 | .02 | 86 | 90 | .10 | ||
| Family history of stones, % | 22 | 26 | .01 | 27 | 28 | 15 | 15 | 14 | .10 | 34 | 26 | .04 | |
| Mean (SD) body mass index, kg/m2 | 29 (6.7) |
29 (6.3) |
.40 | 29 (6.1) |
27 (6.6) |
29 (6.9) |
27 (6.3) |
31 (6.9) |
<.001 | 28 (5.1) |
29 (6.3) |
.03 | |
| Diabetes, % | 4.6 | 5.9 | .11 | 5.6 | 1.9 | 23 | 15 | 21 | <.001 | 2.3 | 6.2 | .04 | |
| Hypertension, % | 24 | 26 | .09 | 27 | 16 | 23 | 54 | 56 | <.001 | 20 | 28 | .04 | |
| Gout, % | 3.4 | 3.8 | .57 | 3.6 | 1.5 | 7.7 | 15 | 11 | <.001 | 1.7 | 4.0 | .15 | |
| Loose stools, % | 9.1 | 9.9 | .46 | 9.0 | 13 | 7.7 | 0.0 | 14 | .12 | 8.7 | 9.0 | .88 | |
| Abdominal pain/renal colic, % | 90 | 91 | .16 | 92 | 91 | 88 | 69 | 89 | .001 | 91 | 92 | .64 | |
| Gross hematuria, % | 23 | 21 | .49 | 20 | 22 | 15 | 39 | 37 | .01 | 28 | 19 | .008 | |
| Urinary tract infection, % | 5.1 | 5.4 | .67 | 3.8 | 9.1 | 15 | 62 | 5.6 | <.001 | 3.5 | 3.9 | .80 | |
| Fever, % | 6.0 | 6.7 | .46 | 5.1 | 11 | 15 | 23 | 9.9 | <.001 | 3.5 | 5.3 | .30 | |
| Lower urinary tract symptoms, % | 34 | 35 | .40 | 35 | 39 | 31 | 62 | 30 | .16 | 45 | 33 | .002 | |
| a Number of stones on imaging | 0 (%) | 9.2 | 17 | <.001 | 17 | 12 | 17 | 15 | 22 | .006 | 19 | 17 | .72 |
| 1 (%) | 56 | 48 | 50 | 42 | 42 | 31 | 49 | 52 | 50 | ||||
| 2+ (%) | 35 | 35 | 33 | 46 | 42 | 54 | 29 | 30 | 33 | ||||
| a Mean (SD) largest diameter, mm | 4.3 (2.7) |
5.4 (3.4) |
<.001 | 5.2 (3.3) |
5.5 (2.8) |
8.0 (8.7) |
14 (10) |
5.9 (4.4) |
.09 | 5.3 (3.7) |
5.2 (3.2) |
.62 | |
| a Staghorn stone, % | 0.9 | 1.2 | .40 | 0.7 | 1.2 | 8.3 | 31 | 1.5 | <.001 | 0.6 | 0.8 | .81 | |
| a Renal pelvic stone,% | 14 | 15 | .67 | 14 | 18 | 8.3 | 31 | 18 | .25 | 13 | 14 | .55 | |
| a Ureteropelvic junction stone, % | 6.5 | 6.1 | .64 | 6.1 | 6.9 | 0.0 | 7.7 | 4.4 | .83 | 4.2 | 6.4 | .27 | |
| a Ureter stone, % | 35 | 38 | .12 | 37 | 42 | 25 | 23 | 44 | .31 | 39 | 37 | .53 | |
| a Ureterovesical junction stone, % | 35 | 28 | <.001 | 28 | 29 | 50 | 0.0 | 16 | .01 | 27 | 28 | .84 | |
| a Underwent stone surgery, % | 22 | 44 | <.001 | 43 | 49 | 39 | 85 | 35 | .008 | 44 | 43 | .74 | |
Abdominal imaging studies at the time of the first stone episode were obtained in 2789 (94%); of these, 1372 (49%) were computed tomography scans.
Unadjusted associations; Kruskal-wallis, Wilcoxon and T-tests were used to calculate p-values for continuous variables; chi-squared tests were used to calculate p-values for categorical variables.
Table 3.
First available serum and urine laboratory characteristics after the first stone episode by different stone compositions.
| Laboratory characteristic a mean (SD) or % |
Known Composition | Composition | Calcium Oxalate | |||||||||
|---|---|---|---|---|---|---|---|---|---|---|---|---|
| No (n=1453) |
Yes (n=1488) |
P-value b | Calcium Oxalate (n=1127) |
Hydroxy apatite (n=264) |
Brushite (n=13) |
Struvite (n=13) |
Uric Acid (n=71) |
P-valueb | Dihydrate (n=173) |
Mono hydrate (n=954) |
P-value b | |
| Serum calcium, mg/dl | 9.4 (0.55) |
9.4 (0.63) |
.24 | 9.5 (0.63) |
9.4 (0.63) |
9.6 (0.42) |
9.2 (0.87) |
9.4 (0.58) |
.14 | 9.6 (0.56) |
9.4 (0.63) |
.007 |
| Serum phosphorus, mg/dl | 3.3 (0.73) |
3.3 (0.68) |
.83 | 3.3 (0.67) |
3.4 (0.71) |
3.1 (0.82) |
2.9 (0.98) |
3.6 (0.69) |
.008 | 3.2 (0.84) |
3.3 (0.63) |
.64 |
| Serum uric acid, mg/dl | 5.7 (1.6) |
5.5 (1.6) |
.005 | 5.6 (1.5) |
4.8 (1.4) |
4.8 (1.6) |
4.9 (1.8) |
6.8 (2.0) |
<.001 | 5.3 (1.3) |
5.6 (1.5) |
.29 |
| Serum bicarbonate, mmol/l | 26 (2.8) |
26 (2.7) |
.12 | 26 (2.7) |
25 (2.9) |
25 (2.1) |
26 (1.6) |
25 (2.7) |
.008 | 26 (2.7) |
26 (2.7) |
.41 |
| Urine calcium, mg/24 hr | 225 (126) |
219 (131) |
.29 | 220 (129) |
224 (131) |
N/A‡ | N/A | 152 (91) |
.02 | 253 (148) |
214 (124) |
.03 |
| Urine citrate, mg/24 hr | 621 (286) |
631 (289) |
.71 | 640 (277) |
570 (245) |
N/A | N/A | 661 (364) |
.09 | 611 (199) |
645 (289) |
.60 |
| Urine oxalate, mmol/24 hr | 0.32 (0.15) |
0.34 (0.18) |
.04 | 0.36 (0.20) |
0.28 (0.11) |
N/A | N/A | 0.32 (0.14) |
<.001 | 0.34 (0.16) |
0.37 (0.20) |
.24 |
| Urine phosphorus, mg/24hr | 938 (360) |
932 (362) |
.73 | 938 (368) |
883 (338) |
N/A | N/A | 955 (314) |
.35 | 886 (407) |
948 (359) |
.12 |
| Urine uric acid, mg/24 hr | 602 (232) |
599 (220) |
.82 | 616 (224) |
523 (168) |
N/A | N/A | 635 (271) |
.01 | 595 (173) |
619 (232) |
.75 |
| Urine sodium, mmol/24 hr | 140 (2.5) |
147 (41) |
.18 | 148 (44) |
144 (29) |
N/A | N/A | 145 (40) |
.91 | 151 (51) |
148 (43) |
.94 |
| Urine volume, ml/24 hr | 1671 (849) |
1730 (832) |
.18 | 1752 (805) |
1644 (899) |
N/A | N/A | 1763 (1032) |
.25 | 1659 (725) |
1769 (819) |
.39 |
| Urine pH | 6.0 (0.78) |
6.0 (0.77) |
.32 | 6.0 (0.75) |
6.3 (0.79) |
N/A | N/A | 5.5 (0.70) |
<.001 | 6.1 (0.66) |
5.9 (0.76) |
.01 |
| Microhematuria, % | 90 | 89 | .23 | 88 | 89 | 100 | 100 | 93 | .41 | 90 | 88 | .46 |
Laboratories were available in a subset for serum calcium (75%), phosphorus (65%), uric acid (61%), and bicarbonate (41%); for urine calcium (37%), citrate (34%), oxalate (44%), phosphorus (30%), uric acid (29%), sodium (49%), volume (39%), and pH (83%); and microhematuria (85%).
Unadjusted associations; Kruskal-wallis, Wilcoxon and T-tests were used to calculate p-values for continuous variables; chi-squared tests were used to calculate p-values for categorical variables.
N/A: Not available as number of subjects too few for analysis
Calcium oxalate stones were associated with male gender, absence of urinary tract infection or fever, family history of stones, and higher urine oxalate. Characteristics of the subset with majority COD rather than majority COM stones were younger age, lower BMI, family history of stones, gross hematuria, lower urinary tract symptoms, higher serum calcium, higher urine pH, higher urine calcium, and they were less likely to have diabetes and hypertension. Patients with unknown stone compositions had smaller stones, were more likely to have a stone on imaging that was located in the ureterovesical junction, and were less likely to have a family history of stones or require surgery. Overall, only 1.6% (24/1488) received stone prevention medications at the first stone episode. There was documented recommendations for increased water intake in 87% (1287/1488) and diet alterations in 29% (431/1488), but these treatments did not vary by stone composition (p=.10 for both).
A multivariable multinomial regression model was developed to estimate the four most common stone compositions: uric acid, hydroxyapatite, COM, or COD at the first episode. Struvite and brushite were too rare to include in the model. Included predictors were age, gender, family history of stones, loose stools, body mass index, diabetes, hypertension, gout, obstructing stone in renal pelvis, serum calcium, serum phosphorus, serum uric acid, urine calcium, urine oxalate, urine pH, and microhematuria. Only the 24% (353/1462) with complete data were included in the model. Age, gender, body mass index, diabetes, obstructing stone in renal pelvis, serum phosphorus, and urine calcium were statistically significant in the multivariable model (p<0.05 for all). However, the ability of the model to improve discrimination of composition was limited. Assuming a stone was COM was correct 65% of the time, whereas using the model to estimate composition was correct 69% of the time.
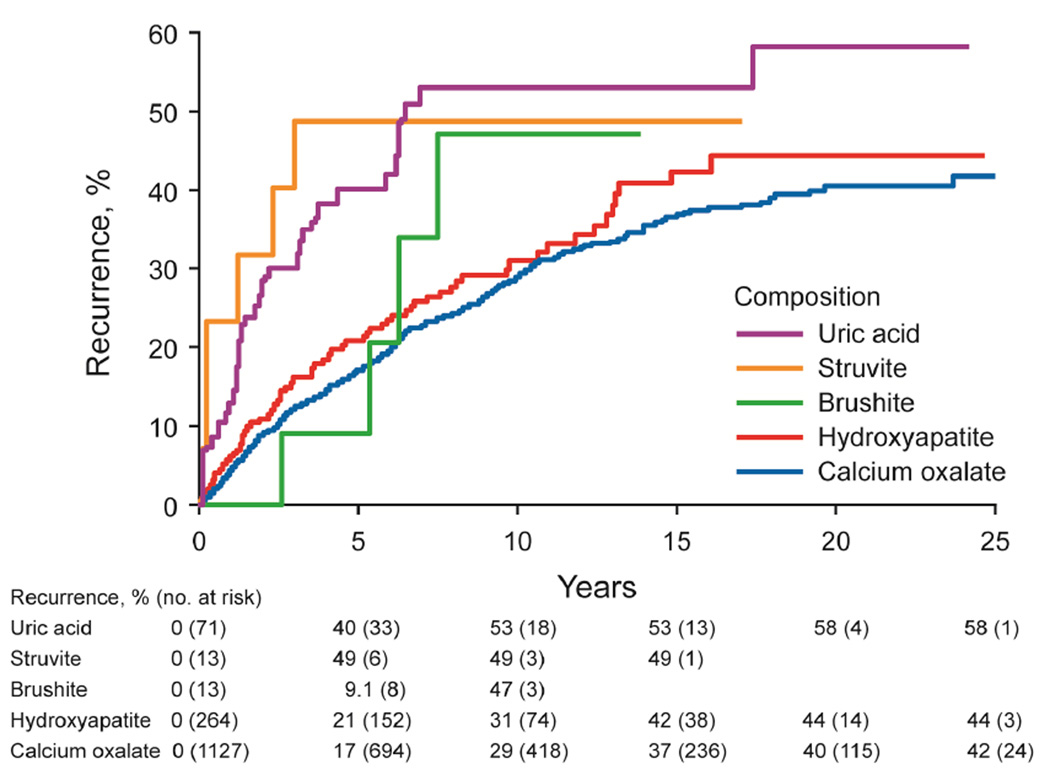
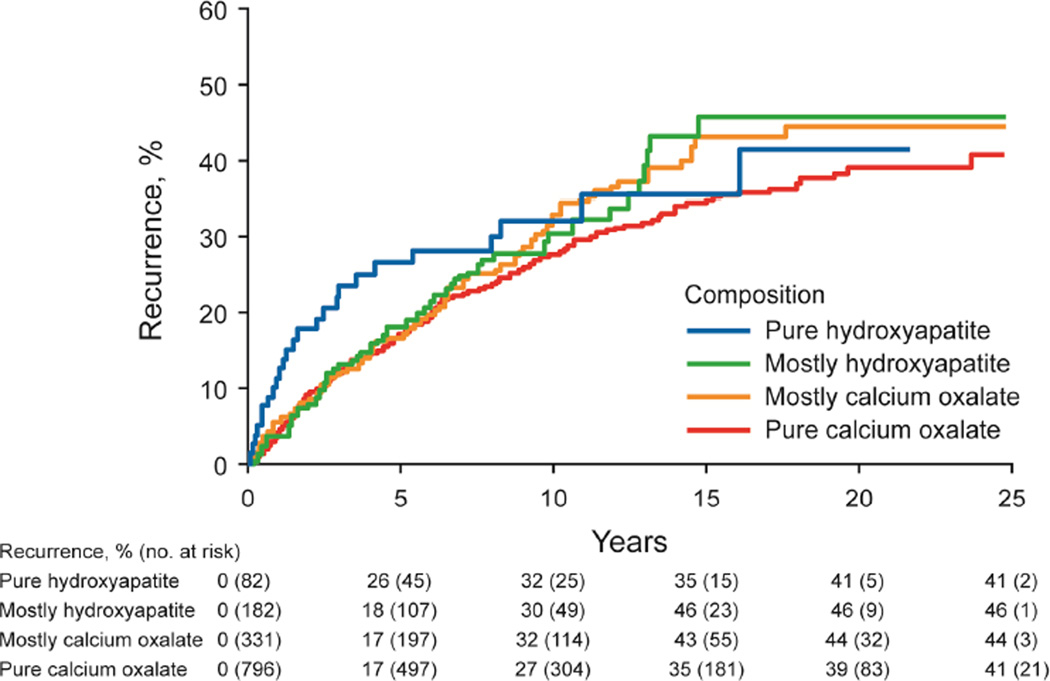
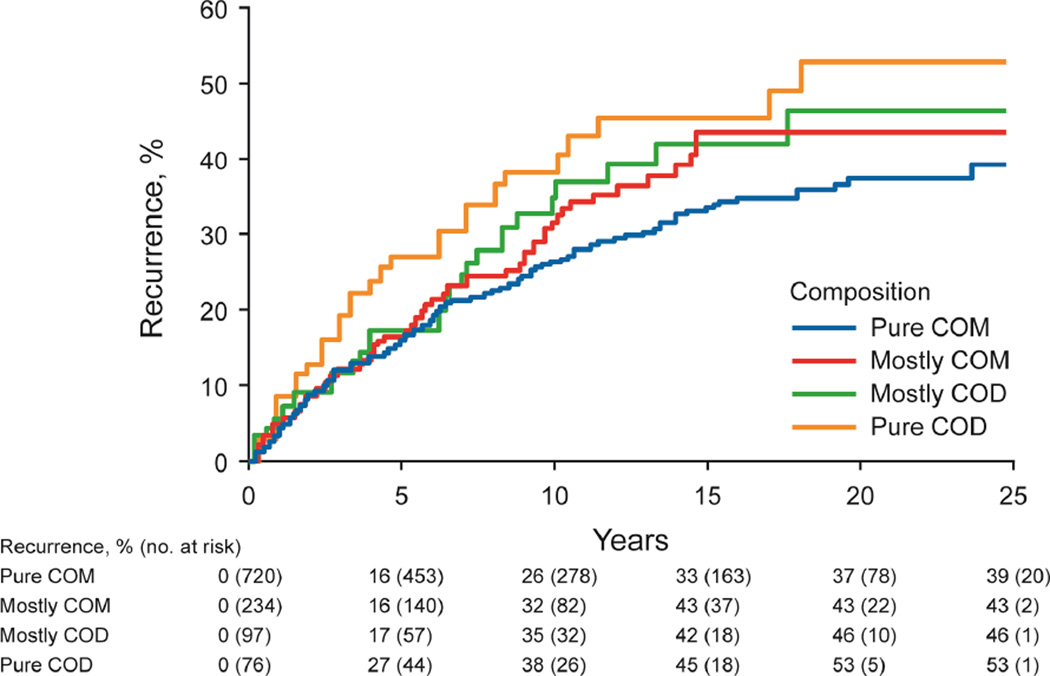
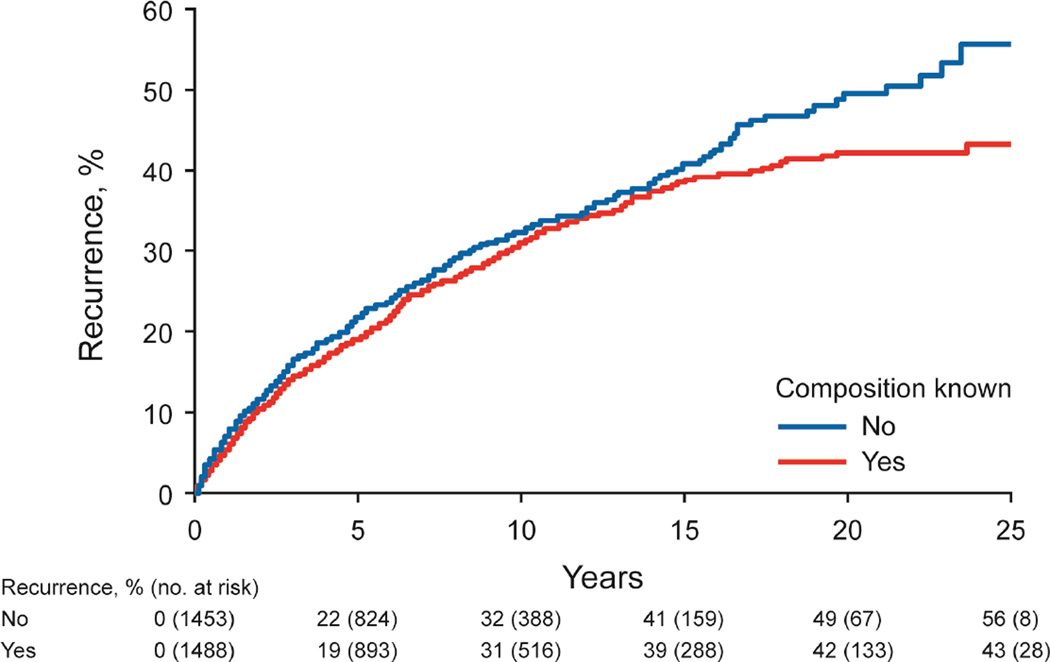
The risk of stone recurrence varied by the major composition groups (Figure 3A, P<.001). At 10 years, the risk of symptomatic recurrence was higher for uric acid (53%), struvite (49%), and brushite (47%) compared to hydroxyapatite (31%) and calcium oxalate (29%) stones (P<.001). Using the ROKS nomogram to account for other clinical and radiographic characteristics predictive recurrence besides composition,14 the actual risk of recurrence in brushite and struvite stone formers was more consistent with the estimated risk of recurrence assuming a stone composition of uric acid rather than common calcium (not uric acid) (Supplemental Figure 2). For common calcium stones, the ratio of hydroxyapatite to calcium oxalate category was not significantly associated with recurrence (Figure 3B, P-trend = .10), even with modeling the ratio as continuous (p=0.53). Graphically there was an increased risk of early recurrence for pure hydroxyapatite stones. Among calcium oxalate stones, a higher fraction of COD than COM associated with higher risk of recurrence (Figure 3C, P-trend=.007). Symptomatic recurrence was not significantly higher for those with unknown vs known first stone composition (Figure 3D, P=.06), though graphically, the risk appeared to be higher in those with unknown compositions after 15 years.
Figure 3.
- major stone composition groups (n=1488, P < .001)
- common calcium stone subgroups (n=1391, P-trend = .10)
- calcium oxalate stone subgroups (n=1127, P-trend = .007)
- known vs unknown composition (n=2961, P = .06)
Discussion
Referral-based studies of prevalent stone formers have commonly reported 75–85% of all stones are common calcium stones.10–12,15 However, we found that first-time stone formers in the community were even more likely to have a common calcium stone (94% overall). Uric acid accounted for 4.8% of first-time stone formers, while brushite and struvite compositions were rare (0.9%) and cystine was very rare (0.1%). Among common calcium stones, calcium oxalate (76% overall) was a very common composition. Consistent with this finding, one prior report of first-time stone formers in the community identified 78% of women and 86% of men as having calcium oxalate stone compositions, but other compositions were not reported.16
We found that stone compositions were less likely to change between episodes for the common compositions, particularly calcium oxalate. Overall, 21% had a different composition between the first and second episode, findings that are similar to another study.17 A transition from rare to common composition was more likely than a transition from a common to rare composition consistent with regression to the mean. In other words, regardless of the first stone composition there is propensity toward more common compositions with the next stone.
Common calcium stones were more likely to associate with a family history of stones, suggesting a stronger genetic component to formation of these stones. Consistent with prior studies, calcium oxalate stones are more common in men.15,18,19 We also found that higher urine oxalate and family history of stones associated with calcium oxalate stones. Prior investigations have shown that COD stones are relatively more common among younger patients with higher urine pH and urine calcium levels compared to COM.20 While confirming these findings, we have further found that COD is associated with higher serum calcium than COM. The COD subgroup also experienced more gross hematuria and lower urinary tract symptoms. This is consistent with urothelium injury from the sharp edges of bipyramidal crystals in COD stones compared to the smooth or mulberry shaped surfaces of COM stones.21,22 First-time uric acid stone formers associated with many of the same characteristics reported in referral-based prevalent stone former studies including lower urine pH,3,23 higher serum uric acid,24 higher BMI,25 older age,15,26 diabetes,3,27 gout,28 and hypertension.29 We also confirm that in first-time stone formers, hydroxyapatite stones associated with female gender, younger age, and higher urine pH.15,19,30,31
While clinical and laboratory characteristics varied with stone composition, there was also considerable overlap. Estimating stone composition (COM, COD, hydroxyapatite, or uric acid) from these characteristics had a 69% probability of being accurate compared to assuming a COM stone, which had 65% probability of being accurate. This model did not include struvite, brushite, or cystine stones because they were too rare among first-time stone formers. Notably, most of the first-time stone formers lack key laboratory tests (particularly urine chemistries) needed to even attempt to estimate stone composition. Since 94% of first-time stone formers have common calcium stones, prevention strategies can assume a common calcium stone when composition is not available.
When available, stone composition helps with estimating risk of recurrence after the first stone. The natural history of recurrence was feasible in this study because few received stone prevention medications. Uric acid, struvite, and brushite stone formers were more likely to have symptomatic recurrence (approximately 50% at 10 years) than common calcium stone formers (approximately 30% at 10 years). Thus, the ROKS nomogram14 can include brushite and struvite as being equivalent to uric acid as high-risk compositions for predicting symptomatic recurrence. Uric acid stones primarily occur from low urine pH and high urate excretion, and until these metabolic abnormalities are treated, a high rate of recurrence is expected.32 Brushite stone formers often have hypercalcuria and other metabolic abnormalities (e.g., distal renal tubular acidosis) that contribute to a high rate of recurrence.31 Recurrent urinary tract infections likely contribute to the higher risk of recurrence with struvite stone. Cystine stones have a high rate of recurrence due to genetic cystinuria.33,34 Consistent with their high recurrence rates, uric acid, struvite, brushite, and cystine stones became progressively more common among stone formers with each subsequent stone composition analysis.
Among common calcium stone formers, the proportion of hydroxyapatite to calcium oxalate was not predictive of recurrence. Prior work found a higher proportion of phosphate than oxalate in stones among recurrent calcium stone formers, but this may have been due to the brushite (not hydroxyapatite) form of calcium phosphate stones (4% of stone formers in this referral population had brushite).35 Among calcium oxalate stone formers, a higher proportion of COD than COM predicts a higher risk of recurrence, as previously hypothesized.20
The current study has potential limitations. Stone composition was unknown in half of the stone formers at their first event consistent with another study of first-time stone formers.16 Most first-time stone formers have spontaneous passage of their stone without requiring surgery affording less opportunity for stone collection and analysis. However, clinical and laboratory characteristics between stone formers with known and unknown stone composition were similar. The few differences suggesting unknown composition associates with a stone being discarded or lost without composition analysis (symptomatic stone detected by imaging rather than passage, smaller stone located in ureterovesical junction, and no surgery). In a separate ongoing prospective study, we have found very few stone formers save stones that were not initially analyzed for composition at the first stone event. Novel computed tomography techniques have the potential to determine stone composition,36,37 but are currently not widely implemented in clinical practice. Blood and urine chemistry data was also unavailable in many first-time stone formers, reflecting the reality of limited metabolic evaluations in first-time stone formers. The studied population of Olmsted County, Minnesota was predominantly white (88%) and findings may be less generalizable to other ethnic groups or geographic locations.
Conclusion
If the stone is not available for analysis in a first-time symptomatic stone former, prevention interventions can be based on the assumption that the patient has a common calcium stone (94% probability). However, the 5% with uric acid stones and the 1% with even rarer compositions are more likely to recur and stone composition analysis to identify these high-risk patients is of benefit. In particular, knowing stone composition informs stone prevention diets and medications (for example, potassium citrate would be more effective than a thiazide diuretic for uric acid stones)
Supplementary Material
Acknowledgements
This project was supported by grants from the National Institute of Diabetes and Digestive and Kidney Diseases (Mayo Clinic O’Brien Urology Research Center, DK100227 and DK83007) and made possible by the Rochester Epidemiology Project (R01-AG034676; Principal Investigators: Walter A. Rocca, MD, and Barbara P. Yawn, MD, MSc) from the National Institutes of Health, U.S. Public Health Service. The funding source had no role in the study design, conduct, or reporting.
Abbreviations
- COM
Calcium Oxalate Monohydrate
- COD
Calcium Oxalate Dihydrate
- BMI
Body Mass Index
- ROKS
Recurrence Of Kidney Stone
Footnotes
Publisher's Disclaimer: This is a PDF file of an unedited manuscript that has been accepted for publication. As a service to our customers we are providing this early version of the manuscript. The manuscript will undergo copyediting, typesetting, and review of the resulting proof before it is published in its final citable form. Please note that during the production process errors may be discovered which could affect the content, and all legal disclaimers that apply to the journal pertain.
References
- 1.Scales CD, Jr, Smith AC, Hanley JM, Saigal CS. Prevalence of kidney stones in the United States. European urology. 2012;62:160–165. doi: 10.1016/j.eururo.2012.03.052. [DOI] [PMC free article] [PubMed] [Google Scholar]
- 2.El-Zoghby ZM, Lieske JC, Foley RN, et al. Urolithiasis and the risk of ESRD. Clinical journal of the American Society of Nephrology : CJASN. 2012;7:1409–1415. doi: 10.2215/CJN.03210312. [DOI] [PMC free article] [PubMed] [Google Scholar]
- 3.Pak CY, Poindexter JR, Adams-Huet B, Pearle MS. Predictive value of kidney stone composition in the detection of metabolic abnormalities. Am J Med. 2003;115:26–32. doi: 10.1016/s0002-9343(03)00201-8. [DOI] [PubMed] [Google Scholar]
- 4.Kourambas J, Aslan P, Teh CL, Mathias BJ, Preminger G. Role of stone analysis in metabolic evaluation and medical treatment of nephrolithiasis. J.Endourol. 2001;15:181–186. doi: 10.1089/089277901750134548. [DOI] [PubMed] [Google Scholar]
- 5.Kasidas GP, Samuell CT, Weir TB. Renal stone analysis: why and how? Ann Clin Biochem. 2004;41:91–97. doi: 10.1258/000456304322879962. [DOI] [PubMed] [Google Scholar]
- 6.Daudon M. [Analysis and classification of calculi: contribution to the etiology of calculous disease] Rev Med Suisse Romande. 2004;124:445–453. [PubMed] [Google Scholar]
- 7.Skolarikos A, Straub M, Knoll T, et al. Metabolic Evaluation and Recurrence Prevention for Urinary Stone Patients: EAU Guidelines. Eur Urol. 2015;67:750–763. doi: 10.1016/j.eururo.2014.10.029. [DOI] [PubMed] [Google Scholar]
- 8.Pearle MS, Goldfarb DS, Assimos DG, et al. Medical management of kidney stones: AUA guideline. J Urol. 2014;192:316–324. doi: 10.1016/j.juro.2014.05.006. [DOI] [PubMed] [Google Scholar]
- 9.Qaseem A, Dallas P, Forciea MA, Starkey M, Denberg TD. Dietary and pharmacologic management to prevent recurrent nephrolithiasis in adults: a clinical practice guideline from the American College of Physicians. Ann Intern Med. 2014;161:659–667. doi: 10.7326/M13-2908. [DOI] [PubMed] [Google Scholar]
- 10.Moe OW. Kidney stones: pathophysiology and medical management. Lancet. 2006;367:333–344. doi: 10.1016/S0140-6736(06)68071-9. [DOI] [PubMed] [Google Scholar]
- 11.Herring LC. Observations on the analysis of ten thousand urinary calculus. J.Urol. 1962;88:545–555. doi: 10.1016/S0022-5347(17)64842-0. [DOI] [PubMed] [Google Scholar]
- 12.Mandel NS, Mandel GS. Urinary tract stone disease in the United States veteran population. I. Geographical frequency of occurrence. J.Urol. 1989;142:1513–1515. doi: 10.1016/s0022-5347(17)39144-9. [DOI] [PubMed] [Google Scholar]
- 13.Rocca WA, Yawn BP, St Sauver JL, Grossardt BR, Melton LJ., 3rd History of the Rochester Epidemiology Project: half a century of medical records linkage in a US population. Mayo Clin Proc. 2012;87:1202–1213. doi: 10.1016/j.mayocp.2012.08.012. [DOI] [PMC free article] [PubMed] [Google Scholar]
- 14.Rule AD, Lieske JC, Li X, Melton LJ, 3rd, Krambeck AE, Bergstralh EJ. The ROKS Nomogram for Predicting a Second Symptomatic Stone Episode. J Am Soc Nephrol. 2014;25:2878–2886. doi: 10.1681/ASN.2013091011. [DOI] [PMC free article] [PubMed] [Google Scholar]
- 15.Lieske JC, Rule AD, Krambeck AE, et al. Stone composition as a function of age and sex. Clin J Am Soc Nephrol. 2014;9:2141–2146. doi: 10.2215/CJN.05660614. [DOI] [PMC free article] [PubMed] [Google Scholar]
- 16.Taylor EN, Curhan GC. Oxalate intake and the risk for nephrolithiasis. J Am Soc Nephrol. 2007;18:2198–2204. doi: 10.1681/ASN.2007020219. [DOI] [PubMed] [Google Scholar]
- 17.Lee TT, Elkoushy MA, Andonian S. Are stone analysis results different with repeated sampling? Can Urol Assoc J. 2014;8:E317–E322. doi: 10.5489/cuaj.1872. [DOI] [PMC free article] [PubMed] [Google Scholar]
- 18.Daudon M, Donsimoni R, Hennequin C, et al. Sex- and age-related composition of 10 617 calculi analyzed by infrared spectroscopy. Urol Res. 1995;23:319–326. doi: 10.1007/BF00300021. [DOI] [PubMed] [Google Scholar]
- 19.Gault MH, Chafe L. Relationship of frequency, age, sex, stone weight and composition in 15,624 stones: comparison of resutls for 1980 to 1983 and 1995 to 1998. J Urol. 2000;164:302–307. [PubMed] [Google Scholar]
- 20.Pierratos AE, Khalaff H, Cheng PT, Psihramis K, Jewett MA. Clinical and biochemical differences in patients with pure calcium oxalate monohydrate and calcium oxalate dihydrate kidney stones. J Urol. 1994;151:571–574. doi: 10.1016/s0022-5347(17)35017-6. [DOI] [PubMed] [Google Scholar]
- 21.Daudon M, Bader CA, Jungers P. Urinary calculi: review of classification methods and correlations with etiology. Scanning Microsc. 1993;7:1081–1104. discussion 1104-1086. [PubMed] [Google Scholar]
- 22.Duan X, Qu M, Wang J, et al. Differentiation of calcium oxalate monohydrate and calcium oxalate dihydrate stones using quantitative morphological information from micro-computerized and clinical computerized tomography. J Urol. 2013;189:2350–2356. doi: 10.1016/j.juro.2012.11.004. [DOI] [PMC free article] [PubMed] [Google Scholar]
- 23.Maalouf NM, Cameron MA, Moe OW, Sakhaee K. Novel insights into the pathogenesis of uric acid nephrolithiasis. Curr Opin Nephrol Hypertens. 2004;13:181–189. doi: 10.1097/00041552-200403000-00006. [DOI] [PubMed] [Google Scholar]
- 24.Khatchadourian J, Preminger GM, Whitson PA, Adams-Huet B, Pak CY. Clinical and biochemical presentation of gouty diathesis: comparison of uric acid versus pure calcium stone formation. J Urol. 1995;154:1665–1669. doi: 10.1016/s0022-5347(01)66743-0. [DOI] [PubMed] [Google Scholar]
- 25.Abate N, Chandalia M, Cabo-Chan AV, Jr, Moe OW, Sakhaee K. The metabolic syndrome and uric acid nephrolithiasis: novel features of renal manifestation of insulin resistance. Kidney Int. 2004;65:386–392. doi: 10.1111/j.1523-1755.2004.00386.x. [DOI] [PubMed] [Google Scholar]
- 26.Krambeck AE, Lieske JC, Li X, Bergstralh EJ, Melton LJ, 3rd, Rule AD. Effect of age on the clinical presentation of incident symptomatic urolithiasis in the general population. J Urol. 2013;189:158–164. doi: 10.1016/j.juro.2012.09.023. [DOI] [PMC free article] [PubMed] [Google Scholar]
- 27.Sakhaee K, Adams-Huet B, Moe OW, Pak CY. Pathophysiologic basis for normouricosuric uric acid nephrolithiasis. Kidney Int. 2002;62:971–979. doi: 10.1046/j.1523-1755.2002.00508.x. [DOI] [PubMed] [Google Scholar]
- 28.Shekarriz B, Stoller ML. Uric acid nephrolithiasis: current concepts and controversies. J Urol. 2002;168:1307–1314. doi: 10.1016/S0022-5347(05)64439-4. [DOI] [PubMed] [Google Scholar]
- 29.Cirillo M, Laurenzi M. Elevated blood pressure and positive history of kidney stones: results from a population-based study. J Hypertens Suppl. 1988;6:S485–S486. doi: 10.1097/00004872-198812040-00153. [DOI] [PubMed] [Google Scholar]
- 30.Daudon M, Dore JC, Jungers P, Lacour B. Changes in stone composition according to age and gender of patients: a multivariate epidemiological approach. Urological research. 2004;32:241–247. doi: 10.1007/s00240-004-0421-y. [DOI] [PubMed] [Google Scholar]
- 31.Krambeck AE, Handa SE, Evan AP, Lingeman JE. Profile of the brushite stone former. J Urol. 2010;184:1367–1371. doi: 10.1016/j.juro.2010.05.094. [DOI] [PMC free article] [PubMed] [Google Scholar]
- 32.Kenny JE, Goldfarb DS. Update on the pathophysiology and management of uric acid renal stones. Curr Rheumatol Rep. 2010;12:125–129. doi: 10.1007/s11926-010-0089-y. [DOI] [PubMed] [Google Scholar]
- 33.Selby MG, Vrtiska TJ, Krambeck AE, et al. Quantification of asymptomatic kidney stone burden by computed tomography for predicting future symptomatic stone events. Urology. 2015;85:45–50. doi: 10.1016/j.urology.2014.08.031. [DOI] [PMC free article] [PubMed] [Google Scholar]
- 34.Coe FL, Parks JH. Nephrolithiasis: Pathogenesis and Treatment. 2 ed. Chicago: Year Book Medical Publishers; 1988. Cystine Stones; pp. 269–275. [Google Scholar]
- 35.Mandel N, Mandel I, Fryjoff K, Rejniak T, Mandel G. Conversion of calcium oxalate to calcium phosphate with recurrent stone episodes. J Urol. 2003;169:2026–2029. doi: 10.1097/01.ju.0000065592.55499.4e. [DOI] [PubMed] [Google Scholar]
- 36.Leng S, Shiung M, Ai S, et al. Feasibility of discriminating uric acid from non-uric acid renal stones using consecutive spatially registered low- and high-energy scans obtained on a conventional CT scanner. AJR Am J Roentgenol. 2015;204:92–97. doi: 10.2214/AJR.13.11911. [DOI] [PMC free article] [PubMed] [Google Scholar]
- 37.Liu Y, Qu M, Carter RE, et al. Differentiating calcium oxalate and hydroxyapatite stones in vivo using dual-energy CT and urine supersaturation and pH values. Acad Radiol. 2013;20:1521–1525. doi: 10.1016/j.acra.2013.08.018. [DOI] [PMC free article] [PubMed] [Google Scholar]
Associated Data
This section collects any data citations, data availability statements, or supplementary materials included in this article.


