

Abstract
Background
Ginsenoside Rg3 is a promising anticancer agent. It is usually produced by heat treatment of ginseng, in which ginsenoside Rb1 is the major ginsenoside. A kinetic study was conducted to optimize ginsenoside Rg3 production by the heat treatment of ginsenoside Rb1.
Methods
Ginsenoside Rb1 was heated using an isothermal machine at 80°C and 100°C and analyzed using HPLC. The kinetic parameters were calculated from the experimental results. The activation energy was estimated and used to simulate the process. The optimized parameters of ginsenoside Rg3 production are suggested based on the simulation.
Results
The rate constants were 0.013 h−1 and 0.073 h−1 for the degradation of ginsenosides Rb1 and Rg3 at 80°C, respectively. The corresponding rate constants at 100°C were 0.045 h−1 and 0.155 h−1. The estimated activation energies of degradation of ginsenosides Rb1 and Rg3 were 69.2 kJ/mol and 40.9 kJ/mol, respectively. The rate constants at different temperatures were evaluated using the estimated activation energies, and the kinetic profiles of ginsenosides Rb1 and Rg3 at each temperature were simulated based on the proposed kinetic model of consecutive reaction. The optimum strategies for producing ginsenoside Rg3 from ginsenoside Rb1 are suggested based on the simulation. With increased temperature, a high concentration of ginsenoside Rg3 is formed rapidly. However, the concentration decreases quickly after the reaching the maximal concentration value.
Conclusion
The optimum temperature for producing ginsenoside Rg3 should be the highest temperature technically feasible below 180°C, in consideration of the cooling time. The optimum reaction time for heat treatment is 30 min.
Keywords: ginsenoside Rg3, heat, kinetics, optimization, simulation
1. Introduction
Ginseng is a long-living perennial plant that is highly valued in herbal medicine. It has been used for over 2,000 years in some East Asian countries, such as Korea, China, Japan, and Vietnam [1]. The most important biologically active compounds in ginseng are called ginsenosides, which are chemically described as ginseng saponins. More than 30 ginsenosides have been found in ginseng. Some special ginsenosides are found only in red ginseng, such as Rg3, Rh2, Rh4, Rg5, and Rk1. These compounds are products of the steaming process [2].
Ginsenosides are important chemotherapeutic agents. Ginsenoside Rg3, in particular, inhibits platelet aggregation and cancer cell metastasis while inducing vasorelaxation [3]. Ginsenoside Rg3 also decreased the proliferation of breast cancer cells, such as MCF-7 and MDA-MB-231 cells [4]. Therefore, ginsenoside Rg3 is a promising anticancer agent with a higher value than other ginsenosides. Increasing ginsenoside Rg3 concentration would add more value to red ginseng [5].
Ginsenoside Rg3 is mostly produced from protopanaxadiol (PPD) ginsenosides, such as Rb1, Rb2, Rc, and Rd. The process involves attacking the C-20 glycosidic bond through acid treatment or heat processing [6]. However, ginsenoside Rg3 is also degraded to ginsenosides Rg5 and Rk1 by further dehydration at the C-20 position [6], [7]. Therefore, ginsenoside Rg3 is an intermediate compound in the heat processing of the PPD-type saponins.
Many studies on the conversion of PPD ginsenoside to ginsenoside Rg3 have conducted experiments using heat-treatment methods [7], [8], [9], [10], [11], [12]. Although heat treatment is very helpful in breaking the glucoside bond, finding the optimum concentration of ginsenoside Rg3 requires many experiments at different temperatures and reaction times. However, this entails substantial costs, time, and human effort. There have been a few studies related to the kinetics of ginseng heat treatment. Ren and Chen [11] calculated the rate constants for some compounds in American ginseng extract during its degradation. Choi et al [12] also calculated the rate constants and the activation energy of the ginsenosides Rb1, Rb2, Rc, Rd, Re, and Rg1 in Panax ginseng extract. However, no studies have simulated the heating process with kinetic parameters for the optimum production of ginsenoside Rg3. Therefore, this study aims to optimize ginsenoside Rg3 production through such a simulation using kinetic parameters estimated from a limited number of kinetic experiments.
A simple kinetic model for the production of ginsenoside Rg3 by heat degradation of ginsenoside Rb1 is proposed. The rate constants and activation energies were estimated from kinetic experiments at 80°C and 100°C. Ginsenoside Rb1 is a major ginsenoside in most kinds of ginseng—1.123% in P. ginseng [13], 3.7% in Panax quinquefolius ginseng [14], 2.74% in Panax notoginseng [15], and approximately 4% in Panax vietnamensis ginseng (our data). Thus, it was chosen as the key reactant to produce ginsenoside Rg3.
The rate constants at different temperatures were evaluated using the estimated activation energies. The kinetic profiles of ginsenosides Rb1 and Rg3 at each temperature were simulated based on the proposed kinetic model of consecutive reaction. Finally, the optimum strategies for ginsenoside Rg3 production by heat treatment of ginsenoside Rb1 were suggested from the simulation results. This novel method can be used to estimate the optimum reaction time and temperature to achieve the highest ginsenoside Rg3 production. This method helps to save substantial resources and gives better understanding of the reaction mechanism of ginsenoside glucosylation involving heat treatment.
2. Materials and methods
2.1. Materials
PLC-grade acetonitrile was purchased from Merck (Darmstadt, Germany). Deionized water was prepared using a Milli-Q water purification system (Millipore, Bedford, MA, USA). All other chemicals and solvents were of analytical grade. Standards of ginsenosides Rb1, Rg3, Rh2, Rg5, and Rk1 were purchased from HWI ANALYTIK GmbH (Rülzheim, Germany). Stock solutions of the standards were prepared by dissolving with methanol (1 mg/mL) and the solutions were stored at 4°C for further analysis.
2.2. Sample preparation and heat treatment
The ginsenoside Rb1 standard was dissolved in 80% methanol. Approximately 1 mg/mL (1,000 ppm) of ginsenoside Rb1 was added to closed bottles and kept inside an isothermal reactor for thermal degradation at 80°C and 100°C for 1–6 h. Then, the thermally degraded products were recovered and filtered through a 0.25-μm hydrophilic polypropylene membrane (Toyo Roshi Kaisha, Ltd., Japan) for HPLC analysis.
2.3. HPLC analysis
The HPLC analysis was performed using a Shimadzu system with two 510 pumps and a UV spectrophotometric detector (Shimadzu C-20; Japan). The product mixture solutions containing ginsenosides (20-μL aliquots) were separated and analyzed using a 5.0-μm 120-5-C18-ace-EPS column (250 mm × 4.6 mm, Pronto Sil; Germany) at 30°C. The mobile phase was 15–34.5% acetonitrile in distilled water from 0 min to 10 min, 34.5–47.5% from 10 min to 25 min, 47.5–80% from 25 min to 40 min, 80–100% from 40 min to 50 min, 100% from 50 min to 55 min, and 15% from 55 min to 56 min. The flow rate was kept constant at 1.0 mL/min. The absorbance was measured at a wavelength of 203 nm to facilitate ginsenoside detection. Chromatographic peaks were identified by comparing retention times against known standards.
2.4. Kinetic model and parameter estimations
Fig. 1 shows the change in PPD ginsenoside following heat treatment [8]. To produce ginsenoside Rh2 directly from ginsenoside Rb1, glucosyl residue at both C-3 and C-20 must be eliminated at the same time. Because it should be much slower than ginsenoside Rb1 degradation to ginsenoside Rg3, this reaction is assumed not to occur. The following kinetic model of consecutive reaction is proposed for the heat treatment of ginsenoside Rb1 to produce ginsenoside Rg3:
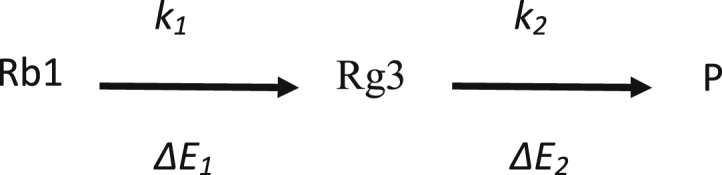
where P represents the reaction products of ginsenoside Rg3 degradation, such as ginsenosides Rh2, Rg5, and Rk1.
Fig. 1.

Elimination of glycosyl residue of ginsenoside Rb1 in ginseng by heat treatment (R: Glc–Glc).
Eq. (1) describes the degradation kinetics of ginsenoside Rb1 during heat treatment.
| (1) |
Eq. (2) describes the kinetics of ginsenoside Rg3 during heat treatment according to the proposed kinetic model. The optimum reaction time for the maximum ginsenoside Rg3 concentration was found by differentiating Eq. (2) and calculating the time at which d[Rg3]/dt = 0. (3), (4) were used to calculate the optimum reaction time and concentration of ginsenoside Rg3.
| (2) |
| (3) |
| (4) |
In these equations, [Rb1] is the concentration of ginsenoside Rb1 at time t (ppm), [Rb1]0 is the initial ginsenoside Rb1 concentration (ppm), k1 is the first-order degradation rate constant of ginsenoside Rb1 (h−1), [Rg3] is the ginsenoside Rg3 concentration at time t (ppm), k2 is the first-order degradation rate constant of ginsenoside Rg3 (h−1), t is time (h), tmax is the optimum reaction time of ginsenoside Rg3 production (h), and [Rg3]max is the optimum ginsenoside Rg3 concentration (ppm).
The activation energy can be estimated from the Arrhenius law as follows:
| (5) |
where ΔE is the activation energy (J/mol), R is the gas constant (8.314 J/mol/K), T1 and T2 are temperatures in Kelvin (K), kT1 is the rate constant at temperature T1 (h−1), and kT2 is the rate constant at temperature T2 (h−1).
The activation energy was calculated using Eq. (5), and the rate constant k at different temperatures was calculated using Eq. (6)
| (6) |
where A0 is the Arrhenius constant. The rate constants were estimated based on a nonlinear regression method, which best fits the experimental data to the proposed mathematical models using LabFit software from Federal University of Cambina Grande (Cambina Grande, Paraiba, Brazil).
3. Results and discussion
3.1. Rate constant at 100°C
Ginsenoside Rb1 solution was heat treated for 1–6 h. The HPLC analysis results of the reaction products (Fig. 2) were used to estimate the kinetic parameters of ginsenoside. There are two kinds of ginsenoside Rg3, namely, 20(S)-Rg3 and 20(R)-Rg3. However, only 20(S)-Rg3 changed significantly (Fig. 2, Fig. 3). Therefore, the amounts of both kinds of ginsenoside Rg3 were added together and represented as ginsenoside Rg3 in this study.
Fig. 2.

HPLC chromatogram of ginsenosides detected upon heating the ginsenoside Rb1 standard at different times at 100°C. Peaks: 1, Rb1; 2, 20(S)-Rg3; 3, 20(R)-Rg3; 4, Rk1; 5, Rg5; 6, Rh2.
Fig. 3.

HPLC chromatogram of ginsenosides detected upon heating the ginsenoside Rb1 standard at different times at 80°C. Peaks: 1, Rb1; 2, 20(S)-Rg3; 6, Rh2.
The kinetics of the heat treatment of ginsenosides was investigated by plotting the concentrations over time. The changes in the concentration of ginsenosides Rb1 and Rg3 after heat treatment at 100°C are shown in Fig. 4. Ginsenoside Rk1 was detected during the reaction, however, it is not considered in the kinetic model due to its negligible formation.
Fig. 4.

Estimation of rate constants at 100°C using LabFit. (A) Ginsenoside Rb1 degradation. (B) Ginsenoside Rg3 formation. Each reported value is the mean of three replications.
As shown in Fig. 4A, the concentration of ginsenoside Rb1 decreased exponentially from 1,000 ppm to 771 ppm after 6 h. This result could explain the content of ginsenoside Rb1 that was still available at a high concentration in red ginseng after the steaming process. By contrast, the concentration of ginsenoside Rg3 increased slowly to 144 ppm at 5 h of treatment (Fig. 4B). Despite this increase, the amount of ginsenoside Rg3 was still lower than the decreased amount of ginsenoside Rb1. This could be explained by the degradation of ginsenoside Rg3 to other ginsenosides, such as Rh2, Rg5, and Rk1. The concentrations of ginsenosides Rh2, Rk1, and Rg5 also increased with the heating time (Fig. 2). These results confirmed that ginsenoside Rb1 was converted into ginsenosides Rg3, Rk1, Rh2, and Rg5 by heat processing through glucosyl elimination and epimerization of C-20 by SN1 reaction [9].
The rate constants k1 and k2 in Eqs. (1) and (2) were estimated using LabFit based on a nonlinear regression method. The rate constants of ginsenoside Rb1 degradation in P. ginseng extract and in American ginseng extract were reported to be 0.023 h−1 [12] and 0.031 h−1 [11], respectively. In this study, this value was found to be 0.045 h−1. This rate constant is higher for ginsenoside Rb1 degradation, meaning that the heat degradation was faster than in previous studies. This might be explained by the different materials and methods used. Whereas other researchers used ginseng extract as a reactant to calculate rate constants, we used only ginsenoside Rb1 standard to remove any interference in the heat transfer and heat of reaction from the side reactions by other compounds in the extracts.
The rate constant of ginsenoside Rg3 degradation should be the sum of the rate constants for the formation of every product converted from Rg3. The estimated rate constant k1 (0.045 h−1) of ginsenoside Rb1 degradation was much smaller than k2 (0.155 h−1), the constant for ginsenoside Rg3 degradation. This means that ginsenoside Rg3 degradation occurred more easily than its formation. Therefore, it is necessary to find the optimum ginsenoside Rg3 concentration and heat-treatment time for the production of high-value ginsenoside Rg3 by steaming. The optimum reaction time for ginsenoside Rg3 production at 100°C was approximately 11.243 h (Table 1). At this time, the simulated concentration was 175 ppm.
Table 1.
The rate constants of ginsenoside Rb1 and Rg3 degradation and the optimum reaction time and optimum concentration of Rg3 at various temperatures
| Temperature (°C) | k1 (h−1) | k2 (h−1) | Optimum reaction time (h) | Optimum concentration (ppm) |
|---|---|---|---|---|
| 80 | 0.013 | 0.073 | 28.902 | 119.867 |
| 100 | 0.045 | 0.155 | 11.243 | 175.045 |
| 120 | 0.140 | 0.303 | 4.731 | 238.091 |
| 130 | 0.237 | 0.414 | 3.151 | 271.425 |
| 140 | 0.391 | 0.556 | 2.133 | 305.344 |
| 150 | 0.630 | 0.737 | 1.466 | 339.410 |
| 160 | 0.993 | 0.964 | 1.022 | 373.235 |
| 170 | 1.533 | 1.247 | 0.722 | 406.481 |
| 180 | 2.321 | 1.593 | 0.517 | 438.872 |
| 190 | 3.453 | 2.014 | 0.375 | 470.187 |
| 200 | 5.050 | 2.522 | 0.275 | 500.263 |
| 210 | 7.272 | 3.128 | 0.204 | 528.986 |
| 220 | 10.317 | 3.846 | 0.152 | 556.283 |
| 230 | 14.435 | 4.690 | 0.115 | 582.119 |
3.2. Rate constants at 80°C
The HPLC results are shown in Fig. 3. The same procedure used at 100°C was applied to estimate the rate constant at 80°C. The resulting k1 and k2 were 0.013 h−1 and 0.073 h−1, respectively (Fig. 5). The data for the ginsenosides Rh2, Rk1, and Rg5 concentrations are not shown because they are extremely low (Fig. 3). The rate constant for ginsenoside Rb1 degradation was higher than that obtained by Choi et al [12] (k1 = 0.005 h−1). The reaction rate constants at 80°C were lower than those at 100°C. This means that the heat-degradation reaction at 80°C proceeded more slowly, as expected in other general reactions.
Fig. 5.

Estimation of rate constants at 80°C using LabFit. (A) Ginsenoside Rb1 degradation. (B) Ginsenoside Rg3 formation. Each reported value is the mean of three replications.
The optimum reaction time to produce the maximum concentration of ginsenoside Rg3 was approximately 28.902 h (Table 1). The simulated concentration of ginsenoside Rg3 at this time was 119.867 ppm.
3.3. Activation energy
After estimating the rate constants at 80°C and 100°C, the activation energies of ginsenosides Rb1 and Rg3 were calculated using Eq. (5). The activation energy of ginsenoside Rb1 degradation is as follows:
The activation energy of ginsenoside Rg3 degradation is as follows:
The estimated activation energy of ginsenoside Rb1 degradation was a little lower than that reported by Choi et al [12] (79 kJ/mol). This result might be explained by the different materials used, and the sensitivity of the rate constant to temperature change might differ due to impurities in the reaction mixture that Choi et al [12] used. The calculated activation energies were used to evaluate k1 and k2 for degradation reactions at different temperatures based on Eq. (6). Using these rate constants, the kinetic profile of the ginsenoside Rg3 concentration could be simulated at a particular temperature and reaction time.
3.4. Estimation of optimum reaction time and optimum temperature by simulation
Table 1 shows k1 and k2 at different temperatures. The activation energy ΔE1 of ginsenoside Rb1 degradation is almost double that of ginsenoside Rg3 (ΔE2). Thus, as the temperature increases, the ginsenoside Rb1 degradation rate constant (k1) will increase more rapidly than that of ginsenoside Rg3 degradation (k2). In particular, at high temperatures, k1 would be much higher than k2, which means that ginsenoside Rg3 would be formed very quickly and reach a high concentration. However, in the heat treatment of ginseng extract or in an actual industrial process, the ginsenoside Rg3 content could not be as high as shown in the simulation, because ginsenoside Rb1 is not only converted into ginsenoside Rg3, but is also degraded at any C position and converted into other ginsenosides such as ginsenoside Rh2 [9].
The change in ginsenoside Rb1 concentration at various temperatures is illustrated in Fig. 6. The ginsenoside Rb1 concentration was evaluated using Eq. (1) with the estimated k1 at each temperature. Fig. 7 shows the results of the simulation for ginsenoside Rg3 content at various temperatures. The concentration of ginsenoside Rg3 was evaluated using Eq. (2) with k1 and k2 estimated at each temperature. At 80°C and 100°C, the ginsenoside Rg3 concentration increased gradually up to the optimum (maximum) concentration and then decreased slowly. The optimum concentration of ginsenoside Rg3 was very low. As temperatures increased further, however, the ginsenoside Rg3 concentration increased and then decreased rapidly after the optimum point, and the optimum ginsenoside Rg3 concentration increased.
Fig. 6.

Simulation of ginsenoside Rb1 concentration depending on various temperatures.
Fig. 7.

Simulation of ginsenoside Rg3 concentration depending on various temperatures.
These phenomena can be explained in terms of k1 and k2. At 80°C and 100°C, k1 is very small (0.013 h−1 at 80°C and 0.045 h−1 at 100°C). These values are much smaller than k2 (0.073 h−1 at 80°C and 0.155 h−1 at 100°C). This suggests that at these low temperatures, ginsenoside Rb1 was degraded slowly, much more so than ginsenoside Rg3. However, at higher temperatures (≥160°C), k1 became higher than k2, and k1 increased more rapidly than k2 as the temperature increased due to higher activation energy. Therefore, at high temperatures, ginsenoside Rb1 was degraded (or ginsenoside Rg3 was formed) very quickly, much more so than the degradation of ginsenoside Rg3. The optimum concentration of ginsenoside Rg3 could thus be increased. Theoretically, the optimum ginsenoside Rg3 concentration should monotonously increase according to temperature due to its higher forming rate (k1) than its degrading rate (k2) caused by the higher activation energy of k1. After reaching the optimum concentration, ginsenoside Rg3 degradation would be faster than its formation because of the low ginsenoside Rb1 concentration, even though k1 would be higher than k2.
Fig. 8, Fig. 9 show the optimum concentration and reaction time of ginsenoside Rg3 at various temperatures. These were calculated based on (3), (4) and are summarized in Table 1. As the temperature increased, the optimum reaction time decreased rapidly, because k1 increased more rapidly than k2 due to higher activation energy. The optimum ginsenoside Rg3 concentration monotonously increased with temperature, as explained earlier. Although ginsenoside Rg3 can reach a high concentration at high temperatures, it also degrades rapidly. Therefore, precisely controlling the reaction time is very important to achieve maximum ginsenoside Rg3 concentration.
Fig. 8.

Simulated optimum concentration of ginsenoside Rg3 production at various temperatures.
Fig. 9.

Simulated optimum reaction time of ginsenoside Rg3 production at various temperatures.
The optimum temperature for ginsenoside Rg3 production should theoretically be the highest temperature technically feasible, but the optimum reaction time becomes extremely short after 180°C, as shown in Fig. 7, Fig. 9. Moreover, a cooling process is necessary to stop the reaction while maintaining a high concentration of ginsenoside Rg3. At high temperature, this process becomes impractical in scaled-up industrial processes due to the very short reaction time.
At 30 min of heat treatment, the estimated ginsenoside Rg3 concentration at higher temperature (364 ppm at 185°C) was lower than that at 180°C. We suggest that the suitable reaction time is approximately 30 min. When the temperature was >180°C, the concentration of ginsenoside Rg3 became much lower than that at 180°C at this optimum reaction time. Therefore, the suitable temperature for ginsenoside Rb1 heat treatment is 180°C. However, this temperature requires a high-pressure reactor vessel, and the higher reactor cost must be considered.
It is worth noting that the reaction model in this study is much too simple, and the results will not truly occur in actual red ginseng processing. Therefore, the optimization conditions for producing the optimum ginsenoside Rg3 concentration might not be applied correctly to an industrial manufacturing process. However, the kinetic model and simulation method will help researchers to better understand the kinetic mechanism of ginsenoside Rg3 during heat treatment. This study suggests a way to evaluate the kinetic parameters, including the rate constants and activation energies of various ginsenosides. It also provides a simulation method using evaluated kinetic parameters to optimize the time and temperature required for producing ginsenoside Rg3 or other ginsenosides from ginseng by heat treatment. Further research is required to precisely evaluate the kinetics of the heat conversion of ginsenosides with ginseng or ginseng extract.
4. Conclusion
By simulating the heat-degradation kinetics of ginsenosides Rb1 and Rg3, the profile of ginsenoside Rg3 can be estimated for any temperature and heating time. A kinetic study was conducted for this method, and an optimum strategy for ginsenoside Rg3 production by heat treating ginsenoside Rb1 was suggested from the simulation. The simulation was conducted using a simplified kinetic model with parameters estimated from ginsenoside Rb1 heat-treatment experiments at 80°C and 100°C. The rate constants of the ginsenosides Rb1 and Rg3 degradations at 80°C were 0.013 h−1 and 0.073 h−1, whereas those at 100°C were 0.045 h−1 and 0.155 h−1, respectively. The estimated activation energies of ginsenosides Rb1 and Rg3 degradations were 69.2 kJ/mol and 40.9 kJ/mol, respectively. The rate constants at different temperatures were evaluated using the estimated activation energies, and the kinetic profiles of ginsenosides Rb1 and Rg3 at each temperature were simulated based on a proposed kinetic model of consecutive reaction. Finally, the optimum strategies for ginsenoside Rg3 production by ginsenoside Rb1 heat treatment were suggested from the simulation results.
The optimum concentrations and reaction time for ginsenoside Rg3 were found at particular temperatures. As expected, the optimum ginsenoside Rg3 concentration monotonously increased with temperature due to its higher forming rate (k1) than degrading rate (k2). This was caused by the higher activation energy of k1 than k2. As the temperature increased, however, the optimum reaction time decreased rapidly due to the higher k1 than k2. Particularly, the optimum reaction time was too short (<30 min) at >180°C, and after the optimum reaction time, the ginsenoside Rg3 degraded very rapidly. At an industrial scale, the cooling process could not be precisely controlled at high temperatures when the optimum reaction time is too short. Thus, an optimum temperature of 180°C and optimum reaction time of 30 min are suggested.
Conflicts of interest
All contributing authors declare no conflicts of interest.
Acknowledgments
This work was supported by Business for Cooperative R&D between Industry, Academia, and Research Institutes, funded by the Korea Small and Medium Business Administration in 2014 (Grant No. C0219332). This study was also supported by a 2013 Research Grant from Kangwon National University (Grant No. 120131276).
Footnotes
This is an Open Access article distributed under the terms of the Creative Commons Attribution Non-Commercial License (http://creativecommons.org/licenses/by-nc-nd/4.0) which permits unrestricted non-commercial use, distribution, and reproduction in any medium, provided the original work is properly cited.
References
- 1.An Y.E., Ahn S.C., Yang D.C., Park S.J., Kim B.Y., Baik M.Y. Chemical conversion of ginsenosides in puffed red ginseng. LWT-Food Sci Technol. 2011;44:370–374. [Google Scholar]
- 2.Yue P.Y., Wong D.Y., Wu P.K., Leung P.Y., Mak N.K., Yeung H.W., Liu L., Cai Z., Jiang Z.H., Fan T.P. The angiosuppressive effects of 20(R)-ginsenoside Rg3. Biochem Pharmacol. 2006;72:437–445. doi: 10.1016/j.bcp.2006.04.034. [DOI] [PubMed] [Google Scholar]
- 3.Nam K.Y. The comparative understanding between red ginseng and white ginsengs, processed ginsengs (Panax ginseng C.A. Meyer) J Ginseng Res. 2005;29:1–18. [Google Scholar]
- 4.Wang C.Z., Aung H.H., Zhang B., Sun S., Li X.L., He H., Xie J.T., He T.C., Du W., Yuan C.S. Anticancer Res. 2008;28:2545–2552. [PMC free article] [PubMed] [Google Scholar]
- 5.Kim M.H., Hong H.D., Kim Y.C., Rhee Y.K., Kim K.T., Rho J.H. Ginsenoside changes in red ginseng manufactured by acid impregnation treatment. J Ginseng Res. 2010;34:93–97. [Google Scholar]
- 6.Lee S.M., Shon H.J., Choi C.S., Hung T.M., Min B.S., Bae K. Ginsenosides from heat processed ginseng. Chem Pharm Bull (Tokyo) 2009;57:92–94. doi: 10.1248/cpb.57.92. [DOI] [PubMed] [Google Scholar]
- 7.Wang C.Z., Aung H.H., Ni M., Wu J.A., Tong R., Wicks S., He T.C., Yuan C.S. Red American ginseng: ginsenoside constituents and antiproliferative activities of heat-processed Panax quinquefolius roots. Planta Med. 2007;73:669–674. doi: 10.1055/s-2007-981524. [DOI] [PMC free article] [PubMed] [Google Scholar]
- 8.Sun S., Wang C.Z., Tong R.B., Li X.L., Fishbein A., Wang Q., He T.C., Du W., Yuan C.S. Effects of steaming the root of Panax notoginseng on chemical composition and anticancer activities. Food Chem. 2010;118:307–314. [Google Scholar]
- 9.Lee Y.J., Kim H.Y., Kang K.S., Lee J.G., Yokozawa T., Park J.H. The chemical and hydroxyl radical scavenging activity changes of ginsenoside-Rb1 by heat processing. Bioorg Med Chem Lett. 2008;18:4515–4520. doi: 10.1016/j.bmcl.2008.07.056. [DOI] [PubMed] [Google Scholar]
- 10.Hwang I.G., Kim H.Y., Joung E.M., Woo K.S., Jeong J.H., Yu K.W., Lee J.S., Jeong H.S. Changes in ginsenosides and antioxidant activity of Korean ginseng (Panax ginseng C.A. Meyer) with heating temperature and pressure. Food Sci Biotechnol. 2010;19:941–949. [Google Scholar]
- 11.Ren G., Chen F. Degradation of ginsenosides in American ginseng (Panax quinquefolium) extracts during microwave and conventional heating. J Agric Food Chem. 1999;47:1501–1505. doi: 10.1021/jf980678m. [DOI] [PubMed] [Google Scholar]
- 12.Choi J.H., Kim D.H., Sung H.S., Kim W.J., Oh S.K. Kinetic studies on the thermal degradation of ginsenosides in ginseng extract. Korean J Food Sci Technol. 1982;14:197–202. [in Korean] [Google Scholar]
- 13.Corbit R.M., Ferreira J.F., Ebbs S.D., Murphy L.L. Simplified extraction of ginsenosides from American ginseng (Panax quinquefolius L.) for high-performance liquid chromatography–ultraviolet analysis. J Agric Food Chem. 2005;53:9867–9873. doi: 10.1021/jf051504p. [DOI] [PubMed] [Google Scholar]
- 14.Wan J.B., Lai CM,Li S.P., Lee M.Y., Kong L.Y., Wang Y.T. Simultaneous determination of nine saponins from Panax notoginseng using HPLC and pressurized liquid extraction. J Pharm Biomed Anal. 2006;41:274–279. doi: 10.1016/j.jpba.2005.10.023. [DOI] [PubMed] [Google Scholar]
- 15.Wang C.Z., Du G.J., Yuan C.S. Red American ginseng and breast cancer. In: Gunduz E., Gunduz M., editors. Breast cancer—current and alternative therapeutic modalities. InTech; Rijeka, Croatia: 2011. pp. 269–282. [Google Scholar]