

Abstract
Glycomacropeptide (GMP) is a 64-amino acid (AA) glycophosphopeptide with application to the nutritional management of phenylketonuria (PKU), obesity, and inflammatory bowel disease (IBD). GMP is a putative prebiotic based on extensive glycosylation with sialic acid, galactose, and galactosamine. Our objective was to determine the prebiotic properties of GMP by characterizing cecal and fecal microbiota populations, short-chain fatty acids (SCFA), and immune responses. Weanling PKU (Pahenu2) and wild-type (WT) C57Bl/6 mice were fed isoenergetic AA, GMP, or casein diets for 8 wk. The cecal content and feces were collected for microbial DNA extraction to perform 16S microbiota analysis by Ion Torrent PGM sequencing. SCFA were determined by gas chromatography, plasma cytokines via a Bio-Plex Pro assay, and splenocyte T cell populations by flow cytometry. Changes in cecal and fecal microbiota are primarily diet dependent. The GMP diet resulted in a reduction from 30–35 to 7% in Proteobacteria, genera Desulfovibrio, in both WT and PKU mice with genotype-dependent changes in Bacteroidetes or Firmicutes. Cecal concentrations of the SCFA acetate, propionate, and butyrate were increased with GMP. The percentage of stimulated spleen cells producing interferon-γ (IFN-γ) was significantly reduced in mice fed GMP compared with casein. In summary, plasma concentrations of IFN-γ, TNF-α, IL-1β, and IL-2 were reduced in mice fed GMP. GMP is a prebiotic based on reduction in Desulfovibrio, increased SCFA, and lower indexes of inflammation compared with casein and AA diets in mice. Functional foods made with GMP may be beneficial in the management of PKU, obesity, and IBD.
Keywords: sulfate reducing bacteria, inflammatory bowel disease, sialic acid, cytokines, phenylketonuria
glycomacropeptide (GMP) or caseinomacropeptide is a bioactive 64-amino acid glycophosphopeptide derived from κ-casein in bovine milk that is used in the formulation of novel functional foods. GMP is produced during the manufacture of cheese, when rennet (chymosin) cleaves the COOH-terminal of κ-casein between phe 105 and met 106, releasing GMP into the cheese whey and precipitating para-κ-casein to form cheese (Fig. 1A) (61). GMP is released in the adult human gastrointestinal (GI) tract by pepsin-mediated hydrolysis after milk ingestion (5). GMP comprises 20–25% of the proteins in whey protein isolate and whey protein concentrate that are produced from cheese whey. Use of GMP as a food ingredient requires isolation of GMP from cheese whey by commercial techniques primarily based on chromatography or ultrafiltration.
Fig. 1.

A: glycomacropeptide (GMP) or caseinomacropeptide is a bioactive peptide released from one of the casein milk proteins (κ-casein) during cheesemaking. Rennet (chymosin) cleaves κ-casein between phe 105 and met 106, releasing GMP, a glycosylated peptide, into the whey. GMP constitutes 20–25% of nitrogen in most whey products. GMP is a unique peptide lacking aromatic acids and thus has been isolated from whey for use in medical foods needed for the management of phenylketonuria. It is an acidic, highly polar peptide (isoelectric point below 4.0) that is hydrophilic and heat stable, with a theoretical molecular mass between 7 and 11 kDa. B: bovine GMP represents a heterogenous group of 64 amino acid peptides due to genetic variance (variants A and B) and posttranslational modification, including phosphorylation at serine residues and glycosylation at threonine residues via OH linkages. The primary structure of bovine variant A is shown; the 2 sites corresponding to mutational differences in the B variant are indicated. Glycosylated forms of GMP include 5 different mucin-type carbohydrate chains containing N-acetylneuraminic acid (sialic acid), N-acetylgalactosamine, or galactose. Approximately 75% of glycosylated GMP molecules include trisaccharide and tetrasaccharide chains as shown.
GMP encompasses a heterogeneous group of peptides due to genetic variance and posttranslational modifications including phosphorylation and glycosylation. The amino acid (AA) profile of GMP is unique. Pure GMP contains no aromatic AA (phe, tyr, and trp), as well as no his, cys, and arg, and concentrations of iso and thr that are two- to threefold greater, respectively, than those found in typical dietary proteins (14). GMP is an acidic, highly polar peptide (isoelectric point below 4) that is hydrophilic and heat stable, with good functional properties for food formulation (30). The theoretical mass of GMP is between 7 and 11 kDa. The primary structures of bovine GMP variants A and B, the two major genetic variants of GMP, are shown in Fig. 1B. GMP contains three primary phosphorylation sites located on ser residues. Glycosylation of GMP at thr residues via OH linkages occurs with five different mucin-type carbohydrate chains containing N-acetylneuraminic acid (sialic acid) (64), galactose, or N-acetylgalactosamine (61). Approximately 75% of glycosylated GMP molecules include trisaccharide and tetrasaccharide chains as shown in Fig. 1B. GMP is a putative prebiotic based on this high degree of glycosylation.
GMP demonstrates a number of biological activities relevant to GI physiology and metabolic disease due to its unique composition as summarized in reviews (3, 10, 61). GMP has been shown to bind and inactivate toxins of Escherichia coli and Vibrio cholerae (28) and inhibit the adhesion of cariogenic bacteria (1). This protection from pathogens has been linked with glycosylation of GMP, especially sialic acid (39), since many pathogens and enterotoxins adhere to cells by recognizing carbohydrate receptors. GMP enhances zinc absorption in rhesus monkeys linked with its negative charge (29). Conflicting studies suggests that GMP promotes satiety in humans (42, 63) with limited evidence that stimulation of cholecystokinin by GMP may mediate reduced food intake (2). GMP exerts immunomodulating activities as reflected in increased cytokine production in human monocytes (45) and decreased stimulation of T helper 1 lymphocytes in rat splenocytes (47). GMP administered by oral gavage shows significant anti-inflammatory effects in rat models of colitis and ileitis, resulting in normalization of spleen mass and reduced expression of IL-Iβ in ileum and colon (8, 31, 38, 46), as we have observed in PKU mice (57). GMP may provide a beneficial source of protein in functional foods for the management of inflammatory bowel disease (IBD).
GMP provides a physiological source of low-phe protein for humans with the genetic condition phenylketonuria (PKU), in part because it is the only known dietary protein that contains a mere trace of phe and can be made into a variety of palatable medical foods for the essential management of PKU (35, 62). A medical food, as defined by the US Food and Drug Administration, is a “food which is formulated to be consumed or administered enterally under the supervision of a physician and which is intended for the specific dietary management of a disease or condition for which distinctive nutritional requirements, based on recognized scientific principles, are established by medical evaluation” (18). Our murine studies, which characterize the nutritional and neurochemical properties of GMP, confirm the nutritional adequacy of GMP supplemented with limiting AA and illustrate anti-inflammatory effects, reduced body fat mass, and positive effects on bone size and strength with chronic ingestion of this peptide (54, 57, 58). A unifying feature and potential mechanism for the reported beneficial activities of GMP is its putative role as a prebiotic that promotes a beneficial gut microbiota and modulates immune function.
There is no definitive evidence of the prebiotic effects of dietary GMP on the intestinal microbiome and associated immune responses (6, 10). The extensive glycosylation and sialic acid content of GMP suggests it is a potent prebiotic with application to functional foods for the management of PKU, obesity, IBD, and bone health. Our objective was to determine the prebiotic properties of GMP by characterizing cecal and fecal microbiota populations and cecal concentrations of short-chain fatty acids (SCFA) from PKU and wild-type (WT) mice fed diets containing GMP as the primary protein source. Plasma cytokines and splenocyte T cell populations were assessed to characterize the anti-inflammatory effects of GMP associated with alterations in the microbiota. Our findings indicate that GMP is a prebiotic based on modulation of the GI microbiota in association with increased cecal concentrations of SCFA and beneficial immune effects.
METHODS
Animals and Experimental Design
The University of Wisconsin-Madison Institutional Animal Care and Committee approved the facilities and protocols used in this study. Experimental animals were produced from a breeding colony of PKU mice by breeding C57BL/6J mice heterozygous for the Pahenu2 mutation to yield homozygous PKU mice and WT control mice (25, 32). Experimental mice were genotyped for the presence of the Pahenu2 mutation (57). A series of three experiments was performed. Experiment 1 utilized a 2 × 2 × 3 factorial design to examine the effects of genotype (PKU and WT), sex (male and female), and diet (high-phe casein, low-phe AA, and low-phe GMP) as well as their interactions on growth, spleen mass, and mass of jejunum and colon. Experimental animals were fed from weaning (3 wk of age) through young adulthood, 20 to 22 wk of age. Experiment 2 was used to investigate the prebiotic properties of GMP by examining gut microbiota populations, SCFA concentrations, and plasma cytokine concentrations in WT mice fed either the casein or GMP diet and PKU mice fed either the AA or GMP diet (n = 6–8). Mice were fed the experimental diet from weaning through 8–9 wk of age. Experiment 3 further investigated the anti-inflammatory properties of GMP by flow cytometry to characterize spleen and blood cells in both WT and PKU mice fed either the casein or GMP diets. These mice were fed the experimental diets from weaning through 20–22 wk of age.
At weaning, mice were randomized to one of the three diets, separated by sex, and housed with littermates in shoebox cages. The facility was maintained at 22°C on a 12-12-h light-dark cycle with mice being fed ad libitum and having free access to water. All the diets were isoenergetic and formulated based on the AIN-93G diet composition (44) with the protein source being the only source of variation across diets (Harlan Teklad, Madison, WI; TD.09667–TD.09669, TD.120645) (57). The protein in the casein diet was provided by 20% (wt/wt) casein plus 0.3% l-cystine; the AA diet included 17.5% free AAs, which provided higher luminal osmolality (51); and the GMP diet had 20% GMP (LACPORDEN CGMP-10, Arla Foods Ingredients, Viby J, Denmark) plus 1.5 times the NRC requirement for five limiting AA to provide a complete protein source. The CGMP from Arla Foods Ingredients contains 6–7% sialic acid. The AA profile of the diets was previously reported (57). The content of the sulfur AA, methionine, and cysteine is similar across the three diets (8–9 g/kg diet). However, 3–3.5 g/kg of cystine was added to the casein and AA diets whereas no cystine, only met, was added to the GMP diet.
For experiment 1, the small intestine and colon were dissected and weighed, and then the jejunum was separated from the rest of the small intestine. A 4-cm segment was removed 6 cm from the proximal end of the jejunum and weighed. Mucosa was scraped from this segment, dried, and then weighed. At the end of experiment 2, mice were placed into individual metabolic chambers (Tecniplast, West Chester, PA) for 3 days and feces were collected every 24 h. Blood was collected by cardiac puncture into syringes containing a final concentration of 2.7 mmol/l EDTA, and plasma was isolated by centrifugation at 4°C. The cecum was dissected and cecal contents collected into microfuge tubes and frozen at −70°C. Spleens were dissected, weighed, and used immediately for flow cytometric analysis.
Gut Microbiota Analysis
DNA extraction.
The cecum digesta was homogenized in 1.5 ml PBS and total DNA from 200 μl of the homogenate was isolated using the QIAamp DNA Stool Mini Kit (Qiagen Sciences) with modifications to the manufacturer's instructions. These modifications included an initial mechanical cell disruption step by inclusions of 0.1-mm glass beads (Sigma-Aldrich) followed by exposure to six 1-min beatings at maximum speed in a Mini-beadbeater-96 (Biospec Products, Bartlesville, OK) with intervals of 2 min on ice. Subsequently, a heat treatment step was performed for 5 min at 95°C. The DNA was further purified by phenol-chloroform-isoamyl alcohol (25:24:1, pH 8) extraction, phase separation using Phase Lock Gels (5 PRIME) and ethanol precipitation using pellet paint coprecipitant (EMD Millipore). DNA was quantified by Qubit 2.0 Fluorometer (Invitrogen).
Ion torrent PGM sequencing and microbiota analysis.
Partial 16S rRNA sequences were determined on a 318 v2 chip using the IonTorrent Personal Genome Machine System at University of Wisconsin-Madison, Biotechnology Center. Briefly, the V1–V2 region was amplified by using forward primers that contained a sample-specific bar code with an Ion A adapter and a key sequence, while the associated reverse primer contained a truncated P1 (trP1) adapter. The sequence of these primers was as follows: forward (8FM-5′-CCA TCT CAT CCC TGC GTG TCT CCg ACT CAG BBB BBB BBB BBB BAG AGT TTG ATC MTG GCT CAG-3′) with the Ion A adapter in italics, the key sequence in italics and underlined, the 13-bp bar code designated as Bs, and the 16S primer sequence in capital letters; reverse (357R-5′-CCT CTC TAT GGG CAG TCG GTG ATC TGC TGC CTY CCG TA-3′) with the trP1 adapter in italics and the 16S primer sequence in capital letters. All PCR reactions were quality controlled for amplicon saturation by gel electrophoresis. The amplicons from all reactions were pooled in equal amounts and purified by use of AxyPrep Mag PCR beads (Corning). The resulting products were quantified with PicoGreen (Invitrogen) and Qubit fluorometer (Invitrogen) before sequencing. The data processing pipeline removed low-quality reads that 1) did not completely match the PCR primer and barcode; 2) were shorter than 300 bp or longer than 400 bp in length; or 3) had an average quality score <22. Data analysis was performed primarily in QIIME 1.8 framework (4). Operational Taxonomic Units (OTUs) were chosen with QIIME picking OTU workflow based upon sequence similarity. Taxonomic identities were assigned using greengenes version 13_5 (11).
Cecal Short-chain Fatty Acids Analysis
Cecal contents (1 ml) were added to a microfuge tube containing 20 μl of 50% H2SO4. Sample was centrifuged for 3 min and 600 μl of supernatant transferred to a new microfuge tube, and 120 μl of 25% metaphosphoric acid was added and allowed to stand for 30 min. Samples were centrifuged and supernatant transferred to a gas chromatograph (GC) vial. Concentrations of individual SCFA were measured on a Perkin Elmer Autosystem GC by using a 4% Carbowax 20 M on 80/120 mesh Carbopack B-DA, 1.8 m × 2 mm column (Supelco). Nitrogen was used as a carrier gas, and the injector temperature was 170°C and the detector temperature were 175°C. The column temperature was maintained at 115°C for 45 min. Nitrogen flow was maintained at 25 ml/min. Identification of SCFA peaks was based on a purchased external standard from Sigma Chemical (St. Louis, MO) (19, 60).
Plasma Cytokines
Cytokine assays were performed by using a Bio-Plex Mouse Cytokine 23-Plex Panel (1 × 96-well) (Bio-Rad) according to the manufacturer's instructions. Plasma samples were diluted 1:4 with mouse sample diluent. The desired number of wells were prewet with 100 μl of Bio-Plex assay buffer. The multiplex bead working solution was vortexed for 15–20 s and 50 μl were pipetted into each well. The buffer was then immediately removed by using Bio-Plex Pro Magnetic Wash Station. Wells were washed twice by adding 100 μl of wash buffer. Fifty microliters of diluted standard or prepared sample were added to each well and the plate was incubated for 30 min. Thereafter, the plate was washed three times with 100 μl of Bio-Plex wash buffer. Twenty-five microliters of vortexed Bio-Plex Detection Antibody working solution were added to each well, incubated for 30 min, and then washed three times with Bio-Plex wash buffer. Fifty microliters of vortexed 1× streptavidin-PE was added to each well, incubated for 30 min, and then washed three times with Bio-Plex wash buffer. Beads were resuspended with 125 μl assay buffer, incubated for 30 s, and then immediately read on the Bio-Plex 200 System. Cytokine concentrations were calculated from the standard curve by use of Bio-Plex manager software. Samples were run in duplicate.
Flow Cytometry
Spleens were dissociated by mechanical disruption and digested with collagenase/dispase (20 μg/ml, Roche, Indianapolis, IN) and DNase I (300 μg/ml, Roche) for 30 min at 37°C and passed through a 70-μm cell strainer (BD Biosciences, San Jose, CA). Heparinized blood was collected via cardiac puncture and red blood cells were removed by dextran sedimentation. Remaining red blood cells were lysed with ammonium chloride. Cells were stained at 4°C in PBS with Live/Dead Violet Fixable Stain kit (Invitrogen, Carlsbad, CA), washed, then stained in PBS with 0.5 mM EDTA, 0.2% BSA, 0.09% azide, and 2% normal rat serum (Jackson ImmunoResearch, West Grove, PA). Anti-mouse CD3-eFluor450 (eBioscience, San Diego, CA), CD4-Alexa Fluor 700, CD8-APC-eFluor780 (eBioscience, San Diego, CA), CD44-PE, CD62L-PE-Cy7, IFNγ-PerCPCy5.5 (eBioscience, San Diego, CA), Granzyme B-FITC (eBioscience, San Diego, CA), and Perforin-APC antibodies were purchased from BD Biosciences except as indicated. Isolated spleen cells were also stimulated with PMA and ionomycin. Anti-Rat/Hamster CompBeads (BD Biosciences) were used to set compensation. Data were collected on an LSRII cytometer (BD Biosciences) and analyzed with FlowJo 7.6.1 (TreeStar, Ashland, OR).
Statistical Analysis
Data were analyzed by three-way ANOVA using generalized linear model to identify the main treatment effects of genotype, sex, diet, as well as their two- and three-way interactions. Differences between the treatment groups were detected by using a protected Fisher's least significant difference test (SAS Institute, 2007, Cary, NC). Data transformations were performed where appropriate to fit assumptions of normality and equal variance prior to statistical analysis. Data are presented as means ± SE. P values < 0.05 are considered significant. Where there was no significant interaction, data were pooled into treatment groups by their respective main effects. Data for SCFA concentration and plasma cytokine concentration were analyzed by one-way ANOVA. For gut microbiota analysis, data are presented as means ± SE. The statistical difference between treatments was tested by Monte Carlo in package ade4 (13) of R 2.14.0 (43) as described by de Carcer et al. (9). The dominant genera that were promoted or inhibited were determined by correspondence analysis in package ade4 of R 2.14.0 as described by de Carcer et al. An unweighted UniFrac analysis on tables of OTU counts was performed with beta_diversity_through_plots.py script of QIIME. The resulting distances were summarized in the principal coordinate analysis (PCoA) biplot.
RESULTS
Experiment 1: Body and Organ Mass
Body weight and spleen mass.
The casein control diet provided higher phe content than the AA and GMP diets. Thus it was not surprising that WT mice fed the casein diet showed significantly greater final body weight compared with WT or PKU mice fed the AA or GMP diets (WT casein 29 ± 1 vs. WT AA 23 ± 1, WT GMP 23 ± 1, PKU casein 23 ± 1, PKU AA 23 ± 1, PKU GMP 22 ± 1 g final body mass). Food intake was not significantly different in WT mice fed the casein, AA, and GMP diets. PKU mice fed the GMP diet showed similar food intake to WT mice but lower food intake compared with PKU mice fed the casein or AA diets, consistent with greater metabolic efficiency due to ingestion of GMP (57). Spleen mass expressed relative to body weight showed significant treatment effects for both genotype and diet without interaction. PKU mice had significantly larger spleens compared with WT mice (Fig. 2A). Regardless of genotype, mice fed the GMP diet had significantly smaller spleens compared with mice fed either the casein or AA diet (Fig. 2B).
Fig. 2.
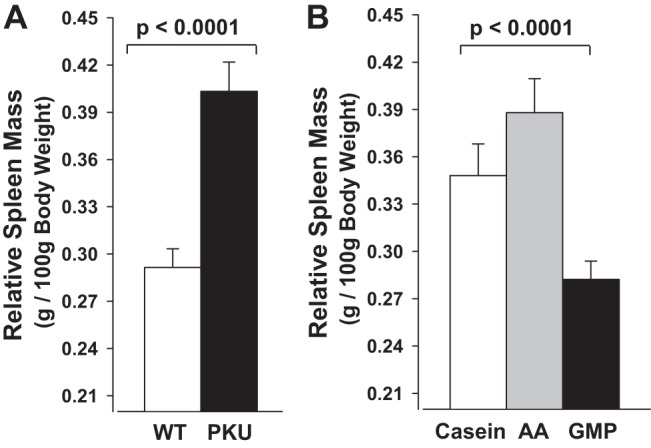
Relative spleen mass in wild-type (WT) and phenylketonuria (PKU) mice fed casein, amino acid (AA), or GMP diets from weaning through 20–22 wk of age. Values shown are means + SE (n = 45–70) for significant main effects of genotype (A) and diet (B); there was no significant interaction of genotype and diet. Relative spleen mass was significantly greater in PKU compared with WT mice and lower with ingestion of the GMP diet compared with the casein and AA diets.
Gut mass.
The mass of the jejunum showed significant treatment effects for both genotype and diet without interaction. PKU mice demonstrated significantly greater intact jejunum wet mass and jejunum mucosa dry mass compared with WT mice that was independent of diet (Fig. 3, A and C). Regardless of genotype, PKU and WT mice fed the GMP diet showed significantly lower intact jejunum wet mass and jejunum mucosa dry mass compared with mice fed the casein or AA diets (Fig. 3, B and D). Consistent with greater intestinal absorptive area, we previously reported significantly greater energy expenditure and food intake in PKU mice compared with WT mice (57). However, the increases relative to WT mice were of the greatest magnitude in PKU mice fed the casein and AA diets compared with the GMP diet, e.g., a 13–15% increase in oxygen consumption over 48 h with the casein and AA diets compared with a 3% increase with GMP diet. These data suggest that because PKU mice expend more energy and need to eat more diet to grow at a rate similar to WT mice, their small intestine adapts to a larger mass to facilitate nutrient absorption, and the response is attenuated in mice fed the more physiological GMP diet (57).
Fig. 3.
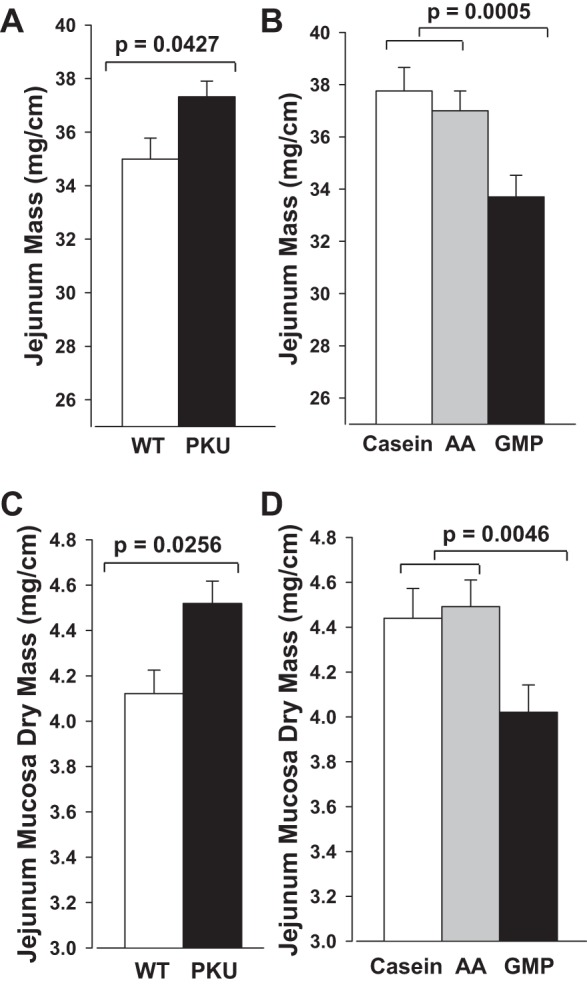
Intact jejunal wet mass (A and B) and jejunal mucosa dry mass (C and D) in WT and PKU mice fed casein, AA, or GMP diets from weaning through 20–22 wk of age. Values shown are means + SE (n = 45–70) for significant main effects of genotype and diet; there was no significant interaction of genotype and diet. Jejunal mass was significantly greater in PKU compared with WT mice and significantly lower with ingestion of the GMP diet compared with the casein and AA diets.
Mice fed the GMP diet showed a significantly lower colon mass compared with mice fed the casein and AA diets (24.5 ± 0.6 casein; 25.3 ± 0.8 AA, 22.5 ± 0.5 GMP, mg/cm intact wet colon; P = 0.006, GMP vs. casein and AA diets, n = 45). The implication of the lower colon wet mass in mice fed the GMP diet is unclear. Interestingly, mean fecal mass was increased by 11–33% with consumption of the GMP diet compared with the casein and AA diets, respectively (GMP = 0.43 ± 0.02, casein = 0.37 ± 0.02, and AA = 0.33 ± 0.03 g feces/day; P < 0.05 for GMP vs. AA; n = 12). The greater fecal mass induced by ingestion of GMP, despite similar food intake compared with casein in both experiment 1 and experiment 2, is consistent with the putative prebiotic effects of GMP as investigated in experiment 2.
Experiment 2: Gut Microbiota, Short-Chain Fatty Acids, and Plasma Cytokines
Microbiota populations at the phyla level.
Intestinal microbiota populations were characterized in both the cecum and feces and are presented as percent of the population. A total of 1,792,910 filtered reads were obtained from the 54 samples; the number of reads varied from 16,268 to 61,124 with an average of 33,202 reads per sample. In cecal contents from both WT and PKU mice fed the GMP diet there was a significant reduction from 30–35 to 8–10% in the Proteobacteria phylum compared with WT mice fed the casein diet and PKU mice fed the AA diet, P = 0.002 and P = 0.001, respectively (Fig. 4A). PKU mice fed the GMP diet had a significant increase in Bacteroidetes from 23.3 to 55.8% compared with mice fed the AA diet. In contrast to PKU mice, WT mice fed the GMP diet had a significant increase in Firmicutes from 29.6 to 56.7% compared with WT mice fed the casein diet. In the feces Bacteroidetes was the primary phylum. PKU mice fed the GMP diet had a significant increase in Bacteroidetes from 74.4 to 86.7% compared with PKU mice fed the AA diet (Fig. 4B).
Fig. 4.

WT and PKU mice fed the GMP diet have altered bacterial populations from WT mice fed the casein (Cas) diet and PKU mice fed the AA diet from weaning through 8–9 wk of age. Relative bacterial phyla abundance was calculated compared with total bacteria in both the cecum (A) and feces (B). In cecal contents from both WT and PKU mice fed the GMP diet there was a significant reduction in the Proteobacteria phylum compared with WT mice fed the casein diet and PKU mice fed the AA diet, P = 0.002 and P = 0.001, respectively. In the feces, PKU mice fed the GMP diet had a significant increase in Bacteroidetes relative to PKU mice fed the AA diet, P = 0.047.
Microbiota populations at the genera level.
Pairwise comparisons of the treatment groups demonstrate that WT mice fed the casein diet have a significantly different gut microbiome population than WT mice fed the GMP diet in both the cecum and feces. PKU mice fed the AA diet have a significantly different gut microbiome population than PKU mice fed the GMP diet in both the cecum and feces. In the cecal contents of WT mice fed the GMP diet there was a significant reduction of the Desulfovibrio genera compared with WT mice fed the casein diet, from 29.5 to 7.3%, P = 0.001 (Fig. 5A). Similar to WT mice, PKU mice fed the GMP diet had a significant reduction in Desulfovibrio from 34.6 to 6.9%, compared with PKU mice fed the AA diet, P = 0.001. WT mice fed the GMP diet saw a significant increase in Allobacullum, 4.7 to 28.2%, compared with WT mice fed the casein diet, P = 0.012. PKU mice fed the GMP diet had a significant increase in Bacteroidales; f__S24-7;g__ compared with PKU mice fed the AA diet, from 17.7 to 52.0%, P = 0.001. In the feces, Desulfovibrio is reduced in both WT and PKU mice fed GMP compared with WT mice fed the casein diet and PKU mice fed the AA diet, P = 0.017 and P = 0.021, respectively (Fig. 5B).
Fig. 5.

Relative bacterial genera abundance was calculated compared with total bacteria in both the cecum (A) and feces (B) in WT and PKU mice fed either the casein, AA, or GMP diets from weaning through 8–9 wk of age. In the cecal contents of WT mice fed the GMP diet there was a significant reduction in Desulfovibrio compared with WT mice fed the casein diet, P = 0.001. PKU mice fed the GMP diet had a significant reduction in Desulfovibrio compared with PKU mice fed the AA diet, P = 0.001.
The first two dimensions of PCoA plot (Fig. 6) depict unweighted UniFrac distances between microbial communities. Each point represents the microbial community of the cecum sample from one mouse and illustrates a diet effect by the clustering of the communities.
Fig. 6.
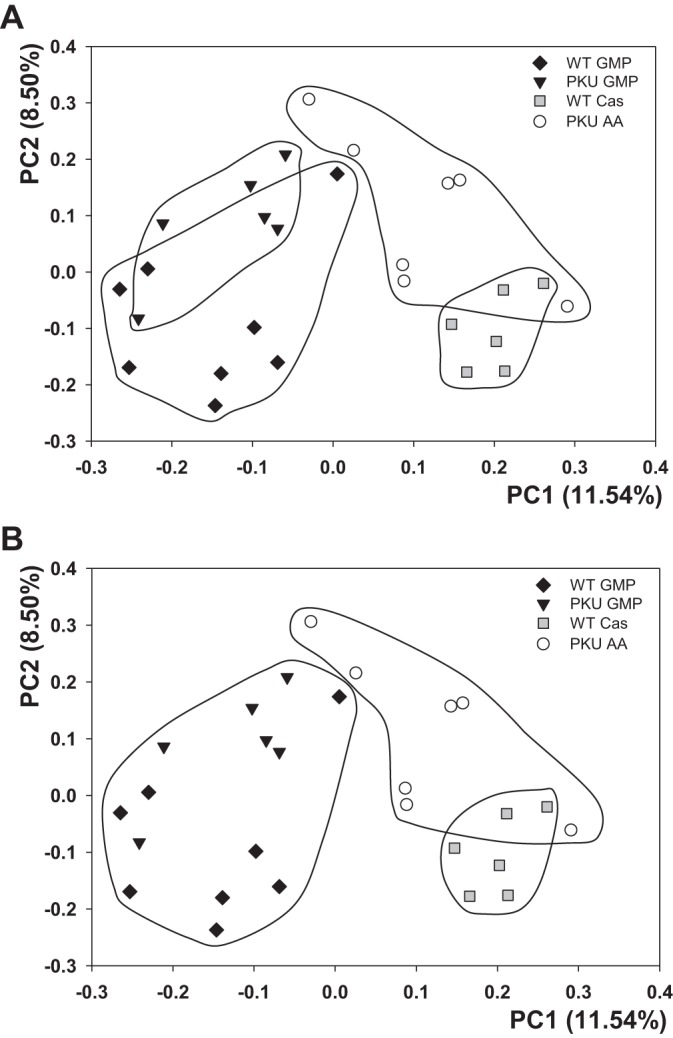
Cecal bacterial communities clustered using principal coordinate analysis of the unweighted UniFrac distance. Each point corresponds to a cecal sample from an individual mouse colored according to genotype and diet. Principal coordinates 1 and 2 (PC1 and PC2) are plotted on x-and y-axes with percentage of variation explained in the parentheses. All 4 groups are circled to look at group effects of diet (A) and GMP diet separated from the casein and AA diets (B).
Short-chain fatty acid concentrations.
Consistent with fermentation of the carbohydrate residues in GMP, both WT and PKU mice fed the GMP diet demonstrated greater cecal concentrations of acetate, propionate, and butyrate compared with mice fed the casein and AA diets (Fig. 7). WT mice fed the GMP diet showed significantly greater cecal concentrations of acetate and propionate and greater butyrate concentrations (P = 0.027, P = 0.022, and P = 0.062, respectively) compared with WT mice fed the casein diet. PKU mice fed the GMP diet showed significantly greater cecal concentrations of butyrate (P = 0.04) and greater cecal concentrations of acetate and propionate (P = 0.058–0.086) compared with PKU mice fed the AA diet. The sum of acetate, butyrate, and propionate concentrations in cecum was highest in the PKU GMP group (9.2 ± 2.5 PKU GMP, 5.6 ± 0.79 WT GMP, 4.4 ± 0.81 PKU AA, and 2.8 ± 0.64 WT casein, mmol; P < 0.075 for PKU GMP vs. PKU AA and P < 0.029 for WT GMP vs. WT casein). Isobutyrate, 2-methylbutyrate, isovalerate, and valerate concentrations were not different between the groups (data not shown).
Fig. 7.
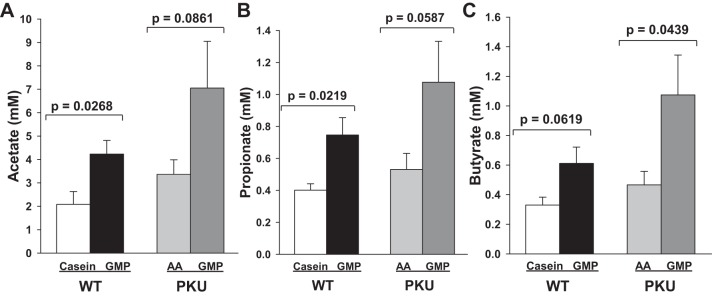
Cecal concentrations of the short-chain fatty acids (SCFA) acetate (A), propionate (B), and butyrate (C) in WT mice fed casein and GMP diets and in PKU mice fed AA and GMP diets from weaning through 8–9 wk of age. Values are means + SE, n = 6–8.
Plasma cytokine concentrations.
Inflammatory cytokine concentrations were measured in plasma of WT mice fed the casein or GMP diets and PKU mice fed the AA or GMP diets. Plasma concentrations of IFN-γ and TNF-α were significantly reduced in WT mice fed the GMP diet compared with WT mice fed the casein diet, P = 0.01 (Fig. 8, A and B). Similarly, WT mice fed the GMP diet had significantly lower plasma concentrations of IL-1α, IL-1β, IL-2, and IL-10 compared with WT mice fed the casein diet (Fig. 8, C–F). Although there were trends for lower plasma concentrations in IFN-γ and IL-2 in PKU mice fed the GMP diet compared with the AA diet, this did not reach significance.
Fig. 8.

Plasma cytokine concentrations for interferon-γ (IFN-γ, A), tumor necrosis factor-α (TNF-α, B), interleukin-1α (IL-1α, C), interleukin-1β (IL-1β, D), interleukin-2 (IL-2, E), and interleukin-10 (IL-10, F) in PKU mice fed AA and GMP diets and in WT mice fed casein and GMP diets from weaning through 8–9 wk of age. Values are means + SE, n = 6–8.
Experiment 3: Flow Cytometry
Flow cytometric analysis of splenocytes and blood cells.
To investigate the potential anti-inflammatory properties of GMP, splenic T cells were characterized by flow cytometry. Splenocytes were stimulated with PMA and ionomycin, and both WT and PKU mice fed the casein diet had significantly elevated CD8+ CD44hiCD62Llo effector cytotoxic T cells compared with mice fed the GMP diet, P < 0.0001 (Fig. 9A). Stimulated splenocytes from mice fed the casein diet also had significantly greater production of CD8+ IFN-γ compared with mice fed the GMP diet, P = 0.0043 (Fig. 9B). Splenocytes were also analyzed for expression of CD4+ IFN-γ, but there were no significant differences between groups (data not shown).
Fig. 9.
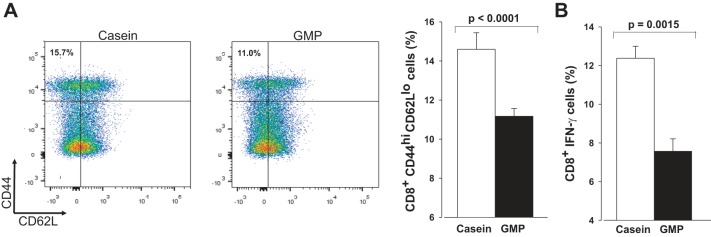
Spleen cells were stimulated with PMA and ionomycin and were collected from both WT and PKU mice fed either the casein or GMP diet from weaning through 20–22 wk of age. A: cells were gated on CD8 and plots are representative of mice fed either the casein or GMP diets. Histogram shows means ± SE percentage of CD8+ CD44hiCD62Llo cells, n = 8–18. B: percentage of CD8+ cells producing IFN-γ detected by intracellular cytokine staining.
Flow cytometry was used to analyze anti-inflammatory effects of GMP in the blood. The results seen in the spleen were replicated as production of CD8+ IFN-γ was significantly greater in mice fed the casein diet compared with mice fed the GMP diet, P < 0.0001. Similar to spleen, there were no significant differences in production of CD4+ IFN-γ between the groups (data not shown).
DISCUSSION
There is considerable evidence that dietary prebiotics modulate the GI microbiota with therapeutic applications to conditions including IBD, obesity, and bone health (22, 48, 49). The International Scientific Association for Probiotics and Prebiotics defines a dietary prebiotic as “a selectively fermented ingredient that results in specific changes, in the composition and/or activity of the GI microbiota, thus conferring benefit(s) upon host health” (49). Most prebiotics are poorly digested carbohydrates. The dairy protein GMP is considered a putative prebiotic based on its high degree of glycosylation that includes mucin-like oligosaccharide chains that contain sialic acid, galactose, and galactosamine (61). However, there is no definitive evidence that GMP is a prebiotic (10). We demonstrate for the first time that chronic ingestion of GMP in both WT and PKU mice acts as a prebiotic based on specific modulation of the GI microbiota (reduced Desulfovibrio) that is beneficial based on increased cecal concentrations of SCFA and lower indexes of inflammation.
Irrespective of genotype and compared with isoenergetic diets containing either casein or AAs as the primary protein source, GMP induced greater fecal output with similar food intake and a dramatic reduction (from 30–35 to 7%) in the Proteobacteria phylum, Desulfovibrio genus, in cecum. Parallel changes were noted in feces. This was offset by genotype-dependent increases in the Bacteroidetes or Firmicutes phyla. The Desulfovibrio genus includes sulfate metabolizing bacteria that reduce sulfites and sulfates obtained from the diet and sulfated mucopolysaccharides found in mucin leading to the generation of hydrogen sulfide, a cytotoxic compound (21). Compelling data in human subjects demonstrate that humans with ulcerative colitis have an increase in prevalence of Desulfovibrio (53). Of note, 5-aminosalicylic acid inhibits sulfate reduction and reduces fecal hydrogen sulfide levels, suggesting that its efficacy in treating colitis may reside in its ability to reduce the prevalence of sulfate reducing bacteria, e.g., act like an antibiotic (40). Moreover, dextran sulfate sodium is an established experimental rodent model of chronic colitis based on the fermentation of sulfated substrates by metronidazole-sensitive fecal bacteria to yield toxic hydrogen sulfide products that induce colonic inflammation and ulceration (37). Lastly, studies with three models of IBD (dextran sulfate, trinitrobenzenesulfonic acid, and lymphocyte transfer) (8, 31, 38, 46) all demonstrate that gavage of a small amount of GMP (15 mg/day in combination with a stock diet vs. over 200 mg dietary GMP/day ingested in a semipurified diet as used in the present study) reduces disease severity and shows anti-inflammatory effects. This is the first study to establish an association between ingestion of GMP and alterations in the GI microbiota associated with the pathogenesis of IBD. Taken together, these data suggest that GMP may exert its anti-inflammatory effects in preclinical models of IBD, in part, by reducing the prevalence of sulfate reducing bacteria, e.g., Desulfovibrio.
The mechanisms underlying GMP's ability to specifically reduce Desulfovibrio in the cecum and feces likely reflect the dual contributions of dietary sulfur (17) and endogenous sulfur from intestinal mucins (21). The total sulfur content of the GMP, casein, and AA diets provided by met and cysteine or cystine (reduced dimer of cysteine) is similar, 8–9 g/kg diet, and exceeds the minimum requirement (5 g/kg diet) (34). The GMP diet is supplemented with met whereas the casein and AA diets are supplemented with cystine (3–3.5 g cystine/kg diet) to provide for nutritional adequacy (44). Supplemental cystine included in the casein and AA diets, and often used in human nutritional products, may provide a substrate that directly promotes the growth of Desulfovibrio. However, the similar total sulfur content of the three diets suggests indirect effects of GMP to reduce the prevalence of Desulfovibrio, possibly by altering mucin synthesis. Sulfate-reducing bacteria metabolize sulfated mucopolysaccharides found in mucin (21) and mucin composition is altered by the source of dietary protein, although the effects of GMP on mucin composition have not been reported (7, 15, 16, 59). Indeed, high intake of sulfur compounds from high protein foods rich in methionine and cysteine is associated with relapse in patients with ulcerative colitis (27). Additional studies will be required to understand the complex interactions between dietary intake of GMP and cystine, the composition of intestinal mucins and bile acids (12), and sulfate-reducing bacteria.
The ability of GMP to increase cecal levels of the SCFA, acetate, butyrate, and propionate suggests improved intestinal barrier function (20) and the potential for reduced systemic inflammation (23). Moreover, Desulfovibrio metabolize SCFA, which may account for reduced SCFA in mice fed casein or AA diets who show elevated levels of Desulfovibrio compared with GMP (33, 41, 50). Carbohydrate availability and a lower intestinal pH induced by increased levels of SCFA reduces the ability of intestinal microbiota to metabolize the aromatic AAs phe, tyrosine, and tryptophan to phenolic and indolic compounds, which have been associated with a variety of disease states in humans and animals (56). This may be relevant to emerging chronic complications of PKU treated with an AA diet including chronic kidney disease (26) and osteopenia (24). In contrast, the prebiotic effects of GMP associated with increased cecal SCFA levels reflect a healthy microbiota and intestinal anti-inflammatory properties.
Although the relationship between elevated levels of Desulfovibrio and IBD may be coincidental (53), Desulfovibrio clearly flourish in an inflammatory environment (21). The intestinal anti-inflammatory activity of GMP has been reported in rodent models of IBD in which the GMP is administered by gavage pre- or postinduction of IBD, rather than being ingested in a diet as studied herein. These acute studies associate GMP's ability to reduce the severity of IBD with its ability to boost innate immunity but block T cell-driven adaptive immunity (31, 38). Consistent with these studies, both WT and PKU mice fed the GMP diet had reduced levels of cytotoxic T cells, marked by CD44hiCD62Llo antibodies compared with WT and PKU mice fed the casein diet. After stimulation with PMA and ionomycin the CD8+ cytotoxic T cells produced less IFN-γ, part of the adaptive immune response (55) in mice fed the GMP diet relative to mice fed the casein diet. This finding is supportive of the conclusion drawn by Ortega-González et al. (38) that GMP's mechanism to reduce severity of IBD is by blocking T cell-driven adaptive immunity. Reduction of plasma concentrations of TH1-associated cytokines, IFN-γ and IL-2 (52), in mice fed the GMP diet is consistent with the data produced by López-Posadas et al. (31), suggesting that GMP may act through these mechanisms. Concentrations of plasma IL-1β were also reduced in mice fed the GMP diet, similar to the suggested mechanism by Daddaoua et al. (8) as to how GMP functions to reduce symptoms of hapten-induced colitis in rats. Since our cytokine concentrations are in plasma and consistent with the results seen in specific tissues, this suggests that ingestion of GMP has systemic anti-inflammatory effects. Reduced plasma cytokine levels may be relevant to the positive effects of GMP on bone strength (36, 58). In summary, chronic ingestion of GMP, like gavage of GMP in murine models of IBD, shows systemic and intestinal anti-inflammatory effects.
In conclusion, we demonstrate for the first time that GMP meets the criteria for a prebiotic, e.g., a specific change in the GI microbiota with beneficial effects on the host. GMP specifically reduces Desulfovibrio (associated with the pathogenesis of IBD and generation of hydrogen sulfide a cytotoxic compound), increases SCFAs (associated with enhanced intestinal barrier function and reduced pH), and induces anti-inflammatory effects that previous reports have linked with attenuation of inflammation and intestinal damage in preclinical models of IBD (10). Palatable functional and medical foods can be made with GMP, and such foods may be a beneficial in the management of PKU, obesity, and IBD. Additional research is needed to elucidate the complex interactions between GMP, the GI microbiota, intestinal mucin composition, and immune function.
GRANTS
This work was supported by U.S. Department of Agriculture HATCH Grant WIS01790 and by NIH grant T32 DK 007665 to D. M. Ney.
DISCLOSURES
Denise M. Ney is a coinventor on U.S. Patent 8,604,168 B2, “Glycomacropeptide Medical Foods for Nutritional Management of Phenylketonuria and other Metabolic Disorders,” which is held by the Wisconsin Alumni Research Foundation and licensed to Cambrooke Therapeutics, LLC. Peggy Steele, a member of Dr. Steele's family, is employed by DuPont, a supplier of bacterial cultures to the food industry.
AUTHOR CONTRIBUTIONS
E.A.S., J.L.S., and D.M.N. conception and design of research; E.A.S., T.J.D.W., B.A., B.M.S., and S.G.M. performed experiments; E.A.S., T.J.D.W., B.A., B.M.S., S.G.M., and D.M.N. analyzed data; E.A.S., T.J.D.W., B.A., J.L.S., and D.M.N. interpreted results of experiments; E.A.S. and S.G.M. prepared figures; E.A.S. and D.M.N. drafted manuscript; E.A.S., T.J.D.W., B.M.S., S.G.M., J.L.S., and D.M.N. edited and revised manuscript; D.M.N. approved final version of manuscript.
ACKNOWLEDGMENTS
We thank Sandy Bertics in the Department of Dairy Science for assistance in analyzing SCFA concentrations. We also thank Lori Neal and Laura Knoll for assistance in sharing flow cytometry methodology and undergraduate student Jennifer Mallon for help in maintenance of the mouse colony.
REFERENCES
- 1.Aimulis WR. Bioactive properties of milk proteins with particular focus on anticariogenesis. J Nutr 134, Suppl 4: S989–S995, 2004. [DOI] [PubMed] [Google Scholar]
- 2.Beucher S, Levenez F, Yvon M, Corring T. Effects of gastric digestive products from casein on CCK release by intestinal cells in rat. J Nutr Biochem 5: 578–584, 1994. [Google Scholar]
- 3.Brody EP. Biological activities of bovine glycomacropeptide. Br J Nutr 84, Suppl 1: 39–46, 2000. [DOI] [PubMed] [Google Scholar]
- 4.Caporaso JG, Kuczynski J, Stombaugh J, Bittinger K, Bushman FD, Costello EK, Fierer N, Gonzalez PA, Goodrich JK, Gordon JI, Huttley GA, Kelley ST, Knights D, Koenig JE, Ley RE, Lozupone CA, McDonald D, Muegge BD, Pirrung M, Reeder J, Sevinsky JR, Turnbaugh PJ, Walters WA, Widmann J, Yatsunenko T, Zaneveld J, Knight R. QIIME allows analysis of high-throughput community sequencing data. Nature Med 7: 335–336, 2010. [DOI] [PMC free article] [PubMed] [Google Scholar]
- 5.Chabance B, Marteau P, Rambaud JC, Migliore-Samour D, Boynard M, Perrotin P, Guillet R, Jolles P, Fiat AM. Casein peptide release and passage to the blood in humans during digestion of milk or yogurt. Biochimie 80: 155–165, 1998. [DOI] [PubMed] [Google Scholar]
- 6.Chen Q, Cao J, Jia Y, Liu W, Yan Y, Pang G. Modulation of mice fecal microbiota by administration of casein glycomacropeptide. Microbiol Res 3: 3, 2012. [Google Scholar]
- 7.Claustre J, Toumi F, Trompette A, Jourdan G, Guignard H, Chayvialle JA, Plaisancié P. Effects of peptides derived from dietary proteins on mucus secretion in rat jejunum. Am J Physiol Gastrointest Liver Physiol 283: G521–G528, 2002. [DOI] [PubMed] [Google Scholar]
- 8.Daddaoua A, Puerta V, Zarzuelo A, Suárez MD, de Medina FS, Martínez-Augustin O. Bovine glycomacropeptide is anti-inflammatory in rats with hapten-induced colitis. J Nutr 135: 1164–1170, 2005. [DOI] [PubMed] [Google Scholar]
- 9.de Carcer DA, Cuiv PO, Wang T, Kang S, Worthley D, Whitehall V, Gordon I, McSweeney C, Leggett B, Morrison M. Numerical ecology validates a biogeographical distribution and gender-based effect on mucosa-associated bacteria along the human colon. ISME J 5: 801–809, 2011. [DOI] [PMC free article] [PubMed] [Google Scholar]
- 10.de Medina FS, Daddaoua A, Requena P, Capitán-Cañadas F, Zarzuelo A, Suárez MD, Martínez-Augustin O. New insights into the immunological effects of food bioactive peptides in animal models of intestinal inflammation. Proc Nutr Soc 69: 454–462, 2010. [DOI] [PubMed] [Google Scholar]
- 11.DeSantis TZ, Hugenholtz P, Larsen N, Rojas M, Brodie EL, Keller K, Huber T, Dalevi D, Hu P, Andersen GL. Greengenes, a chimera-checked 16S rRNA gene database and workbench compatible with ARB. Appl Environ Microbiol 72: 5069–5072, 2006. [DOI] [PMC free article] [PubMed] [Google Scholar]
- 12.Devkota S, Wang Y, Musch MW, Leone V, Fehlner-Peach H, Nadimpalli A, Antonopoulos DA, Jabri B, Chang EB. Dietary-fat-induced taurocholic acid promotes pathobiont expansion and colitis in Il10−/− mice. Nature 487: 104–108, 2012. [DOI] [PMC free article] [PubMed] [Google Scholar]
- 13.Dray S, Dufour AB. The ade4 package: implementing the duality diagram for ecologist. J Stat Softw 22: 1–20, 2007. [Google Scholar]
- 14.Etzel MR. Manufacture and use of dairy protein fractions. J Nutr 134: 996S–1002S, 2004. [DOI] [PubMed] [Google Scholar]
- 15.Faure M, Mettraux C, Moennoz D, Godin J, Vuichoud J, Rochat F, Breuillé D, Obled C, Corthésy-Theulaz I. Specific amino acids increase mucin synthesis and microbiota in dextran sulfate sodium-treated rats. J Nutr 136: 1558–1564, 2006. [DOI] [PubMed] [Google Scholar]
- 16.Faure M, Moënnoz D, Montigon F, Mettraux C, Breuillé D, Ballèvre O. Dietary threonine restriction specifically reduces intestinal mucin synthesis in rats. J Nutr 135: 486–491, 2005. [DOI] [PubMed] [Google Scholar]
- 17.Florin THJ, Neale G, Goretski S, Cummings JH. The sulfate content of foods and beverages. J Food Comp Analysis 6: 140–151, 1993. [Google Scholar]
- 18.Food and Drug Administration. Guidance for industry: frequently asked questions about medical foods (2nd ed.) (Online). Washington DC: US Food and Drug Administration, 2013. http://www.fda.gov/food/guidanceregulation/guidancedocumentsregulatoryinformation/ [July 2015]. [Google Scholar]
- 19.French EA, Bertics SJ, Armentano LE. Rumen and milk odd- and branched-chain fatty acid proportions are minimally influenced by ruminal volatile fatty acid infusions. J Dairy Sci 95: 2015–2026, 2012. [DOI] [PubMed] [Google Scholar]
- 20.Fukuda S, Toh H, Hase K, Oshima K, Nakanishi Y, Yoshimura K, Tobe T, Clarke JM, Topping DL, Suzuki T, Taylor TD, Itoh K, Kikuchi J, Morita H, Hattori M, Ohno H. Bifidobacteria can protect from enteropathogenic infection through production of acetate. Nature 46937331: 543–547, 2011. [DOI] [PubMed] [Google Scholar]
- 21.Gibson GR. Physiology and ecology of the sulphate-reducing bacteria. J Appl Bacteriol 69: 769–797, 1990. [DOI] [PubMed] [Google Scholar]
- 22.Gibson GR, Roberfroid M, eds. Handbook of Prebiotics. Boca Raton, FL: CRC, 2008. [Google Scholar]
- 23.Hamilton MK, Boudry G, Lemay DG, Raybould HE. Changes in intestinal barrier function and gut microbiota in high-fat diet-fed rats are dynamic and region dependent. Am J Physiol Gastrointest Liver Physiol 308: G840–G851, 2015. [DOI] [PMC free article] [PubMed] [Google Scholar]
- 24.Hansen KE, Ney DM. A systematic review of bone mineral density and fractures in phenylketonuria. J Inherit Metab Dis 37: 875–880, 2014. [DOI] [PMC free article] [PubMed] [Google Scholar]
- 25.Harding CO, Gillingham MB, Bird A, Koeberl DD. Complete correction of hyperphenylalaninemia following liver-directed, AAV2/8-mediated gene therapy in murine phenylketonuria. Gene Ther 13: 457–462, 2006. [DOI] [PMC free article] [PubMed] [Google Scholar]
- 26.Hennermann JB, Roloff S, Gellermann J, Vollmer I, Windt E, Vetter B, Plöckinger U, Mönch E, Querfeld U. Chronic kidney disease in adolescent and adult patients with phenylketonuria. J Inherit Metab Dis 36: 747–756, 2013. [DOI] [PubMed] [Google Scholar]
- 27.Jowett SL, Seal CJ, Pearce MS, Phillips E, Gregory W, Barton JR, Welfare MR. Influence of dietary factors on the clinical course of ulcerative colitis: a prospective cohort study. Gut 53: 1479–1484, 2004. [DOI] [PMC free article] [PubMed] [Google Scholar]
- 28.Kawasaki Y, Isoda H, Tanimoto M, Dosako S, Idota T, Ahiko K. Inhibition by lactoferrin and κ-casein glycomacropeptide of binding of cholera toxin to its receptor. Biosci Biotechnol Biochem 56: 195–198, 1992. [DOI] [PubMed] [Google Scholar]
- 29.Kelleher SL, Chatterton D, Nielsen K, Lönnerdal B. Glycomacropeptide and α-lactalbumin supplementation of infant formula affects growth and nutritional status in infant rhesus monkeys. Am J Clin Nutr 77: 1261–1268, 2003. [DOI] [PubMed] [Google Scholar]
- 30.LaClair CE, Ney DM, MacLeod EL, Etzel MR. Purification and use of glycomacropeptide for nutritional management of phenylketonuria. J Food Sci 74: E199–E206, 2009. [DOI] [PMC free article] [PubMed] [Google Scholar]
- 31.López-Posadas R, Requena P, González R, Suárez MD, Zarzuelo A, de Medina FS, Martínez-Augustin O. Bovine glycomacropeptide has intestinal antiinflammatory effects in rats with dextran sulfate-induced colitis. J Nutr 140: 2014–2019, 2010. [DOI] [PubMed] [Google Scholar]
- 32.McDonald JD, Bode VC, Dove WF, Shedlovsky A. Pahhph-5: a mouse mutant deficient in phenylalanine hydroxylase. Proc Natl Acad Sci 87: 1965–1967, 1990. [DOI] [PMC free article] [PubMed] [Google Scholar]
- 33.Mills DJS, Tuohy KM, Booth J, Buck M, James M, Crabbe C, Gibson GR, Ames JM. Dietary glycated protein modulates the colonic microbiota towards a more detrimental composition in ulcerative colitis patients and non-ulcerative colitis subjects. J Appl Microbiol 105: 706–714, 2008. [DOI] [PubMed] [Google Scholar]
- 34.National Research Council. Nutrient Requirements of Laboratory Animals (4th rev. ed.) Washington, DC: National Academy of Sciences, National Research Council, Board on Agriculture, Committee on Animal Nutrition, 1995. [Google Scholar]
- 35.Ney DM, Blank RD, Hansen KE. Advances in the nutritional and pharmacological management of phenylketonuria. Curr Opin Clin Nutr Metab Care 17: 61–68, 2014. [DOI] [PMC free article] [PubMed] [Google Scholar]
- 36.Ohlsson C, Sjögren K. Effects of the gut microbiota on bone mass. Trends Endocrinol Metab 26: 69–74, 2015. [DOI] [PubMed] [Google Scholar]
- 37.Okayasu I, Hatakeyama S, Yamada M, Ohkusa T, Inagaki Y, Nakaya R. A novel method in the induction of reliable experimental acute and chronic ulcerative colitis in mice. Gastroenterology 98: 694–702, 1990. [DOI] [PubMed] [Google Scholar]
- 38.Ortega-González M, Capitán-Cañadas F, Requena P, Ocón B, Romero-Calvo I, Aranda C, Suárez MD, Zarzuelo A, de Medina FS, Martínez-Augustin O. Validation of bovine glycomacropeptide as an intestinal anti-inflammatory nutraceutical in the lymphocyte-transfer model of colitis. Br J Nutr 111: 1202–1212, 2014. [DOI] [PubMed] [Google Scholar]
- 39.Otani H, Monnai M, Kawasaki Y, Kawakami H, Tanimoto M. Inhibition of mitogen-induced proliferative responses of lymphocytes by bovine κ-caseinoglycopeptides having different carbohydrate chains. J Dairy Res 62: 349–357, 1995. [DOI] [PubMed] [Google Scholar]
- 40.Pitcher MCL, Beatty ER, Cummings JH. The contribution of sulphate reducing bacteria and 5-aminosalicylic acid to faecal sulphide in patients with ulcerative colitis. Gut 46: 64–72, 2000. [DOI] [PMC free article] [PubMed] [Google Scholar]
- 41.Pitcher MCL, Cummings JH. Hydrogen sulphide: a bacterial toxin in ulcerative colitis? Gut 39: 1–4, 1996. [DOI] [PMC free article] [PubMed] [Google Scholar]
- 42.Poppitt SD, Strik CM, McArdle BH, McGill A, Hall RS. Evidence of enhanced serum amino acid profile but not appetite suppression by dietary glycomacropeptide (GMP): a comparison of dairy whey proteins. J Am Coll Nutr 32: 177–186, 2013. [DOI] [PubMed] [Google Scholar]
- 43.R Development Core Team. R: A language and environment for statistical computing. Vienna, Austria: R Foundation for Statistical Computing, 2011. [Google Scholar]
- 44.Reeves PG, Nielsen FH, Fahey GC Jr. AIN-93 purified diets for laboratory rodents: final report of the American Institute of Nutrition ad hoc writing committee on the reformulation of the AIN-76A rodent diet. J Nutr 123: 1939–1951, 1993. [DOI] [PubMed] [Google Scholar]
- 45.Requena P, Daddaoua A, Guadix E, Zarzuelo A, Suárez MD, De Medina FS, Martínez-Augustin O. Bovine glycomacropeptide induces cytokine production in human monocytes through the stimulation of the MAPK and the NF-kB signal transduction pathways. Br J Pharmacol 157: 1232–1240, 2009. [DOI] [PMC free article] [PubMed] [Google Scholar]
- 46.Requena P, Daddaoua A, Martínez-Plata E, González M, Zarzuelo A, Suárez MD, de Medina FS, Martínez-Augustin O. Bovine glycomacropeptide ameliorates experimental rat ileitis by mechanisms involving downregulation of interleukin 17. Br J Pharmacol 154: 825–832, 2008. [DOI] [PMC free article] [PubMed] [Google Scholar]
- 47.Requena P, González R, López-Posadas R, Abadía-Molina A, Suárez MD, Zarzuelo A, de Medina FS, Martínez-Augustin O. The intestinal antiinflammatory agent glycomacropeptide has immunomodulatory actions on rat splenocytes. Biochem Pharmacol 79: 1797–1804, 2010. [DOI] [PubMed] [Google Scholar]
- 48.Ringel Y, Maharshak N. Intestinal microbiota and immune function in the pathogenesis of irritable bowel syndrome. Am J Physiol Gastrointest Liver Physiol 305: G529–G541, 2013. [DOI] [PMC free article] [PubMed] [Google Scholar]
- 49.Roberfroid M, Gibson GR, Hoyles L, McCartney AL, Rastall R, Rowland I, Wolvers D, Watztl B, Szajewska H, Stahl B, Guarner F, Respondek F, Whelan K, Coxam V, Davicco M, Léotoing L, Wittrant Y, Delzenne N, Cani P, Neyrinck A, Meheust A. Prebiotic effects: metabolic and health benefits. Br J Nutr 104, Suppl 2: S1–S63, 2010. [DOI] [PubMed] [Google Scholar]
- 50.Roediger WE, Duncan A, Kapaniris O, Millard S. Reducing sulfur compounds of the colon impair colonocyte nutrition: implications for ulcerative colitis. Gastroenterology 104: 802–809, 1993. [DOI] [PubMed] [Google Scholar]
- 51.Rogers QR, Harper AE. Amino acid diets and maximal growth in the rat. J Nutr 87: 267–273, 1965. [DOI] [PubMed] [Google Scholar]
- 52.Romagnani S. T-cell subsets (Th1 versus Th2). Annals Allergy Asthma Immun 85: 9–21, 2000. [DOI] [PubMed] [Google Scholar]
- 53.Rowan F, Docherty NG, Murphy M, Murphy B, Coffey JC, O'Connell PR. Desulfovibrio bacterial species are increased in ulcerative colitis. Dis Colon Rectum 53: 1530–1536, 2010. [DOI] [PubMed] [Google Scholar]
- 54.Sawin EA, Murali SG, Ney DM. Differential effects of low-phenylalanine protein sources on brain neurotransmitters and behavior in C57Bl/6-Pahenu2 mice. Mol Gene Metab 111: 452–461, 2014. [DOI] [PMC free article] [PubMed] [Google Scholar]
- 55.Schoenborn JR, Wilson CB. Regulation of interferon-γ during innate and adaptive immune responses. Adv Immunol 96: 41–101, 2007. [DOI] [PubMed] [Google Scholar]
- 56.Smith EA, Macfarlane GT. Enumeration of human colonic bacteria producing phenolic and indolic compounds: effects of pH, carbohydrate availability and retention time on dissimilatory aromatic amino acid metabolism. J Appl Bacteriol 81: 288–302, 1996. [DOI] [PubMed] [Google Scholar]
- 57.Solverson P, Murali SG, Brinkman AS, Nelson DW, Clayton MK, Yen CE, Ney DM. Glycomacropeptide, a low-phenylalanine protein isolated from cheese whey, supports growth and attenuates metabolic stress in the murine model of phenylketonuria. Am J Physiol Endocrinol Metab 302: E885–E895, 2012. [DOI] [PMC free article] [PubMed] [Google Scholar]
- 58.Solverson P, Murali SG, Litscher SJ, Blank RD, Ney DM. Low bone strength is a manifestation of phenylketonuria in mice and is attenuated by a glycomacropeptide diet. PloS One 7: e45165, 2012. [DOI] [PMC free article] [PubMed] [Google Scholar]
- 59.Sprong RC, Schonewille AJ, Van der Meer R. Dietary cheese whey protein protects rats against mild dextran sulfate sodium-induced colitis: role of mucin and microbiota. J Dairy Sci 93: 1364–1371, 2010. [DOI] [PubMed] [Google Scholar]
- 60.Supelco. Analyzing fatty acids by packed column gas chromatography. Technical Bulletin 856B St. Louis, MO: Sigma-Aldrich, 1998. [Google Scholar]
- 61.Thomä-Worringer C, Sørensen J, López-Fandiño R. Health effects and technological features of caseinomacropeptide. Int Dairy J 16: 1324–1333, 2006. [Google Scholar]
- 62.Van Calcar SC, Ney DM. Food products made with glycomacropeptide, a low-phenylalanine whey protein, provide a new alternative to amino acid-based medical foods for nutrition management of phenylketonuria. J Acad Nutr Dietetics 112: 1201–1210, 2012. [DOI] [PMC free article] [PubMed] [Google Scholar]
- 63.Veldhorst MAB, Nieuwenhuizen AG, Hochstenbach-Waelen A, Westerterp KR, Engelen MPKJ, Brummer RJM, Deutz NEP, Westerterp-Plantenga MS. Effects of complete whey-protein breakfasts versus whey without GMP-breakfasts on energy intake and satiety. Appetite 52: 388–395, 2009. [DOI] [PubMed] [Google Scholar]
- 64.Wang B. Sialic acid is an essential nutrient for brain development and cognition. Ann Rev Nutr 29: 177–222, 2009. [DOI] [PubMed] [Google Scholar]