Abstract
Multifunctional nanoparticles exhibiting red or green luminescence properties and magnetism were synthesized and thoroughly analyzed. The hydrothermal method was used for the synthesis of Eu3+- or Tb3+-doped GdF3-, NaGdF4-, and BaGdF5-based nanocrystalline materials. The X-ray diffraction patterns of the samples confirmed the desired compositions of the materials. Transmission electron microscope images revealed the different morphologies of the products, including the nanocrystal sizes, which varied from 12 nm in the case of BaGdF5-based nanoparticles to larger structures with dimensions exceeding 300 nm. All of the samples presented luminescence under ultraviolet irradiation, as well as when the samples were in the form of water colloids. The highest luminescence was observed for BaGdF5-based materials. The obtained nanoparticles exhibited paramagnetism along with probable evidence of superparamagnetic behavior at low temperatures. The particles’ magnetic characteristics were also preserved for samples in the form of a suspension in distilled water. The cytotoxicity studies against the human erythrocytes indicated that the synthesized nanoparticles are non-toxic because they did not cause the red blood cells shape changes nor did they alter their membrane structure and permeabilization.
Electronic supplementary material
The online version of this article (doi:10.1007/s11051-015-3191-2) contains supplementary material, which is available to authorized users.
Keywords: Nanoparticles, Erythrocytes, Cytotoxicity, Luminescence, Magnetism, Lanthanides
Introduction
In recent decades, nanotechnology and engineering of advanced nanomaterials became intensively researched subjects (Gupta and Gupta 2005; Wang et al. 2005, 2013; Sharma et al. 2006; Lin et al. 2012; Park et al. 2012; Gnach and Bednarkiewicz 2012). Currently, this trend has resulted in research results from numerous applications of nanoparticles (Rapaport et al. 2006; Hinklin et al. 2008; Bedekar et al. 2009; Selvan et al. 2009; Li et al. 2014). The basic properties, such as nanometric dimensions of particles or large surface area, as well as more advanced properties: possibility of functionalization, luminescence, magnetism, and even multifunctional properties, are the factors responsible for this growing interest in the application of nanoparticles. One from, the most important group of studied nanomaterials, is based on the properties of the materials containing lanthanide elements, e.g., the main and the most desired features, such as luminescence or magnetism, results from the properties of lanthanide ions (Ln3+) (Grzyb et al. 2012). These unique advantages are particularly interesting for nanomedicine in applications such as bioimaging, photodynamic therapy, or drug delivery (Park et al. 2012; Wang et al. 2013; Tu et al. 2013). By developing Ln3+-doped nanocrystals, the properties of existing therapeutic, contrast, or imaging agents may be improved. Additional functionalization of nanoparticles is also possible, thereby changing their cytotoxic properties and providing the possibility of further modification (Grzyb et al. 2013a; Runowski et al. 2014).
Nanoparticles in large amounts are released into the environment. Nanoparticles can reach the human body via different routes, especially the respiratory system or digestive tract, and can enter the blood stream. Moreover, the future application of therapeutic nanoparticles is based on intravenous or oral administration. It has been confirmed that nanoparticles may interact with the blood components and are capable of inducing cell membrane perturbations (Šimundić et al. 2013). Among the blood cells, red blood cells (RBCs) are the most abundant (99 %). Therefore, the studies on the interactions of nanoparticles with RBCs are of considerable importance.
The gadolinium-based nanoparticles are potentially used for cell labeling and cell trafficking in vivo via MRI and/or in vivo optical imaging (Modo et al. 2005; Vuu et al. 2005). However, certain gadolinium complexes are unstable and release the free gadolinium ions, which are paramagnetic. Gd3+ ions can also characterize cellular toxicity (Siega et al. 2009). It has been reported that cells can act as “sponges” of free Gd3+ ions (Cabella et al. 2006). In the patients with advanced reduction in renal function, treatment with the gadolinium-based cyclic contrast agents (Gd-CA) in MRI investigation induces the creation of toxic-free Gd3+ ions and generates nephrogenic systemic fibrosis (Morcos and Thomsen 2008; Perazella 2008). In addition, gadolinium toxicity could be used in the cancer treatment. It has been shown that the internalization of free Gd3+ ions, released by unstable vitamin B12 bioconjugate, in the human immortalized leukemia K562 cells induces decreases of their viability in vitro (Siega et al. 2009). The human RBCs are the model cells in the study of the effect of different chemical substances on the cell membrane structure and function, including nanoparticles (Rothen-Rutishauser et al. 2006; Šimundić et al. 2013). The ability of RBC, as a model of non-phagocytic cell, to undergo shape deformation and hemolysis after interaction with natural and synthetic compounds is widely used to estimate the cytotoxicity of chemical compounds in general (Mrówczyńska and Hägerstrand 2009; Jasiewicz et al. 2014).
Nanoparticles based on Ln3+ properties usually exhibit luminescence. Depending on the final application, the luminescence can be achieved by excitation with ultraviolet (UV), visible, or near infrared (NIR) light. As examples of luminescent ions widely used in recently studied nanophosphors, we used Eu3+ and Tb3+ ions because of their red or green luminescence. Another co-dopant, Ce3+ ions, was used as sensitizers for UV light. Studying the spectroscopic properties of Ln3+-doped nanoparticles can also elucidate structure alternations, which are especially visible in nanometric crystals. The spectroscopic properties also allowed us to obtain a complete understanding of the physicochemical characteristics of prepared nanomaterials. Additionally, the addition of Eu3+ and Tb3+ ions results in multifunctionality of synthesized nanoparticles, giving them both luminescent and magnetic properties via the Gd3+ ions in the matrix. Currently, such multifunctionality of nanoparticles is a desired property due to the possibility of using them as contrast agents for both magnetic- and optical-based methods (Liong et al. 2008; Selvan et al. 2009; Shanta Singh et al. 2013).
The magnetic properties of fluorides are governed and can be deduced from the electronic structure of lanthanide ions, where the well-localized 4f electrons have a decisive impact. For example, the addition of Tb3+ ions, which possess a high-effective magnetic moment, obscures other phenomena, such as crystal field effects and mixed valency, which are characteristic of Ce-based fluorides (Grzyb et al. 2012; Leycuras et al. 1984). In the case of Gd, one can expect very small crystal field anisotropy, as it has no ionic orbital moment, and a fairly high magnetic moment (the effective magnetic moment of free Gd3+ is equal 7.94 μB/ion). When taking into account the possible multifunctionality and biological applications, Gd-based fluorides in colloidal forms were also analyzed.
The present study was aimed to describe the structural, spectroscopic, and magnetic properties of gadolinium fluorides doped by Eu3+ and Tb3+ and co-doped by Ce3+ ions, as well as to characterize their interaction with the cell membrane. The effects of synthesized nanoparticles on the human erythrocyte shape and their sedimentation rate were also investigated.
Experimental
Materials
The rare earth oxides Gd2O3, Eu2O3, Tb4O7 (99.99 %) and cerium chloride CeCl3·6H2O (99.9 %) were purchased from Stanford Materials (United States) and ROTH (Germany), respectively. Ba(NO3)3 (pure p. a., 99 %), NH4F (ACS grade, 98 %), and NaF (ACS grade, 99 %) were purchased from Sigma Aldrich, NaBF4 (pure p. a., 97 %) was purchased from Alfa Aesar, and HNO3 (ultra-pure) and citric acid monohydrate (pure p.a.) were purchased from POCh S.A. All chemicals were used as starting materials without further purification. To obtain the appropriate nitrates, rare earth oxides were dissolved in the concentrated nitric acid. An excess amount of acid was removed by a three-time repeated evaporation of the solutions. The concentrations of prepared rare earth nitrates and also cerium chloride were set to 1 M. Ultra-pure distilled water was used in all experiments.
Synthesis of nanoparticles
BaGdF5:2.5 %Ce3+,2.5 %Eu3+ and BaGdF5:2.5 %Ce3+,2.5 %Tb3+
The barium gadolinium fluoride samples doped by Ce3+ and Eu3+ or Tb3+ ions were synthesized as follows. Stoichiometric amounts (for 2 mmol of product) of Ba(NO3)2, Gd(NO3)3, CeCl3, and Eu(NO3)3 or Tb(NO3)3 were mixed in 30 mL of distilled water. A stoichiometric amount of NH4F was dissolved in 30 mL of distilled water under vigorous stirring and added dropwise into the solution containing barium and lanthanides ions. The obtained colloid was transferred to the Teflon-lined vessel and put under microwave-assisted hydrothermal conditions of 180 °C and 40 bar for 8 h. After cooling down, white precipitate was collected, washed several times with water and ethanol, and then dried at 80 °C for 48 h.
GdF3:2.5 %Ce3+, 2.5 %Eu3+ and GdF3:2.5 %Ce3+, 2.5 %Tb3+
The gadolinium fluoride nanoparticles doped by Ce3+ and Eu3+ or Tb3+ ions were obtained by mixing stoichiometric amounts (for 2 mmol of the product) of suitable rare earth salts in 100 mL of distilled water. Precipitation of the product was conducted using two methods. In the first method, NH4F was used as the precipitating compound. The second method was based on the decomposition of NaBF4 in the hydrothermal conditions. The preparation of RE3+ solution was followed by adding dropwise 100 mL of NH4F or NaBF4 solution (120 % of their stoichiometric amount) under vigorous stirring. The reaction with the first compound resulted in the precipitation of fluoride. The addition of NaBF4 was neutral for the color and transparency of the reagents solution. The obtained milky or transparent solutions were transferred into a Teflon-lined autoclave. The reaction was conducted for 2 h at 180 °C and at a pressure of 40 bar. The white precipitates obtained in the each reaction were purified several times via centrifugation with water. The white precipitate was dried in vacuum for 48 h.
NaGdF4:2.5 %Ce3+,2.5 %Eu3+ and NaGdF4:2.5 %Ce3+,2.5 %Tb3+
In the typical synthesis of 3 mmol of the samples, appropriate solutions of Gd(NO3)3, CeCl3, and Eu(NO3)3 or Tb(NO3)3 were mixed together with citric acid in their stoichiometric ratios. The as-prepared mixture was vigorously stirred for 30 min. Subsequently, NaF (625 % excess of stoichiometric amount) was dissolved in water and mixed with the above solution. The mixture was adjusted to pH = 10 by adding NaOH (2 M) solution. After additional stirring for 15 min, the entire transparent solution was transferred into a Teflon-lined autoclave. The reaction was conducted for over 3 h at 180 °C and at a pressure of 40 bar. The white precipitate obtained was purified several times via centrifugation with water. Finally, the precipitate was dried at 80 °C for 48 h.
All synthesized nanopowders obtained were grounded in agate mortar. Colloidal solutions were prepared by ultrasonification of appropriate amount of nanopowders for 1 h and overnight magnetic stirring of the obtained suspension. Next, after sedimentation of the large and agglomerated particles, the supernatant solution was used for the further studies.
Methods of cytotoxicity analysis
Preparation of erythrocytes
The human RBCs, freshly isolated from buffy coats, were obtained from the blood bank. The RBCs were washed three times (3000 rpm, 10 min, +4 °C) in phosphate-buffered saline (PBS—137 mM NaCl, 2.7 mM KCl, 10 mM NaHPO4, 1.76 mM KH2PO4, and 10 mM glucose, pH 7.4). After washing, the RBCs were suspended in the buffer at 1.65 × 10⁹ cells/mL, stored at +4 °C, and then used within 5 h.
Erythrocyte sedimentation under nanoparticles
The erythrocytes (1.65 × 10⁸ cells/mL) were incubated with nanoparticles at the final concentrations of 0.05, 0.5, 1.0, and 5.0 mg/mL in EP vials for 1 h at 37 °C. The RBCs incubated in PBS only were taken as the control. Each sample was prepared in triplicate, and the experiments were repeated three times using RBCs from different donors. The erythrocytes sedimentation rate (ESR) was recorded using camera. The shapes of both treated and control RBC were estimated using a light microscope. After observation, the RBCs were fixed with 5 % paraformaldehyde plus 0.01 % glutaraldehyde for 1 h at room temperature (RT).
Erythrocytes shape under nanoparticles examined using a scanning electron microscope (SEM)
The fixed RBCs were washed three times with PBS (by exchanging supernatant with PBS) and post-fixed with 1 % OsO4 for 30 min at RT. Following washing, the RBCs were dehydrated in a series of ethanol solutions (50, 60, 70, 80, 90, 95, and 100 %), critical-point dried, and gold-sputtered. A large number of RBCs were examined using an EVO 40 (ZEISS, Germany) scanning electron microscope. The SEM micrographs enabled counting of RBCs of varying shape under nanoparticles treatment, and the percentage share of the different forms of RBCs (discocytes, echinocytes, and stomatocytes) in 500 cells was determined, according to the procedure of Bonarska-Kujawa et al. (2012).
Ultrathin erythrocyte section observed using a transmission electron microscope (TEM)
The erythrocytes (1.65 × 10⁸ cells/mL) were incubated with nanoparticles at the final concentrations of 5.0 mg/mL in EP vials for 1 h at 37 °C. The RBCs incubated in PBS only were taken as the control. After incubation, the erythrocytes were fixed with 1 % glutaraldehyde in PBS buffer for 1 h at RT. The fixed RBCs were washed three times with PBS (by exchanging supernatant with PBS) and post-fixed with 1 % OsO4 in PBS buffer for 1 h at RT. Following washing, the RBCs were dehydrated in a series of ethanol solutions (50, 60, 70, 80, 90, 95, and 100 %). Finally, the RBCs were embedded in Epon 812 with 2 % DMP-30. Ultrathin sections were contrasted with uranyl acetate and lead citrate, and then examined under a JEM 1200 EX II transmission electron microscope.
Erythrocytes and nanoparticles detection using a fluorescence microscope
The erythrocytes (1.65 × 10⁸ cells/mL) were incubated with nanoparticles at the final concentrations of 0.05, 0.5, 1.0, and 5.0 mg/mL in EP vials for 1 h at 37 °C. The RBCs incubated in PBS only were taken as the control. Each sample was prepared in triplicate, and the experiments were repeated three times using RBCs from different donors. After incubation, the RBCs were fixed with 5 % paraformaldehyde plus 0.01 % glutaraldehyde for 1 h at RT. Following washing, the RBCs were settled on polylysine-treated (0.1 mg/mL, 10 min) cover glasses and then washed. The cells were mounted on 80 % glycerol. The cover slips were sealed with nail polish. A large number of RBCs in several separate experimental samples were studied for nanoparticle binding using a Zeiss LSM 510 (AXIOVERT ZOOM) fluorescence microscope (100 ×/1.4 aperture immersion oil objective, 10 × ocular) with the appropriate optical filters (for the argon laser wavelength of 488 nm: LP 505 nm or BP 565–615 nm; for the argon laser wavelength of 458 nm: BP 480–520 nm). Images (single-section) were acquired using the Zeiss LSM Image Browser program.
Hemolysis assay under nanoparticles
Each RBC suspension (1.65 × 10⁸ cells/mL, ~1.5 % hematocrit) with nanoparticles at different final concentrations (0.05, 0.5, 1.0, and 5 mg/mL) was incubated in EP for 1 h at 37 °C. Each sample was prepared in triplicate, and the experiments were repeated three times with erythrocytes from different donors. After incubation, the RBC suspensions were centrifuged at 3000 rpm for 10 min. The degree of hemolysis (hemoglobin escape from the cell to outer solution) was estimated by measuring the absorbance of the supernatant at 540 nm, as previously reported (Jasiewicz et al. 2014). The absorbance of the control RBC (in PBS only) was used as the blank.
Characterization
X-ray diffraction (XRD) patterns were collected on a Bruker AXS D8 Advance diffractometer in Bragg–Brentano geometry, with Cu-Kα1 radiation (λ = 1.5406 Å) in the 2θ range from 6° to 60°. Transmission electron microscopy (TEM) images were collected on the FEI Tecnai G2 20 X-TWIN transmission electron microscope, which used an accelerating voltage of 200 kV. Maud 2.55 software was used to perform Rietveld refinement of cell parameters (Lutterotti and Bortolotti 2003).
The excitation and emission spectra measurements were performed on a Hitachi F-7000 fluorescence spectrophotometer at room temperature. Excitation and emission spectra were corrected for the instrumental response. The QuantaMasterTM 40 spectrophotometer equipped with an Opolette 355LD UVDM tunable laser, which had a repetition rate of 20 Hz as the excitation source and a Hamamatsu R928 photomultiplier as a detector was used to measure luminescence decays.
Magnetic measurements were performed using a quantum design physical property measurement system (PPMS) with a vibrating sample magnetometer (VSM) option at temperatures between 2 and 300 K and in external magnetic fields up to 5 T. The colloid was immured in non-magnetic plastic container and then measured under the same conditions using a quantum design magnetic property measurement system (MPMS).
Results and discussion
The hydrothermal method has become one of the most promising methods of nanomaterials synthesis (Yoshimura and Byrappa 2007). This convenient approach for synthesis allows for obtaining nanocrystals of different morphologies and is a good alternative for reactions in toxic organic solvents or with the use of annealing and thermolysis. Reactions performed in water at elevated temperature and pressure usually resulted in products of high crystallinity, which is especially important for luminescent nanomaterials, where defects of structure could increase non-radiative transitions and therefore lower the emission efficiency (Karbowiak et al. 2005).
Structure and morphology
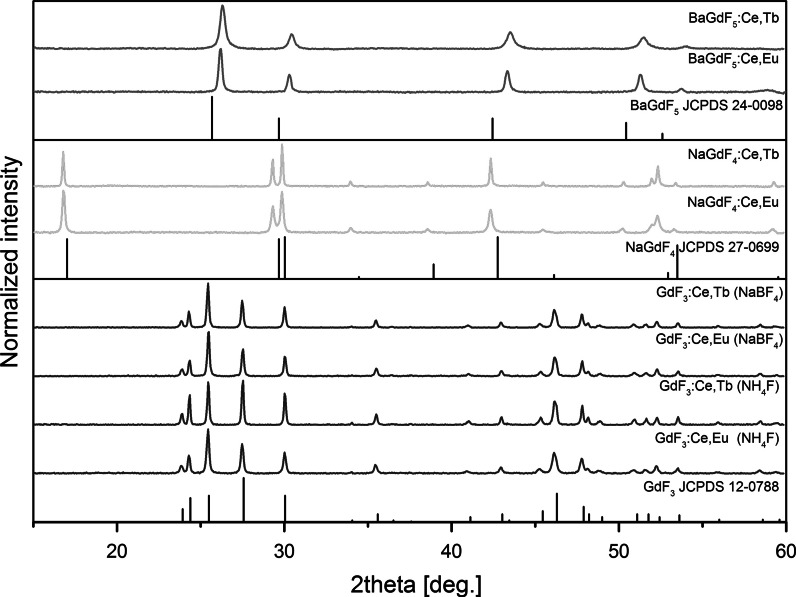
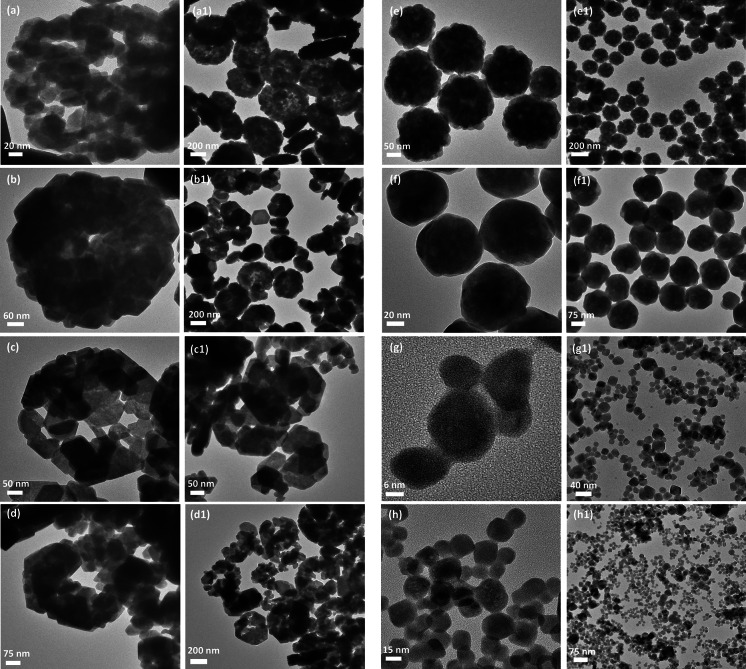
The structural analysis of the prepared rare earth fluorides was performed using XRD measurements. Figure 1 presents XRD patterns of the as-prepared BaGdF5, NaGdF4, and GdF3 nanocrystals doped with either Ce3+ and Tb3+ ions or Ce3+ and Eu3+ ions. Diffraction patterns for each material exhibit peak broadening, which indicates the nanodimensional size of the crystallites. The most broadened lines are observed for the Ln3+-doped BaGdF5 samples, which correspond to the smallest average crystallite size among the synthesized materials and are consistent with the TEM images (Fig. 2g, g1, h, and h1). For the Ln3+-doped GdF3 nanocrystals, all the diffraction peaks clearly demonstrate the presence of orthorhombic GdF3 crystal structure, and the Pnma space group corresponds to JCPDS No. 12-0788. The most intense reflex for the GdF3 samples is (020), which is different in relation to reference data; this difference is an effect of the crystal growth into the preferential orientation (Li et al. 2011). The use of NaBF4 has not strongly influenced the structure and morphology of the obtained nanocrystallites. Sodium gadolinium fluoride, NaGdF4, can exist in two phases: cubic (α-phase) and hexagonal (β-phase) (Naccache et al. 2009). The XRD patterns of the Ln3+-doped NaGdF4 exhibit diffraction peaks that correspond to the presence of the pure hexagonal phase with a space group (JCPDS No. 27-0699). The diffraction peaks recorded for the BaGdF5 nanocrystals can be indexed as cubic phase and space group Fm3 m (JCPDS No. 24-0098) (Yang et al. 2011).
Fig. 1.
XRD patterns of the BaGdF5, NaGdF4, and GdF3 doped with 2.5 % Ce3+ and either 2.5 % Tb3+ or 2.5 % Eu3+ ions synthesized by hydrothermal method at 180 °C for 2 h
Fig. 2.
TEM images of the as-synthesized nanomaterials: GdF3:2.5 %Ce3+,2.5 %Eu3+ (NH 4 F) (a, a1), GdF3:2.5 %Ce3+,2.5 %Tb3+ (NH 4 F) (b, b1), GdF3:2.5 %Ce3+,2.5 %Eu3+ (NaBF 4 ) (c, c1), GdF3: 2.5 %Ce3+,2.5 %Tb3+ (NaBF 4 ) (d, d1), NaGdF4:2.5 %Ce3+, 2.5 %Eu3+ (e, e1), NaGdF4:2.5 %Ce3+,2.5 %Tb3+ (f, f1), BaGdF5:2.5 %Ce3+, 2.5 %Eu3+ (g, g1), and BaGdF5:2.5 %Ce3+,2.5 %Tb3+ (h, h1)
Note that shifts of the XRD peaks are observed in relation to the reference patterns what resulted from the changed crystal cell volumes. The calculated cell volumes are summarized in Table 1. For the NaGdF4 and GdF3 used hosts, the calculated cell volume of synthesized compound is larger than this from the reference data. This indicates a nanocrystallinity of obtained materials as the cell volumes of materials in their nanocrystalline form are usually larger than in bulk counterparts. This behavior is known as “size effect” and it is related to defects of the structure and the formation of positive pressure inside the nanocrystal, extending the structure (Ayyub et al. 1995; Tallant et al. 2002). The difference between reference cell volume and this calculated for BaGdF5 doped by Ce3+ and Tb3+ or Eu3+ co-dopants is larger than in the remaining compounds. Additionally, the cell volume decreased instead of expected expansion of crystal cell. Addition of dopants into the structure of BaGdF5 affected the crystal structure and caused compression of cell volume to similar size as in the case of BaYF5 (204.34 Å3). The intensities and positions of the peaks for the all nanostructures are in accordance with the literature reference patterns. In addition, sharp and well-resolved peaks indicate the high crystallinity of the samples obtained.
Table 1.
Cell parameters of synthesized samples compared with references from the JCPDS database
| Sample | a (Å) | b (Å) | c (Å) | V (Å3) |
|---|---|---|---|---|
| BaGdFa5 | 6.023 | – | – | 218.49 |
| BaGdF5:Ce,Tb | 5.874 | – | – | 202.70 |
| BaGdF5:Ce,Eu | 5.899 | – | – | 205.27 |
| NaGdFb4 | 6.020 | – | 3.601 | 113.02 |
| NaGdF4:Ce,Tb | 6.090 | – | 3.628 | 116.55 |
| NaGdF4:Ce,Eu | 6.088 | – | 3.633 | 116.60 |
| GdFc3 | 6.571 | 6.985 | 4.393 | 201.63 |
| GdF3:Ce,Tb (NaBF4) | 6.576 | 6.997 | 4.404 | 202.67 |
| GdF3:Ce,Eu (NaBF4) | 6.573 | 6.993 | 4.398 | 202.17 |
| GdF3:Ce,Tb (NH4F) | 6.572 | 6.995 | 4.400 | 202.26 |
| GdF3:Ce,Eu (NH4F) | 6.575 | 6.999 | 4.406 | 202.77 |
aJCPDS 24-0098
bJCPDS 27-0699
cJCPDS 12-0788
The size and morphology of the nanomaterials obtained were characterized based on TEM images (Fig. 2a–h, taken with different magnifications). The products are well crystallized and exhibit interesting and different features for each fluoride morphology. The GdF3:Ce3+,Eu3+ and GdF3:Ce3+,Tb3+ samples synthesized with the presence of NH4F and NaBF4 as a fluorine source have similar morphology and tend to form aggregates with the dimensions of approximately 300 nm. These structures are constructed with many self-assembled nanocrystallites of size not exceeding 20 nm. The reports of the synthesis of similar structures can be found in the literature (Wang et al. 2006; Zhong et al. 2009; Safronikhin et al. 2011; Grzyb et al. 2013b). The morphology of GdF3:Ln3+ nanocrystals can be described as distorted or not fully formed rings. The formation mechanism of ring-like structures was explained previously and involves the crystallization of hexagonal particles at the initial step (Zhong et al. 2009). In the next step, a phase transition to the orthorhombic arc-like crystals occurs, followed by their aggregation to ring-like structures.
Figure 2e, e1, f, and f1 shows TEM images of the as-prepared Ln3+-doped NaGdF4 samples. From the high-magnification TEM image, monodisperse and uniform nanospheres (average size is of approximately 150 nm) are found to contain many small nanocrystals of size of approximately 10 nm, which are more densely packed in the formed aggregates compared to Ln3+-doped GdF3. This result indicates the possible self-assembly process during the synthesis (He et al. 2011).
The morphology of the BaGdF5-based nanocrystals differs from the remaining samples (Fig. 2g, g1, h, and h1). The nanocrystals exhibit a quite regular shape and an average grain size of approximately 15 nm. The presented materials are composed of monocrystals, in contrast to the polycrystalline particles in the case of GdF3:Ln3+ or NaGdF4:Ln3+.
Spectroscopic properties
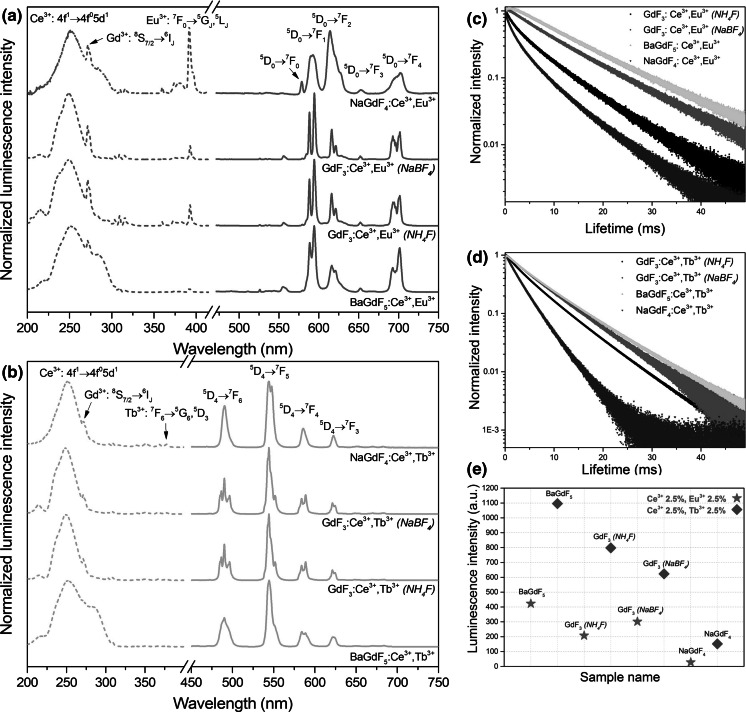
The nanomaterials obtained exhibited intensive red luminescence because of the energy transfer (ET) phenomenon that occurred between the dopant ions. In the synthesized compounds, Ce3+ ions acted as luminescence sensitizers for UV radiation (energy donors) and Gd3+ ions acted as energy mediators, which transfer energy to the appropriate Ln3+ activator ion (Eu3+ or Tb3+) (Grzyb et al. 2014). The compounds doped with Eu3+ ions exhibited red luminescence, and the compounds doped with Tb3+ ions exhibited green luminescence. The total emission intensity was dependent on the activator ion used, as well as on the host composition (see Fig. 3e). Generally, the compounds exhibiting green luminescence (doped with Tb3+ ions) had higher total emission intensity in comparison to that of the red nanophosphors (doped with Eu3+ ions). This phenomenon was related to the more efficient luminescence quenching of Eu3+ ions and the more effective energy transfer to the Tb3+ (the energy gap between Gd3+ and Tb3+ ions is smaller than in the case of Gd3+ and Eu3+ ions). In addition, the compounds based on BaGdF5 hosts exhibited the most intense emission, and the phosphors based on NaGdF4 revealed the lowest luminescence intensity. This result occurred because of the impacts of the selected crystal structure, grain size, and crystallinity.
Fig. 3.
Excitation (dashed lines) and emission (solid lines) spectra (a, b), luminescent lifetimes (c, d) and emission intensities (e) of the fluorides obtained, doped with 2.5 %Ce3+,2.5 %Eu3+ and 2.5 %Ce3+,2.5 %Tb3+. For the Eu3+-doped samples, the excitation wavelength used was λ ex = 253 nm, and the observed emission wavelength was λ em = 592 nm; for the Tb3+-doped samples, the excitation wavelength was λ ex = 253 nm, and the emission wavelength was λ em = 543 nm
The excitation and emission spectra of the nanomaterials synthesized are presented in Fig. 3a, b. The spectra were recorded at room temperature, in ambient conditions. The measured spectra were normalized to the intensity of the most intense band. Figure 3a shows the excitation (dashed lines) and emission spectra (solid lines) of Eu3+-doped fluorides. The excitation spectra were measured at λem = 592 nm (the most intense band related to the transition in Eu3+ ion). The intense and very broad band in the range of 220–300 nm was assigned to the transition in Ce3+ ion, confirming the above-mentioned ET phenomenon (ET from Ce3+ to Gd3+ and Eu3+). At 272 nm, another intense band was observed, which is related to the transition of Gd3+ ions, thereby confirming the ET from Gd3+ to Eu3+ ions. The narrow bands in the range of 300–400 nm correspond to the transitions in Eu3+ ions.
The emission spectra recorded at λex = 253 nm at the maximum of the most intense excitation band are related to the transition of the Ce3+ ion. In these spectra, six narrow bands corresponding to the transitions of Eu3+ ions were observed. These bands are typical for Eu3+ ions and result in the red–orange luminescence of the obtained materials. In addition, for NaGdF4:Ce3+, Eu3+, the intensity ratios of the recorded bands are similar for the obtained compounds, suggesting that Eu3+ ions have similar local environment in both the GdF3 and BaGdF5 fluoride hosts. The hyperfine electric dipole transition (at approximately 615 nm) is less intense than the (≈ 592 nm) magnetic dipole transition, which confirms the centrosymmetric local coordination of the Eu3+ ion environment in the synthesized nanocrystals (Tanner 2013). The Eu3+ ions occupy sites with Cs symmetry in GdF3 and C4v in BaGdF5. (Wells et al. 2002; Guo et al. 2012) However, in the case of the NaGdF4 compound, the mentioned transition is more intense than the transition, which indicates that Eu3+ ions occupy a site without inversion symmetry. Indeed, in the NaGdF4 host, Eu3+ ions occupy sites with C3h symmetry (Karbowiak et al. 2005).
The excitation spectra of Tb3+-doped compounds were measured at λem = 543 nm (dashed lines in Fig. 3b). The excitation spectra of Tb3+-doped compounds are similar to the Eu3+ spectra because of the presence of a wide and intense band related to the absorption of light by Ce3+ ions, the narrow bands related to the presence of Gd3+ ions, and a series of less intense transition bands of Tb3+ ions. However, the and transitions reveal lower intensity in comparison to the broad transition in the Ce3+ ion. This difference is due to the more effective ET from Ce3+ to Tb3+ ions.
The emission spectra were recorded at the same λex = 253 nm (solid lines in Fig. 3b). In all the spectra, the four narrow bands typical of Tb3+ ions can be observed. These bands are related to the 5D4 → 7FJ (J = 6–3) transitions of Tb3+ ions. The intensity ratios of the mentioned bands are similar in all of the obtained products because all of them correspond to magnetic dipole transitions (insensitive to site symmetry). The presence of these bands results in the green emission of the obtained nanomaterials.
The spectroscopic analysis was completed by performing measurements of the decay curves of the nanophosphors obtained, presented in Fig. 3c, d. All the values of the luminescent lifetimes range from 1.2 to 14.4 ms are presented in Table 2. The decay curves were obtained by monitoring the and transitions for the Eu3+- and Tb3+-doped fluorides, respectively. The luminescence decays varied from the single-exponential to bi-exponential, indicating the presence of a non-radiative process. Therefore, the effective lifetimes were calculated using the following equation (Lakowicz 2006):
Table 2.
Calculated luminescent lifetimes of the synthesized Eu3+ and Tb3+-doped fluorides
| Sample | τ 1 [ms] |
|---|---|
| GdF3:2.5 %Ce3+,2.5 %Eu3+ (NH 4 F) | 5.6 ± 0.1 |
| GdF3:2.5 %Ce3+,2.5 %Eu3+ (NaBF 4 ) | 11.0 ± 0.1 |
| NaGdF4:2.5 %Ce3+,2.5 %Eu3+ | 3.4 ± 0.1 |
| BaGdF5:2.5 %Ce3+,2.5 %Eu3+ | 14.4 ± 0.1 |
| GdF3:2.5 %Ce3+,2.5 %Tb3+ (NH 4 F) | 5.6 ± 0.1 |
| GdF3: 2.5 %Ce3+,2.5 %Tb3+ (NaBF 4 ) | 6.8 ± 0.1 |
| NaGdF4: 2.5 %Ce3+,2.5 %Tb3+ | 3.2 ± 0.1 |
| BaGdF5: 2.5 %Ce3+,2.5 %Tb3+ | 7.1 ± 0.1 |
The calculated lifetime values for Eu3+-doped samples are comparable with other reported values (Karbowiak et al. 2005; Grzyb et al. 2014). The quenching processes are strongly dependent not only on the host material used but also on the substrates used for the synthesis. When NaBF4 is used as the fluorine source, the obtained material exhibits a longer luminescence lifetime. Most probably, Na+ ions provide some alternations in the crystal structure, resulting in the lower quenching of Eu3+ excited states. Differences between host materials are reasonable, considering the different morphologies of the products and the local environments of the sites occupied by Eu3+ ions. Similar results were obtained in the case of Tb3+-doped samples. The use of NaBF4 as a reagent decreased the amount of quenching on the Tb3+ luminescence. Additionally, BaGdF5 appears to be a better host material for the luminescent Ln3+ ions. The luminescence lifetime is important when bioimaging applications are considered. Longer emission lifetimes give the possibility of the full separation of the signal from the emission of background.
Magnetic properties
From the point of view of magnetic properties and possible applications, it was important to show not only the solute behavior but also the characteristics of the entire colloid. Hence, the diamagnetic contribution of water was also taken into account. While changing the temperature and pressure, water undergoes many phase transitions and changes its volume (Stanley et al. 2000). Such changes could influence the magnetic behavior by differing the interparticle distances, especially in the frozen state. Nevertheless, the static picture of a colloid at room temperature is similar to the picture of particles embedded in ice matrix at low temperature. Due to the negligible interparticle magnetic interactions, it is highly probable that the particles are agglomerated in none of mentioned states and that the magnetic properties determined at different temperatures can be directly compared.
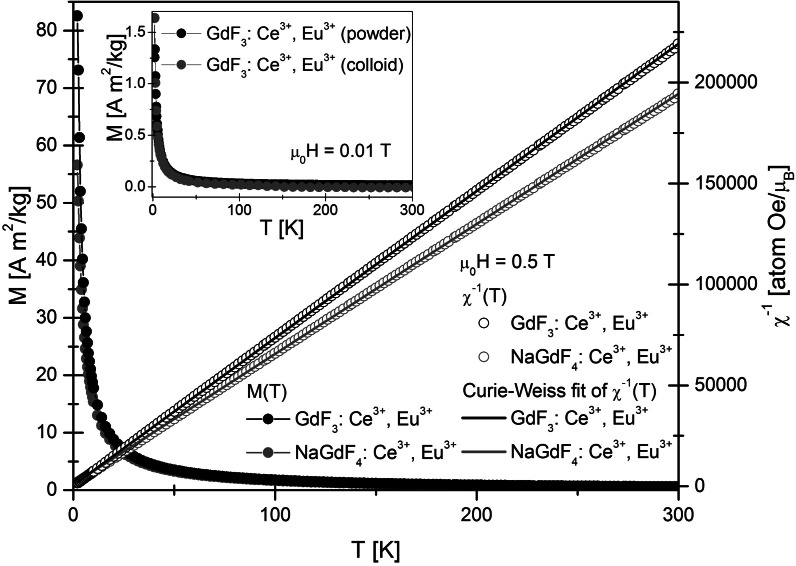
Magnetic measurements were performed for four different powder samples (GdF3:Ce3+,Eu3+, GdF3:Ce3+,Tb3+, NaGdF4:Ce3+,Eu3+, and NaGdF4:Ce3+,Tb3+) and colloid of GdF3:Ce3+,Eu3+ suspended in distilled water. Due to the higher mass susceptibility of GdF3:Ce3+, one of these powders (with Eu3+ substitution) was chosen as the colloid solute. Temperature dependences of magnetization M(T) in the zero-field cooled (ZFC) and field cooled (FC) modes were measured in the temperature range of 2–300 K. The ZFC and FC curves were found to overlap each other. The curves measured for GdF3 with different substitutions are superimposed, as well as those for both NaGdF4-based samples. This result indicates that the influence of the substitution of Eu and Tb on the magnetic properties of the samples is roughly the same. As a consequence, only the results for Ce3+- and Eu3+-substituted samples are presented in Fig. 4. The results for Tb3+ substituted powders are shown in the Supplement (Figs. S1 and S2). Both M(T) curves coincide rather well over almost the entire temperature range, and the curves are typical for paramagnets. The magnetic properties of the Gd3+, which arise from seven unpaired inner 4f electrons, are responsible for such behavior. Gd3+ bonded with fluorine ions forms compounds, where the separation between the Gd3+ ions does not allow ferromagnetic interactions. In the inset of Fig. 4, the comparison of GdF3:Ce3+,Eu3+ as powder and water dispersed colloid is shown. The magnetization of the colloid was not divided per mass of the magnetic substance, but just rescaled to match the maximum value of the powder magnetization at 2 K. Hence, the mentioned M(T) curves should not be compared in a quantitative way. Qualitatively, the paramagnetic properties of GdF3:Ce3+,Eu3+ powder are preserved with increasing interparticle distance in the GdF3:Ce3+,Eu3+ colloid. This result suggests a lack of magnetic interparticle interactions. To expand the analysis of the magnetic data, the temperature dependences of the reciprocal DC magnetic susceptibility were plotted (Fig. 4—right axis). The DC magnetic susceptibility is defined as the quotient of M and H. Both curves for GdF3:Ce3+,Eu3+ and NaGdF4:Ce3+,Eu3+ follow the Curie–Weiss law, with paramagnetic Curie temperatures Θp equal to −1 and −2 K, respectively. The effective magnetic moments μeff per magnetic ion are comparable to that of free Gd3+ (7.94 μB): 7.83 μB for GdF3:Ce3+,Eu3+ and 8.13 μB for NaGdF4:Ce3+,Eu3+. The magnetic mass susceptibilities χg at 300 K are equal to 1.19 × 10⁻⁴ emu/(gOe) and 1.12 × 10⁻⁴ emu/(gOe) for GdF3:Ce3+,Eu3+ and NaGdF4:Ce3+,Eu3+, respectively. These values are slightly higher than magnetic mass susceptibilities determined for GdF3, GdF3:Eu3+, and NaGdF4:Yb3+,Er3+ (Wong et al. 2009; Wang et al. 2010, 2012). The magnetic behavior of all the GdF3 and NaGdF4 nanoparticles described above is governed by the independent dynamics of the magnetic moment of each rare earth ion.
Fig. 4.
Temperature dependence of the magnetization M (left scale) and of the reciprocal DC magnetic susceptibility 1/χ (right scale) in GdF3:Ce3+,Eu3+, and NaGdF4:Ce3+,Eu3+. A comparison of GdF3:Ce3+,Eu3+ in powder and colloidal form is presented in the inset
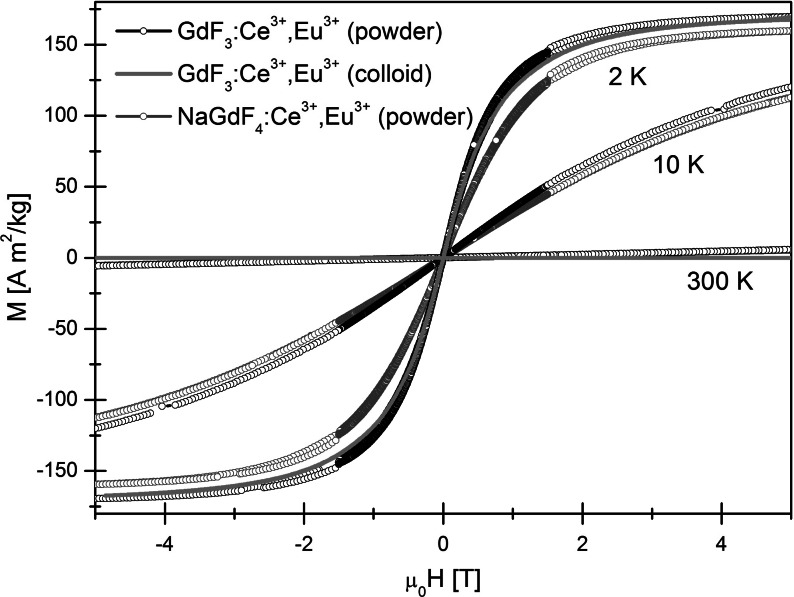
The magnetic field dependence of the magnetization for powder samples GdF3:Ce3+,Eu3+; GdF3:Ce3+,Tb3+; NaGdF4:Ce3+,Eu3+; and NaGdF4:Ce3+,Tb3+ was measured at 2, 10, and 300 K. Magnetic isotherms for the GdF3:Ce3+,Eu3+ colloid were obtained at 2 and 300 K. The M(H) curves for different substitutions (Eu3+, Tb3+) are very similar, so GdF3:Ce3+,Tb3+ and NaGdF4:Ce3+,Tb3+ are omitted below for clarity (see Fig. S2 in the Supplement). In Fig. 5, the results for GdF3:Ce3+,Eu3+ and NaGdF4:Ce3+,Eu3+ are presented. In addition, the curves measured at 2 and 300 K for GdF3:Ce3+,Eu3+ colloid are shown. There is no saturation of magnetization up to μ0H = 5 T, and the curves for both samples do not exhibit any hysteresis. At 300 K, all samples can be described as typical paramagnets. The low-temperature M(H) dependence could indicate superparamagnetism, but ZFC and FC M(T) are not observed to deviate from each other, and there is no cusp down to 2 K. This result could indicate an ultralow blocking temperature. The saturation of magnetization reaches 170 Am2/kg. There is also strong diamagnetic influence on M(H) of colloid visible at 300 K, which is connected with the water contribution. As in the case of the M(T) results, the magnetization of the colloid was rescaled to match the maximum value of the powder magnetization. Again, the results are qualitatively very similar to those of GdF3:Ce3+,Eu3+ powder and do not indicate the presence of any interparticle magnetic interactions. The magnetic behavior does not depend on the interparticle distance. Magnetization at 2 T and 300 K was determined to be equal to 2.32 and 2.17 emu/g for GdF3:Ce3+,Eu3+ and NaGdF4:Ce3+,Eu3+, respectively. The measured values are comparable to the value of 2 emu/g reported previously for GdF3 and GdF3:Eu3+, which potentially qualifies them for use as bioseparation nanoparticles (Wong et al. 2009; Wang et al. 2012).
Fig. 5.
Magnetic field dependence of the magnetization M in GdF3:Ce3+,Eu3+ powder, GdF3:Ce3+,Eu3+ colloid, and NaGdF4:Ce3+,Eu3+ powder measured at 2, 10, and 300 K
Cytotoxicity study of nanoparticles on human erythrocytes
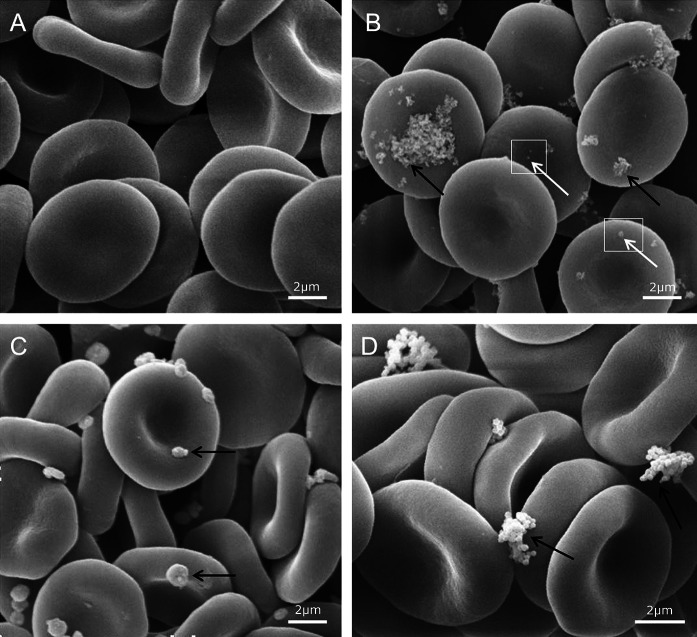
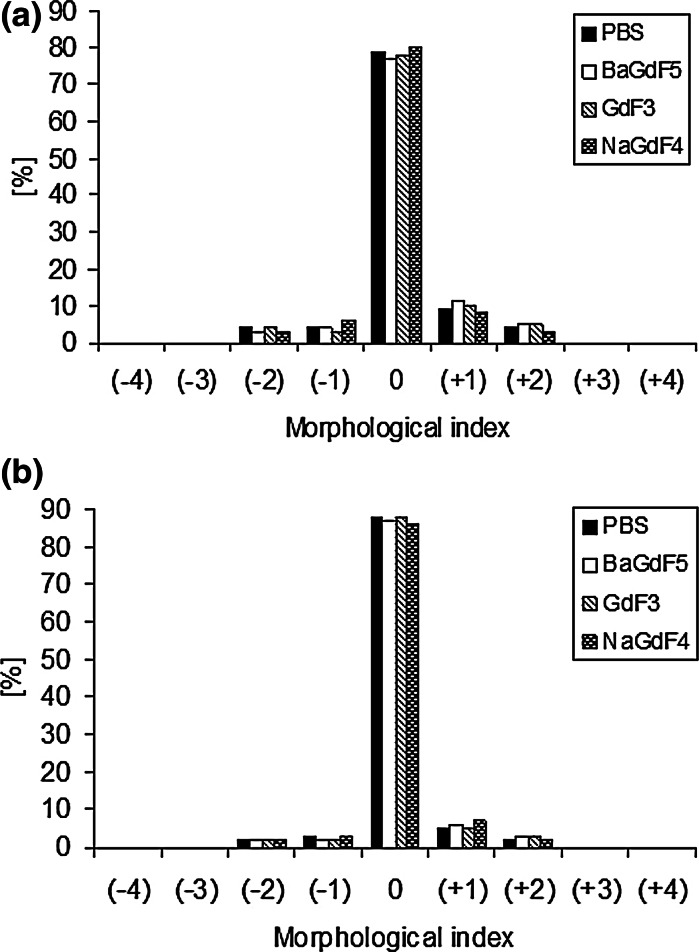
The method of cytotoxicity assessment was based on the estimation of the RBC shape changes and measurement of the efflux of hemoglobin from RBCs exposed to nanoparticles, namely, hemolysis. Figure 6 shows the effect of nanoparticles on the RBC shape, as observed using a scanning electron microscope. None of the nanoparticle types used in the study affected the discoid shape of erythrocytes in the concentrations used. Both the control RBCs (Fig. 6a) and the RBCs treated with different nanoparticles (Fig. 6b–d) were discocytes after 1 h incubation (Fig. 7a). Moreover, all nanoparticle types exhibited no effect on the RBC shape after 12 h incubation (Fig. 7b). As shown in Figs. 6b–d, single and aggregated nanoparticles were found to be attached to the RBC membrane. Single nanoparticles were confirmed to have a tendency to aggregate in the aqueous suspension before binding to the cellular membrane (Takenaka et al. 2001; Šimundić et al. 2013). Interestingly, the smaller nanoparticles exhibited higher hemolytic potency compared with their large aggregates (Kim and Shin 2014). The present studies indicate that the analyzed nanoparticles are not toxic, either as single nanocrystals or as nanocrystals aggregates. The RBCs exposed to all types of the analyzed nanoparticles in the concentration range from 0.05 mg/ml to 5 mg/ml did not undergo hemolysis. The percent of hemolysis in the presence of nanoparticles was calculated to be in the range of 0–2 %, as estimated for the control RBC.
Fig. 6.
The effect of a PBS (control), b BaGdF5: 2.5 %Ce3+, 2.5 %Tb3+ c GdF3: 2.5 %Ce3+, 2.5 %Tb3+ (NaBF4), and d NaGdF4: 2.5 %Ce3+, 2.5 %Tb3+ nanoparticles (5 mg/mL, 1 h, 37 °C) on human erythrocytes, as observed using a scanning electron microscope. The arrows indicate single (white arrows) and aggregated (black arrows) nanoparticles attached to the RBC membrane
Fig. 7.
Percent share of different shapes of human erythrocytes in the presence of nanoparticles at the concentration of 5 mg/mL after (a) 1 h and (b) 12 h incubation at 37 °C. On the abscissa, the morphological indices for the respective shape of RBC are spherostomatocytes (−4), stomatocytes II (−3), stomatocytes I (−2), discostomatocytes (−1), discocytes (0), discoechinocytes (+1), echinocytes (+2), spheroechinocytes (+3), and spherocytes (+4)
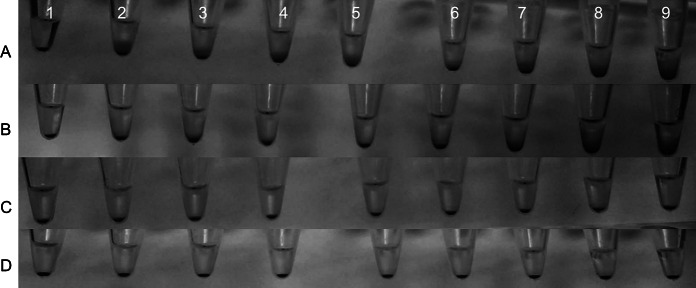
The RBCs settled at the same sedimentation rate as the control erythrocytes are at 0.5 and 0.05 mg/mL nanoparticle concentrations (Fig. 8c–d). At the higher concentrations, namely, 1 mg/mL and 5 mg/mL, slight disturbances of the RBC sedimentation were observed (Fig. 8a, b). According to present data, the sedimentation disturbance could be induced by two factors: the colloidal nature of the nanoparticle solutions or by the nanoparticles, especially their aggregates, attached to the RBC membrane. Although the first factor seems to be more probable, the synergic action of both could not be excluded.
Fig. 8.
The sedimentation rate of RBSs in the presence of nanoparticles after 1 h at 37 °C. (a) 5 mg/mL, (b) 1 mg/mL, (c) 0.5 mg/mL, and (d) 0.05 mg/mL. (1) PBS (control), (2) NaGdF4:2.5 %Ce3+,2.5 %Eu3+, (3) NaGdF4:2.5 %Ce3+,2.5 %Tb3+, (4) GdF3:2.5 %Ce3+,2.5 %Eu3+, (5) GdF3:2.5 %Ce3+,2.5 %Tb3+, (6) GdF3:2.5 %Ce3+,2.5 %Eu3+ (NaBF4), (7) GdF3:2.5 %Ce3+,2.5 %Tb3+ (NaBF4), (8) BaGdF5:2.5 %Ce3+,2.5 %Eu3+, and (9) BaGdF5:2.5 %Ce3+, 2.5 %Tb3+
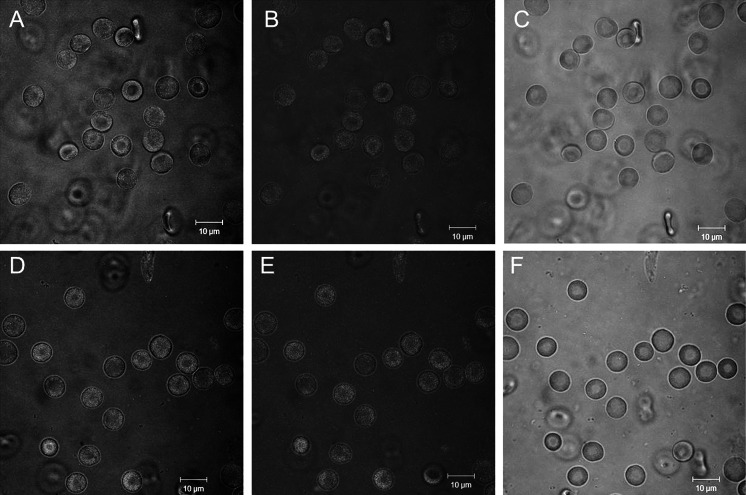
We applied fluorescence microscopic techniques to visualize the nanoparticles attached to the RBC membrane. Unfortunately, the fluorescence signals of the RBCs treated with nanoparticles (Fig. 9d–f) and the RBCs incubated without (Fig. 9a–c) were found to be similar. Therefore, the precise detection of RBC membrane-bound nanoparticles using fluorescence microscopy techniques was not possible.
Fig. 9.
a, b, c The effect of PBS and d, e, f GdF3: 2.5 %Ce3+,2.5 %Tb3+ (NaBF4) at 5 mg/mL (1 h, 37 °C) on human erythrocytes, as observed using a fluorescence microscope. (a and d) argon laser wavelength of 488 and LP505 nm, (b and e) argon laser wavelength of 488 nm and BP 565–615 nm, (c and f) argon laser wavelength of 458 nm and BP 480–520 nm. No noticeable changes were observed between the autofluorescence of the control erythrocytes (a, b, c) and the erythrocytes exposed to nanoparticles (d, e, f). Scale bars indicate 10 µm
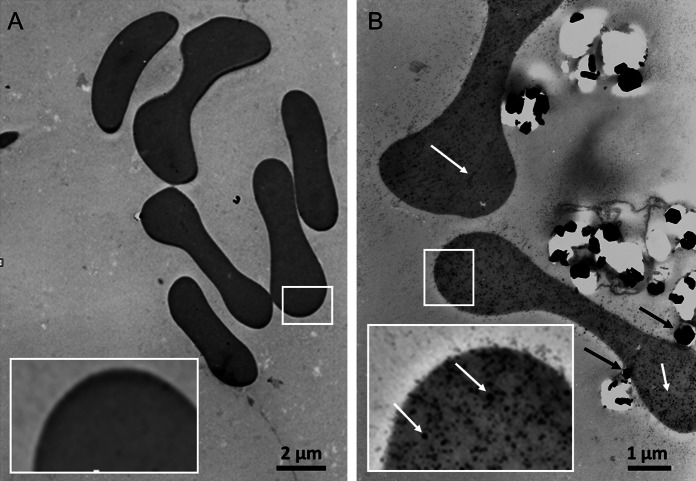
Using a transmission electron microscope (TEM), we were able to observe RBC membrane-bound aggregates of nano-gadoparticles as well as single (non-aggregated) nano-gadoparticles inside of certain RBCs (Fig. 10b). Because RBCs are non-phagocytic cells, our results confirm that nano-gadoparticles can cross their cell membrane barriers. Although the internalization of nanoparticles was observed within human (Rothen-Rutishauser et al. 2006) and mouse erythrocytes, (Soler et al. 2007; Nemmar et al. 2014) the particular mechanism of their entering into these types of cells is still unknown.
Fig. 10.
a The effect of PBS and b GdF3:2.5 %Ce3+,2.5 %Tb3+ (5 mg/mL, 1 h, 37 °C) on human erythrocytes, as observed using a transmission electron microscope. The agglomerates of nanoparticles attached to the erythrocytes membrane (b, black arrows) and the single nanoparticles inside of erythrocytes (b, white arrows) were observed
Taken together, RBCs exposed to the different concentrations of nanoparticles did not change their shape (Figs. 6, 7) and did not undergo hemolysis, as was the case with the control cells. These results indicate that binding of nanoparticles to the RBC membrane, as observed by SEM and TEM, does not affect the RBC membrane structure and its permeability. Data obtained in our studies demonstrated the lack of toxicity of the novel synthesized nanoparticles on the RBC membrane molecular functionality. However, the binding of nanoparticles to the RBCs does not preclude the presence of some toxic effects, both on the RBC functions as well as their rheology properties.
Conclusions
A group of nanocrystalline fluorides with multifunctionality in their properties of luminescence and magnetism were synthesized and thoroughly analyzed. The unusual properties observed were consequences of the magnetism of the Gd3+-containing matrices and the Ce3+, Eu3+ and Tb3+ doping, which resulted in the intense luminescence. The hydrothermal method of their synthesis was developed and optimized to obtain single-phase products. The morphology of the products obtained was strongly dependent on the host compound used. We observed formation of ring-like structures for GdF3-based materials and nanospheres with a diameter of approximately 15 nm for BaGdF5-based particles or large spheres with an average size of 150 nm for those based on the NaGdF4 compound.
All samples prepared were found to be highly excitable via UV radiation, resulting in green (Tb3+) or red (Eu3+) luminescence. The highest luminescence was observed for the BaGdF5:Ce3+,Tb3+ sample. Additionally, GdF3:Ce3+,Tb3+ samples exhibited intense emission. The luminescence of Eu3+-doped materials was lower than those of Tb3+-activated materials, and the highest Eu3+ emission was recorded for the BaGdF5:Ce3+,Eu3+ sample.
In conclusion, the investigated nanoparticles exhibit paramagnetism, as well as probable evidence of superparamagnetic behavior at low temperatures. Intraparticle and interparticle interactions are negligible due to the insufficient overlapping of the 4f orbitals of the Gd3+ ions, and no signs of conduction-electron mediated indirect coupling. Doped lanthanide ions (Ce3+, Eu3+ and Tb3+), which are required from the point of view of luminescent properties, do not significantly influence or even slightly improve the magnetic properties compared to GdF3 (Wang et al. 2012). Gd3+ ions are decisive for the changes of magnetic behavior, e.g., in comparison with previously studied CeF3 or CeF3: 20 %Tb3+ (Grzyb et al.). Most importantly, nanoparticles preserve their magnetic characteristics when in the form of a suspension in distilled water, which is promising for the possible biological applications.
The cytotoxicity studies against the human erythrocytes indicate that the synthesized nanoparticles are potentially non-toxic, as they did not cause the RBC shape changes nor did they alter their membrane structure and permeabilization. However, binding of nanoparticles to the RBC membrane observed in this study suggests that they may modify the RBC function and properties. Therefore, our findings are crucial for the further applications of BaGdF5-, GdF3-, or NaGdF4-based materials, which are frequently investigated for use in the optoelectronics, phosphors, or biomedical areas.
Electronic supplementary material
Acknowledgments
Funding for this research was provided by the Polish National Science Center (grants DEC-2011/03/D/ST5/05701 and DEC-2012/06/M/ST5/00325). We are grateful to MSc Mariusz Węcławiak, PhD student from the Adam Mickiewicz University, Poznań, Poland for his help in the synthesis of the BaGdF5-based samples and Dr Jozef Kováč from the Institute of Experimental Physics, Kosice, Slovakia for measurements of the magnetic properties of nanoparticles in the colloidal form. M.R. is a recipient of the scholarship supported by the Foundation for Polish Science (FNP).
References
- Ayyub P, Palkar V, Chattopadhyay S, Multani M. Effect of crystal size reduction on lattice symmetry and cooperative properties. Phys Rev B. 1995;51:6135–6138. doi: 10.1103/PhysRevB.51.6135. [DOI] [PubMed] [Google Scholar]
- Bedekar V, Dutta DPD, Mohapatra M, et al. Rare-earth doped gadolinia based phosphors for potential multicolor and white light emitting deep UV LEDs. Nanotechnology. 2009;125707:125707–125714. doi: 10.1088/0957-4484/20/12/125707. [DOI] [PubMed] [Google Scholar]
- Bonarska-Kujawa D, Kleszczyńska H, Przestalski S. The location of organotins within the erythrocyte membrane in relation to their toxicity. Ecotoxicol Environ Saf. 2012;78:232–238. doi: 10.1016/j.ecoenv.2011.11.027. [DOI] [PubMed] [Google Scholar]
- Cabella C, Crich SG, Corpillo D, et al. Cellular labeling with Gd(III) chelates: only high thermodynamic stabilities prevent the cells acting as “sponges” of Gd3+ ions. Contrast Media Mol Imaging. 2006;1:23–29. doi: 10.1002/cmmi.88. [DOI] [PubMed] [Google Scholar]
- Gnach A, Bednarkiewicz A. Lanthanide-doped up-converting nanoparticles: merits and challenges. Nano Today. 2012;7:532–563. doi: 10.1016/j.nantod.2012.10.006. [DOI] [Google Scholar]
- Grzyb T, Gruszeczka A, Wiglusz RJ, et al. Multifunctionality of GdPO4:Yb3+, Tb3+ nanocrystals—luminescence and magnetic behaviour. J Mater Chem. 2012;22:22989–22997. doi: 10.1039/c2jm34863b. [DOI] [Google Scholar]
- Grzyb T, Runowski M, Dąbrowska K, et al. Structural, spectroscopic and cytotoxicity studies of TbF3@CeF3 and TbF3@CeF3@SiO2 nanocrystals. J Nanopart Res. 2013;15:1958. doi: 10.1007/s11051-013-1958-x. [DOI] [PMC free article] [PubMed] [Google Scholar]
- Grzyb T, Runowski M, Szczeszak A, Lis S. Structural, morphological and spectroscopic properties of Eu3+-doped rare earth fluorides synthesized by the hydrothermalmethod. J Solid State Chem. 2013;200:76–83. doi: 10.1016/j.jssc.2013.01.012. [DOI] [Google Scholar]
- Grzyb T, Runowski M, Lis S. Facile synthesis, structural and spectroscopic properties of GdF3:Ce3+, Ln3+ (Ln3+=Sm3+, Eu3+, Tb3+, Dy3+) nanocrystals with bright multicolor luminescence. J Lumin. 2014;154:479–486. doi: 10.1016/j.jlumin.2014.05.020. [DOI] [Google Scholar]
- Guo L, Wang YY, Zhang J, Dong P. Crystal structure and up- and down-conversion properties of Yb3+, Ho3+ codoped BaGdF5 solid-solution with different morphologies. Cryst Eng Comm. 2012;14:3131. doi: 10.1039/c2ce06616e. [DOI] [Google Scholar]
- Gupta AK, Gupta M. Synthesis and surface engineering of iron oxide nanoparticles for biomedical applications. Biomaterials. 2005;26:3995–4021. doi: 10.1016/j.biomaterials.2004.10.012. [DOI] [PubMed] [Google Scholar]
- He F, Yang P, Wang D, et al. Self-assembled β-NaGdF4 microcrystals: hydrothermal synthesis, morphology evolution, and luminescence properties. Inorg Chem. 2011;50:4116–4124. doi: 10.1021/ic200155q. [DOI] [PubMed] [Google Scholar]
- Hinklin TR, Rand SC, Laine RM. Transparent, polycrystalline upconverting nanoceramics: towards 3-D Displays. Adv Mater. 2008;20:1270–1273. doi: 10.1002/adma.200701235. [DOI] [Google Scholar]
- Jasiewicz B, Mrówczyńska L, Malczewska-Jaskóła K. Synthesis and haemolytic activity of novel salts made of nicotine alkaloids and bile acids. Bioorg Med Chem Lett. 2014;24:1104–1107. doi: 10.1016/j.bmcl.2014.01.005. [DOI] [PubMed] [Google Scholar]
- Karbowiak M, Mech A, Bednarkiewicz A, et al. Comparison of different NaGdF4: Eu3+ synthesis routes and their influence on its structural and luminescent properties. J Phys Chem Solids. 2005;66:1008–1019. doi: 10.1016/j.jpcs.2005.01.002. [DOI] [Google Scholar]
- Kim MJ, Shin S. Toxic effects of silver nanoparticles and nanowires on erythrocyte rheology. Food Chem Toxicol. 2014;67:80–86. doi: 10.1016/j.fct.2014.02.006. [DOI] [PubMed] [Google Scholar]
- Lakowicz JR. Principles of fluorescence spectroscopy, third. Baltimore: Springer; 2006. [Google Scholar]
- Leycuras C, Le Gall H, Guillot M, Marchand A. J Appl Phys. 1984;55:2161–2163. doi: 10.1063/1.333596. [DOI] [Google Scholar]
- Li C, Ma P, Yang P, et al. Fine structural and morphological control of rare earth fluorides REF3 (RE = La–Lu, Y) nano/microcrystals: microwave-assisted ionic liquid synthesis, magnetic and luminescent properties. CrystEngComm. 2011;13:1003. doi: 10.1039/C0CE00186D. [DOI] [Google Scholar]
- Li Z, Sun Q, Zhu Y, et al. Ultra-small fluorescent inorganic nanoparticles for bioimaging. J Mater Chem B. 2014;2:2793. doi: 10.1039/c3tb21760d. [DOI] [PubMed] [Google Scholar]
- Lin M, Zhao Y, Wang S, et al. Recent advances in synthesis and surface modification of lanthanide-doped upconversion nanoparticles for biomedical applications. Biotechnol Adv. 2012;30:1551–1561. doi: 10.1016/j.biotechadv.2012.04.009. [DOI] [PubMed] [Google Scholar]
- Liong M, Lu J, Kovochich M, et al. Multifunctional inorganic nanoparticles for imaging, targeting, and drug delivery. ACS Nano. 2008;2:889–896. doi: 10.1021/nn800072t. [DOI] [PMC free article] [PubMed] [Google Scholar]
- Lutterotti L, Bortolotti M. Object oriented programming and fast computation techniques in Maud, a program for powder diffraction analysis written in java. Compcomm Newsl. 2003;1:43–50. [Google Scholar]
- Modo M, Hoehn M, Bulte JWM. Cellular MR imaging. Mol Imaging. 2005;4:143–164. doi: 10.1162/15353500200505145. [DOI] [PubMed] [Google Scholar]
- Morcos SK, Thomsen HS (2008) Nephrogenic systemic fibrosis: more questions and some answers. Nephron Clin Pract 110:c24–31; discussion c32. doi: 10.1159/000151228 [DOI] [PubMed]
- Mrówczyńska L, Hägerstrand H. Platelet-activating factor interaction with the human erythrocyte membrane. J Biochem Mol Toxicol. 2009;23:345–348. doi: 10.1002/jbt.20297. [DOI] [PubMed] [Google Scholar]
- Naccache R, Vetrone F, Mahalingam V, et al. Controlled synthesis and water dispersibility of hexagonal phase NaGdF4:Ho3+/Yb3+Nanoparticles. Chem Mater. 2009;21:717–723. doi: 10.1021/cm803151y. [DOI] [Google Scholar]
- Nemmar A, Beegam S, Yuvaraju P, et al. Interaction of amorphous silica nanoparticles with erythrocytes in vitro : role of oxidative stress. Cell Physiol Biochem. 2014;34:255–265. doi: 10.1159/000362996. [DOI] [PubMed] [Google Scholar]
- Park YI, Kim HM, Kim JH, et al. Theranostic Probe based on lanthanide-doped nanoparticles for simultaneous in vivo dual-modal imaging and photodynamic therapy. Adv Mater. 2012;24:5755–5761. doi: 10.1002/adma.201202433. [DOI] [PubMed] [Google Scholar]
- Perazella M. Gadolinium-contrast toxicity in patients with kidney disease: nephrotoxicity and nephrogenic systemic fibrosis. Curr Drug Saf. 2008;3:67–75. doi: 10.2174/157488608783333989. [DOI] [PubMed] [Google Scholar]
- Rapaport A, Milliez J, Bass M, et al. Review of the properties of Up-conversion phosphors for new emissive displays. IEEE/OSA J Disp Technol. 2006;2:68–78. doi: 10.1109/JDT.2005.863781. [DOI] [Google Scholar]
- Rothen-Rutishauser BM, Schürch S, Haenni B, et al. Interaction of fine particles and nanoparticles with red blood cells visualized with advanced microscopic techniques. Environ Sci Technol. 2006;40:4353–4359. doi: 10.1021/es0522635. [DOI] [PubMed] [Google Scholar]
- Runowski M, Ekner-Grzyb A, Mrówczyńska L, et al. Synthesis and organic surface modification of luminescent, lanthanide-doped core/shell nanomaterials (LnF3@SiO2@NH2@organic acid) for potential bioapplications: spectroscopic, structural, and in vitro cytotoxicity evaluation. Langmuir. 2014;30:9533–9543. doi: 10.1021/la501107a. [DOI] [PubMed] [Google Scholar]
- Safronikhin A, Ehrlich H, Shcherba T, et al. Formation of complexes on the surface of nanosized europium fluoride. Colloid Surf A. 2011;377:367–373. doi: 10.1016/j.colsurfa.2011.01.034. [DOI] [Google Scholar]
- Selvan ST, Tan TTY, Yi DK, Jana NR. Functional and multifunctional nanoparticles for bioimaging and biosensing. Langmuir. 2009;26:11631–11641. doi: 10.1021/la903512m. [DOI] [PubMed] [Google Scholar]
- Shanta Singh N, Kulkarni H, Pradhan L, Bahadur D. A multifunctional biphasic suspension of mesoporous silica encapsulated with YVO4:Eu3+ and Fe3O4 nanoparticles: synergistic effect towards cancer therapy and imaging. Nanotechnology. 2013;24:065101. doi: 10.1088/0957-4484/24/6/065101. [DOI] [PubMed] [Google Scholar]
- Sharma P, Brown S, Walter G, et al. Nanoparticles for bioimaging. Adv Colloid Interfac. 2006;123–126:471–485. doi: 10.1016/j.cis.2006.05.026. [DOI] [PubMed] [Google Scholar]
- Siega P, Wuerges J, Arena F, Gianolio E. Release of toxic Gd3+ ions to tumour cells by vitamin B12 Bioconjugates. Chemistry. 2009 doi: 10.1002/chem.200802680. [DOI] [PubMed] [Google Scholar]
- Šimundić M, Drašler B, Šuštar V, et al. Effect of engineered TiO2 and ZnO nanoparticles on erythrocytes, platelet-rich plasma and giant unilamelar phospholipid vesicles. BMC Vet Res. 2013;9:7. doi: 10.1186/1746-6148-9-7. [DOI] [PMC free article] [PubMed] [Google Scholar]
- Soler MAG, Báo SN, Alcântara GB, et al. Interaction of erythrocytes with magnetic nanoparticles. J Nanosci Nanotechnol. 2007;7:1069–1071. doi: 10.1166/jnn.2007.423. [DOI] [PubMed] [Google Scholar]
- Stanley HE, Buldyrev SV, Canpolat M, et al. The puzzling behavior of water at very low temperature. Phys Chem Chem Phys. 2000;2:1551–1558. doi: 10.1039/b000058m. [DOI] [Google Scholar]
- Takenaka S, Karg E, Roth C, et al. Pulmonary and systemic distribution of inhaled ultrafine silver particles in rats. Environ Health Perspect. 2001;109(Suppl 4):547–551. doi: 10.1289/ehp.01109s4547. [DOI] [PMC free article] [PubMed] [Google Scholar]
- Tallant DR, Seager CH, Simpson RL. Energy transfer and relaxation in europium-activated Y2O3 after excitation by ultraviolet photons. J Appl Phys. 2002;91:4053–4064. doi: 10.1063/1.1452770. [DOI] [Google Scholar]
- Tanner PA. Some misconceptions concerning the electronic spectra of tri-positive europium and cerium. Chem Soc Rev. 2013;42:5090–5101. doi: 10.1039/c3cs60033e. [DOI] [PubMed] [Google Scholar]
- Tu D, Liu Y, Zhu H, Chen X. Optical/magnetic multimodal bioprobes based on lanthanide-doped inorganic nanocrystals. Chem Eur J. 2013;19:5516–5527. doi: 10.1002/chem.201204640. [DOI] [PubMed] [Google Scholar]
- Vuu K, Xie J, McDonald MA, et al. Gadolinium-rhodamine nanoparticles for cell labeling and tracking via magnetic resonance and optical imaging. Bioconjug Chem. 2005;16:995–999. doi: 10.1021/bc050085z. [DOI] [PubMed] [Google Scholar]
- Wang X, Zhuang J, Peng Q, Li Y. A general strategy for nanocrystal synthesis. Nature. 2005;437:121–124. doi: 10.1038/nature03968. [DOI] [PubMed] [Google Scholar]
- Wang M, Huang Q-L, Hong J-M, et al. Selective synthesis and characterization of nanocrystalline EuF3 with orthorhombic and hexagonal structures. Cryst Growth Des. 2006;6:1972–1974. doi: 10.1021/cg060116s. [DOI] [Google Scholar]
- Wang Z-L, Hao JH, Chan HLW. Down- and up-conversion photoluminescence, cathodoluminescence and paramagnetic properties of NaGdF4:Yb3+, Er3+ submicron disks assembled from primary nanocrystals. J Mater Chem. 2010;20:3178. doi: 10.1039/b924448d. [DOI] [Google Scholar]
- Wang S, Su S, Song S, et al. Raisin-like rare earth doped gadolinium fluoride nanocrystals: microwave synthesis and magnetic and upconversion luminescent properties. CrystEngComm. 2012;14:4266. doi: 10.1039/c2ce25208b. [DOI] [Google Scholar]
- Wang S, Feng J, Song S, Zhang H. Rare earth fluorides upconversion nanophosphors: from synthesis to applications in bioimaging. CrystEngComm. 2013;15:7142. doi: 10.1039/c3ce40679b. [DOI] [Google Scholar]
- Wells JR, Dean T, Reeves RJ. Site selective spectroscopy of the C3v symmetry centre in Er3+ doped BaF2. J Lumin. 2002;96:239–248. doi: 10.1016/S0022-2313(01)00230-7. [DOI] [Google Scholar]
- Wong H-T, Chan HLW, Hao JH. Magnetic and luminescent properties of multifunctional GdF3:Eu3+ nanoparticles. Appl Phys Lett. 2009;95:022512. doi: 10.1063/1.3177194. [DOI] [Google Scholar]
- Yang D, Li C, Li G, et al. Colloidal synthesis and remarkable enhancement of the upconversion luminescence of BaGdF5:Yb3+/Er3+ nanoparticles by active-shell modification. J Mater Chem. 2011;21:5923. doi: 10.1039/c0jm04179c. [DOI] [Google Scholar]
- Yoshimura M, Byrappa K. Hydrothermal processing of materials: past, present and future. J Mater Sci. 2007;43:2085–2103. doi: 10.1007/s10853-007-1853-x. [DOI] [Google Scholar]
- Zhong H, Wang M, Yang H, et al. Controlled synthesis and characterization of EuF3 with ring-like morphology. Mater Sci Eng, B. 2009;156:62–67. doi: 10.1016/j.mseb.2008.11.026. [DOI] [Google Scholar]
Associated Data
This section collects any data citations, data availability statements, or supplementary materials included in this article.


