Abstract
Development of nanometer-sized magnetic particles exhibiting a large coercive field (Hc) is in high demand for densification of magnetic recording. Herein, we report a single-nanosize (i.e., less than ten nanometers across) hard magnetic ferrite. This magnetic ferrite is composed of ε-Fe2O3, with a sufficiently high Hc value for magnetic recording systems and a remarkably high magnetic anisotropy constant of 7.7 × 10⁶ erg cm−3. For example, 8.2-nm nanoparticles have an Hc value of 5.2 kOe at room temperature. A colloidal solution of these nanoparticles possesses a light orange color due to a wide band gap of 2.9 eV (430 nm), indicating a possibility of transparent magnetic pigments. Additionally, we have observed magnetization-induced second harmonic generation (MSHG). The nonlinear optical-magnetoelectric effect of the present polar magnetic nanocrystal was quite strong. These findings have been demonstrated in a simple iron oxide, which is highly significant from the viewpoints of economic cost and mass production.
Magnetic materials have been used for a whole host of applications: magnetic recording media, permanent magnets, electromagnetic wave absorbers, magnetic fluid, drug delivery, to name a few1,2,3,4,5,6,7,8. From the viewpoint of densification of magnetic recording media, development of a nanometer-sized magnetic particle (less than 10 nm in diameter) with a large coercive field (Hc) is the logical next step. In magnetic recording systems9,10,11, such as hard drives or magnetic recording tapes, the required Hc value for writing and reading is ca. 3 kOe. A larger Hc is necessary for future magnetic recording systems, such as bit-patterned media or heat-assisted magnetic recording. Materials exhibiting multiferroic properties are drawing increasing attention12,13,14,15,16,17 as electrically assisted magnetic recording media13. In addition, development of an optically transparent magnet is highly desirable for new applications, such as transparent electromagnetic wave-absorbing windows or magnetic color pigments for printers. In light of the above requirements, epsilon iron oxide ε-Fe2O3 is an attractive material because it exhibits a large Hc value at room temperature7,18,19,20,21,22,23,24,25. In the present work, we develop a synthetic method for the preparation of single-nanosize ε-Fe2O3 spherical particles. The resulting nanomagnets satisfy the required Hc value for magnetic recording applications mentioned above. In addition, they exhibit magnetization-induced second harmonic generation (MSHG), with a strong magnetoelectric (ME) effect. The color of this series is very light, and the absorption coefficient is small in the visible region. In this work, we report the synthesis procedure, the crystal structure, the particle sizes, and magnetic properties of nanometer-size ε-Fe2O3 nanoparticles. Furthermore, we present first-principles calculations for the optical band gap, the spontaneous electric polarization of the polar crystal, and the nonlinear optical-ME effect.
Results and Discussion
Nanometer-size ε-Fe2O3 was prepared from a precursor, in which ferrihydrite Fe10O14(OH)2 nanoparticles were embedded in SiO2 matrix. The details of the synthetic procedure are described in the Methods section. In this report, we describe 18 samples sintered at a large range of temperatures: 250 °C (S-250), 500 °C (S-500), 731 °C (S-731), 902 °C (S-902), 924 °C (S-924), 951 °C (S-951), 979 °C (S-979), 1002 °C (S-1002), 1020 °C (S-1020), 1032 °C (S-1032), 1044 °C (S-1044), 1061 °C (S-1061), 1063 °C (S-1063), 1104 °C (S-1104), 1142 °C (S-1142), 1198 °C (S-1198), 1213 °C (S-1213), and 1295 °C (S-1295).
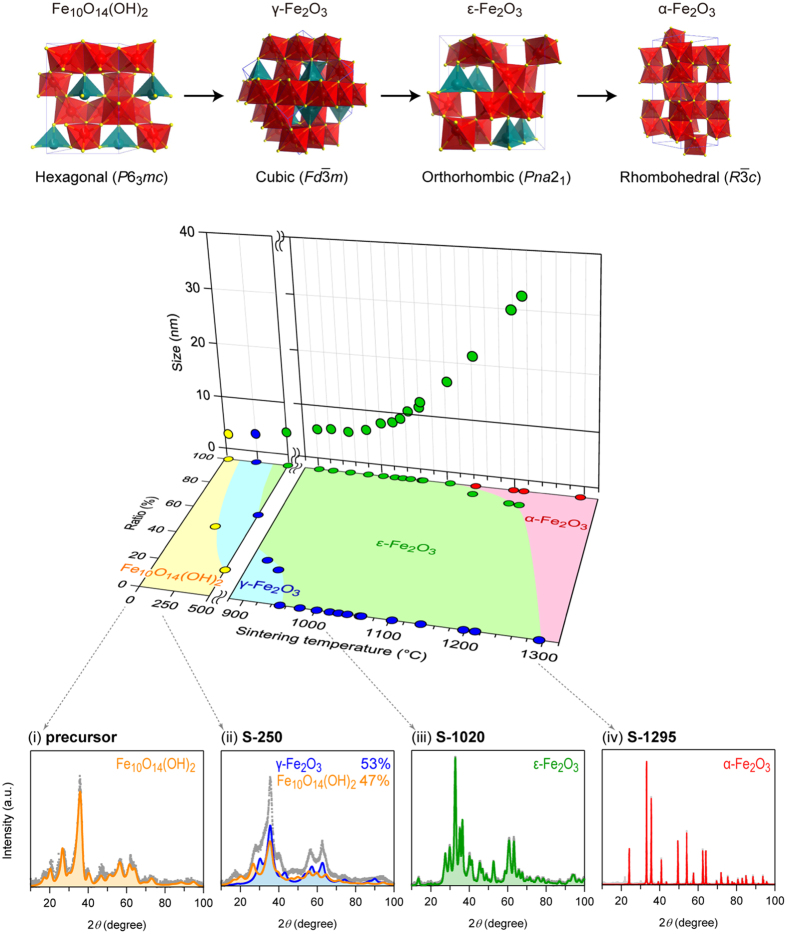
X-ray powder diffraction (XRPD) patterns of the sintered samples and the precursor are shown in Fig. 1 and Supplementary Fig. S1. The XRPD pattern of the precursor shows Fe10O14(OH)2 having hexagonal crystal structure (space group P63mc, a = 6.04 Å, c = 8.75 Å). With increasing sintering temperature, Fe10O14(OH)2 begins to transform into γ-Fe2O3 (cubic, Fd3–m, a = 8.37 Å) around 250 °C. As the sintering temperature is raised, γ-Fe2O3 transforms into ε-Fe2O3 around 500 °C. Above 951 °C, the XRPD patterns for S-951–S-1104 show a pure ε-Fe2O3 phase (orthorhombic, Pna21, a = 5.09 Å, b = 8.80 Å, and c = 9.48 Å for S-1020) (Supplementary Table S1). Above 1142 °C, a small amount of α-Fe2O3 is detected (rhombohedral, R3–c, a = 5.04 Å, and c = 13.75 Å for S-1295). In this synthetic method, pure ε-Fe2O3 is obtained in a surprisingly wide sintering temperature range. The range is wider than those of the previously reported methods, including a combination of reverse-micelle and sol–gel methods20 and impregnation method using mesoporous silica7.
Figure 1. Phase transformation of the crystal structure in the sintering process.
(Top) Crystal structures of Fe10O14(OH)2, γ-Fe2O3, ε-Fe2O3, and α-Fe2O3. Red and blue polyhedra in the crystal structure indicate the octahedral and tetrahedral Fe sites, respectively. Yellow balls represent oxygen atoms. (Middle) Sintering temperature dependence of the particle size (vertical panel) and phase diagram showing the phase ratio versus sintering temperature (horizontal panel). (Bottom) XRPD patterns of (i) the precursor Fe10O14(OH)2, (ii) S-250, (iii) S-1020, and (iv) S-1295. The silica matrix in the precursor and the remaining silica in S-1295 are extracted. Grey dots, and the orange, blue, green, and red areas indicate the observed pattern and the calculated patterns of Fe10O14(OH)2, γ-Fe2O3, ε-Fe2O3, and α-Fe2O3, respectively.
The transmission electron microscopy (TEM) image of the precursor shows that the particle size (d) of Fe10O14(OH)2 nanoparticles is 2.8 ± 0.5 nm. In the sintering temperature range up to 700 °C, which is the region of the Fe10O14(OH)2 → γ-Fe2O3 transition, the d value is almost constant around 3–4 nm (Fig. 1, middle). As the sintering temperature increases further, from 750 °C to 924 °C, which is the region of the γ-Fe2O3 → ε-Fe2O3 transition, the d value gradually increases, and pure ε-Fe2O3 is formed. The d values of the ε-Fe2O3 samples are as follows: 5.6 ± 1.6 nm (S-951), 6.3 ± 1.7 nm (S-979), 7.8 ± 2.7 nm (S-1002), 8.2 ± 2.7 nm (S-1020), 9.0 ± 2.4 nm (S-1032), 10.5 ± 3.3 nm (S-1044), 11.4 ± 3.8 nm (S-1061), 12.4 ± 3.7 nm (S-1063), and 16.5 ± 4.7 nm (S-1104). The TEM images of all of the samples are shown in Supplementary Fig. S2.
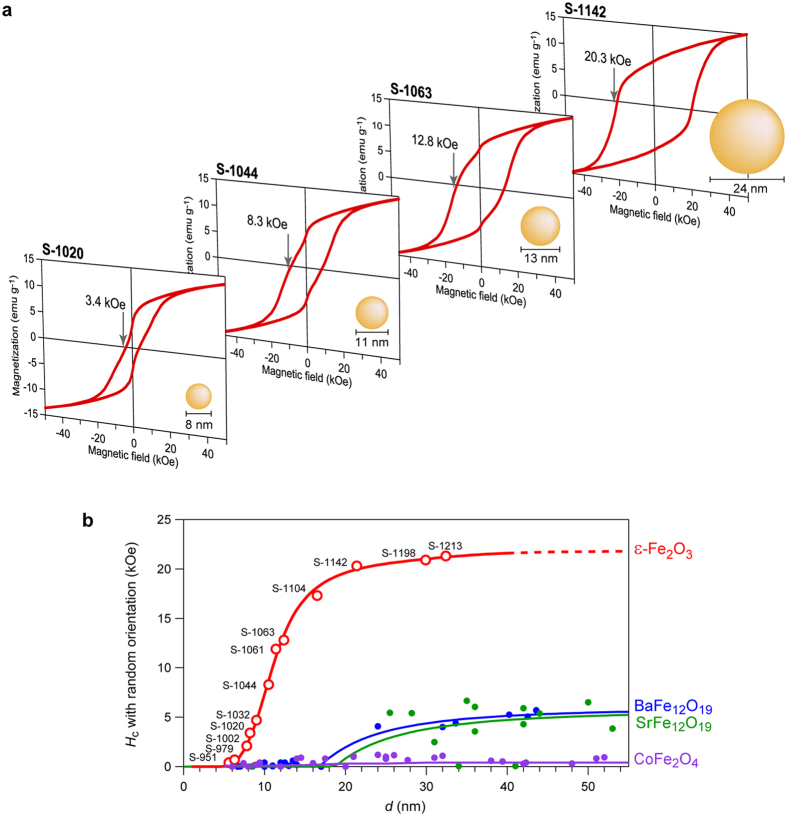
The magnetic hysteresis loops of ε-Fe2O3 for S-951–S-1198 with random orientation at 300 K show that the Hc values are 0.4 kOe (S-951), 0.7 kOe (S-979), 2.1 kOe (S-1002), 3.4 kOe (S-1020), 4.7 kOe (S-1032), 8.3 kOe (S-1044), 11.9 kOe (S-1061), 12.8 kOe (S-1063), 17.3 kOe (S-1104), 20.3 kOe (S-1142), and 20.9 kOe (S-1198) (Fig. 2a, Supplementary Fig. S3). The magnetization versus temperature plots for S-951–S-1104 are shown in Supplementary Fig. S4. As shown in the Hc versus d plot of Fig. 2b, the Hc value decreases towards zero with decreasing d. In Fig. 2b, the particle size dependences of the Hc values of BaFe12O19, SrFe12O19, and CoFe2O4 reported so far are also plotted for reference (Supplementary Fig. S5).
Figure 2. Particle size dependence of the magnetic properties.
(a) Magnetic hysteresis loops of S-1020, S-1044, S-1063, and S-1142 measured at 300 K with an illustration of the average particle size. (b) Hc value at 300 K with random orientation versus d plot. The red line is a guide for the eye, which was drawn based on the d dependence equation of Hc, taking into account the random orientation and particle size distribution. The dp (superparamagnetic limit) value was calculated to be 7.5 nm. The Hc versus d plots at room temperature of BaFe12O19 (blue), SrFe12O19 (green), and CoFe2O4 (purple) are also shown.
Let us consider the d dependence of the Hc value. The synthesized ε-Fe2O3 nanoparticles have a size distribution. A theoretical equation for superparamagnetic limit (dp) of nanoparticles with random orientation considering a size distribution was derived by H. Pfeiffer26 (see Methods section). Based on this equation, the Hc versus d plot was fitted, and the dp value was estimated to be 7.5 nm (Fig. 2b).
In addition, we prepared oriented nanocrystal thin film, which was obtained by dispersing the nanocrystals in a vehicle matrix under external magnetic field. The XRPD pattern of the S-1020 shows that the nanocrystals oriented along the crystallographic a-axis, perpendicular to the film (Fig. 3a). The magnetic hysteresis loop at 300 K shows that the ε-Fe2O3 nanocrystal with the size of 8.2 nm exhibits a large coercive field of 5.2 kOe (Fig. 3b, Supplementary Fig. S6), which meets the Hc value criterion for magnetic memory media. The magnetic measurement of the oriented S-1142 film was also conducted. The Hc value of the magnetic hysteresis loop and the natural resonance frequency of 182 GHz, reported in our previous works7,23, indicate that the magnetic anisotropy constants of Ka and Kb in orthorhombic symmetry are 7.7 × 10⁶ erg cm−3 and 1.2 × 10⁶ erg cm−3, respectively. Therefore, it is clarified that ε-Fe2O3 has remarkably high magnetic anisotropy compared with other ferrites such as BaFe12O19. The origin of such a small dp value and large K values can be explained by the following factors: (i) a strong magnetic anisotropy due to non-zero orbital angular momentum, L ≠ 0, through a strong hybridization between Fe and O, and (ii) remnants of the magnetic anisotropy due to the polar crystal structure.
Figure 3. Crystallographically oriented nanometer-sized ε-Fe2O3.
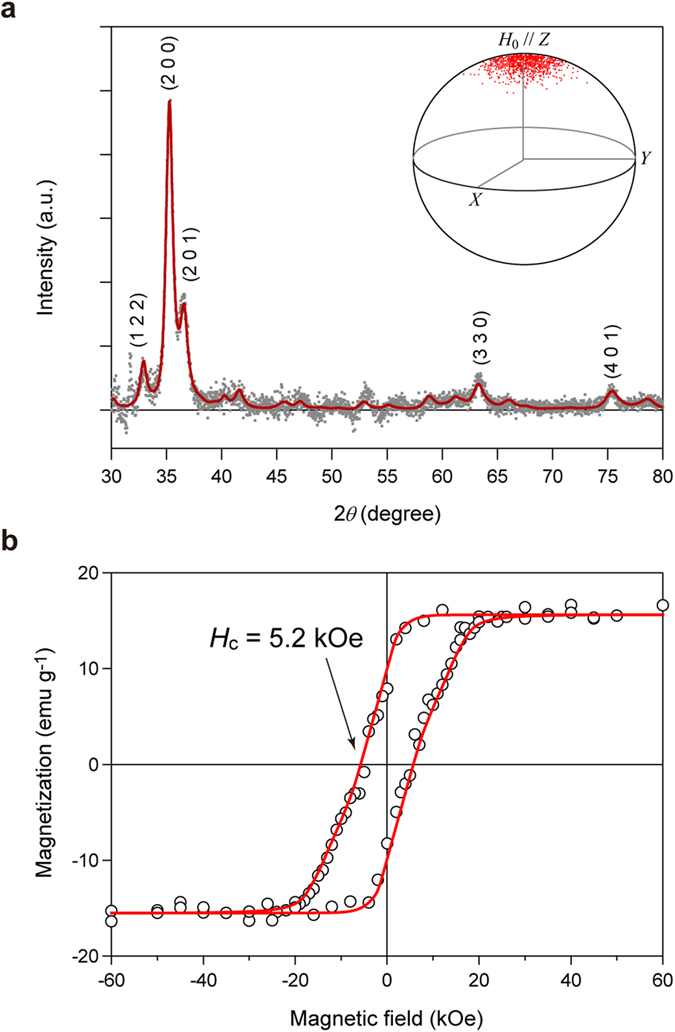
(a) XRPD pattern of the crystallographically oriented S-1020 nanocrystal (average particle size = 8.2 nm) film. Grey dots and red line represent the observed and calculated patterns, respectively. The inset is the unit sphere illustration of the 3D distribution of the direction of the crystallographic a-axis of ε-Fe2O3 nanoparticles shown by red dots. The magnetic field was applied along the Z axis of the unit sphere. (b) The magnetic hysteresis loop of the crystallographically oriented S-1020 nanocrystal film measured in the applied magnetic field (H0) parallel to the easy-axis at 300 K. The red line is a guide to the eye.
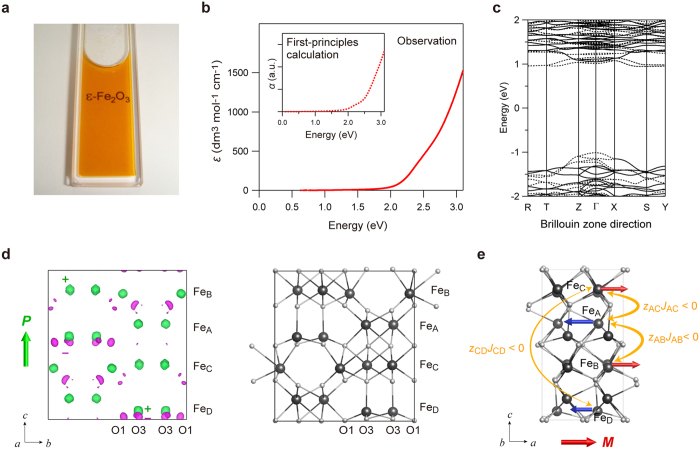
The colloidal solution of the S-1020 nanocrystal, which was used for the oriented nanocrystal film mentioned above, is highly transparent, with a light orange color (Fig. 4a). From the ultraviolet-visible (UV-vis) absorption spectrum, the molar absorption coefficient (ε) was only 400 dm3 mol−1 cm−1 at 500 nm (Fig. 4b). (Photon energy × absorption)2 versus photon energy was well fitted by a wide band gap of 2.9 eV (430 nm) accompanied by a weak optical transition at 2.4 eV (520 nm), indicating that this material has high transparency due to a wide band gap of 2.9 eV. Compared to γ-Fe2O3 nanoparticles, which have been reported to possess light color27, the present material exhibits a larger band gap and higher transparency.
Figure 4. Transparency, optical band gap, and spontaneous electric polarization of ε-Fe2O3 by UV-vis absorption spectra measurement and first-principles calculation.
(a) Photograph of the colloidal solution of S-1020 nanocrystal with an average particle size of 8.2 nm, whose concentration is 1 × 10⁻² mol dm−3. The solution has a light orange color. (b) Observed UV-vis absorption spectrum of S-1020 colloidal solution shown by the molar absorption coefficient (ε). The inset shows the calculated optical spectrum obtained from the first-principles calculation. The left axis is the absorption coefficient (α). (c) The band structure of ε-Fe2O3 near the Fermi energy. Solid and dotted black lines indicate α and β spins, respectively. (d) The difference charge density map, which shows the difference between the charge density of ε-Fe2O3 and those of the neutral Fe and O atoms, obtained by the first-principles calculation (left). Green and magenta surfaces in the difference charge density map show the isosurface levels of +0.385e Å−3 and –0.252e Å−3, respectively. The green arrow shows that the spontaneous electric polarization (P) of ε-Fe2O3 is along the crystallographic c-axis. The crystal structure of ε-Fe2O3 (right). The grey and white balls in the crystal structure show the Fe and O atoms, respectively. (e) Sublattice magnetizations of FeA–FeD shown by the arrow on the crystal structure of ε-Fe2O3. Red and blue arrows on the Fe sites indicate the sublattice magnetizations. The yellow curved arrows express the zJ values, where z is the number of exchange pathways and J is the superexchange interaction constant, with antiferromagnetic superexchange interaction between the Fe sites (zAB JAB < 0, zAC JAC < 0, zCD JCD < 0), and the thickness of the arrows indicate that the magnitude of zJ is  . The red arrow below the crystal structure shows that the magnetic polarization (M) of ε-Fe2O3 is along the crystallographic a-axis.
To understand such a high transparency, the optical band gap of ε-Fe2O3 was evaluated by first-principles calculation using the Vienna ab initio simulation package (VASP) program (see Methods). The band structure near the Fermi energy is shown in Fig. 4c, which shows an optical transition with a band gap of 2.36 eV, through a direct transition, and a weak transition at 2.02 eV. The calculated optical absorption spectrum reproduces well the experimental spectrum (Fig. 4b, inset).
The crystal structure of ε-Fe2O3 with Pna21 space group is that of a polar crystal, and therefore, spontaneous electric polarization should be generated. Here, the magnitude of spontaneous electric polarization of ε-Fe2O3 and its origin are investigated by a first-principles calculation. The results show that electric polarization exists along the crystallographic c-axis with a value of 1.0 × 10⁻¹ C m−2, which is large compared with other polar materials28. The difference charge density map, which is the difference between the charge density of ε-Fe2O3 and those of the neutral Fe and O atoms, indicates that the positive charge is distributed on the Fe atoms, and negative charge is distributed on the O atoms, as shown in Fig. 4d. The negative charge, especially, is concentrated on the O1 and O3 atoms around the tetrahedral FeD site, indicating that the electric polarization along the c-axis at FeDO4 is the main contribution to the pyroelectric property of ε-Fe2O3.
The magnetism of ε-Fe2O3 is considered to be collinear ferrimagnetism18,19, in which the sublattice magnetizations of FeB and FeC are antiparallel to those of FeA and FeD. Based on the molecular-field (MF) theory29, the magnetic structure of ε-Fe2O3 can be understood from the product value between the superexchange interaction (J) and the number of exchange pathways (z). The zJ value of the tetrahedral FeD site is smaller than those of octahedral FeA–FeC sites, and hence, thermal fluctuation on FeD sublattice magnetization is larger than FeA–FeC sublattice magnetizations, inducing ferrimagnetism along the crystallographic a-axis at room temperature (Fig. 4e).
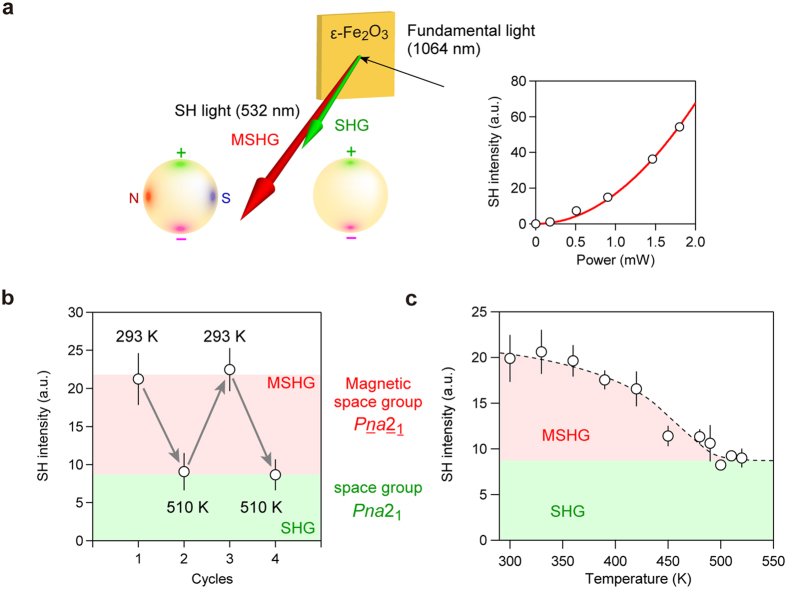
From the aforementioned electronic and magnetic calculations, ε-Fe2O3 has both electric polarization (//c-axis) and magnetic polarization (//a-axis). To investigate the magnetoelectric coupling effect between these two polarizations30,31,32, we measured the MSHG effect using the powder-form sample of S-1061. When a fundamental femtosecond laser (1064 nm) was put into the sample at 300 K, 532-nm output light was observed (Fig. 5a, Supplementary Fig. S7). Since the intensity of the 532-nm output light increased with the square of the input fundamental light intensity, the observed 532-nm light was due to second harmonic generation (SHG). By switching of the magnetic state between order and disorder, we were able to change the second harmonic (SH) intensity (ISH) repeatedly (Fig. 5b). We have also investigated the temperature dependence of ISH, which turned out to be nearly constant between 520 and 490 K, while gradually increasing below 490 K (Fig. 5c). The ISH value at 300 K was 2.2 times larger than the average ISH at 520 K. Such a temperature dependence of ISH corresponds to the magnetization versus temperature plot with a magnetic phase transition temperature (TC) of 490 K (Supplementary Fig. S4), indicating that the enhancement on ISH is caused by magnetic ordering, that is, MSHG effect is observed.
Figure 5. SHG and MSHG effects on ε-Fe2O3.
(a) The optical configuration of SHG and MSHG measurements. The orange square shows the position of the ε-Fe2O3 sample. A 1064-nm laser light (black arrow) irradiates the sample, and 532-nm SH output light is observed. The green arrow shows the SHG when the sample is in the magnetic-disordering state, while the red arrow shows the MSHG when the sample is in the magnetic-ordering state. The yellow spheres show the schematic illustrations of ε-Fe2O3 nanoparticle in the magnetic-ordering state with Pna21 magnetic space group (left) and the magnetic-disordering state with Pna21 space group (right). Only the electric polarization exists in the magnetic-disordering state, where the positive and negative charge are shown by green and magenta. In the magnetic-ordering state, the magnetic polarization appears perpendicular to the electric polarization, which is shown by the N-pole in red and S-pole in blue. The bottom right figure shows the SH intensity of S-1061 versus fundamental light intensity at room temperature. The red line represents the fitted curve based on SH intensity ∝ (fundamental light power)2. (b) Repetitive switching of SH intensity between SHG and MSHG by changing the temperature between above and below TC. (c) SH intensity versus temperature plot of S-1061.
SH polarization is described by PSH = χ(2)E(ω)E(ω), where PSH and χ(2) are the SH polarization and SH susceptibility tensor, and E(ω) and ω are the electric field and angular frequency of the input fundamental light, respectively (see Methods). The ISH value is related to the crystallographic term  and the magnetic term
  by the equation of
  . Below TC,
  operates, and then, ISH is enhanced depending on the magnetization value. From the SHG and MSHG results, the nonlinear optical-ME effect of these nanocrystals is quite strong. That is, the magnetic polarization and electric polarization are strongly correlated to each other in ε-Fe2O3.
In summary, we have developed a synthetic method for a single-nanosize ε-Fe2O3 magnet. In particular, the Hc value of ε-Fe2O3 with a diameter of 8 nm is 5 kOe, sufficient for magnetic recording systems, where the necessary spec is 3 kOe. Magnetic anisotropy constant approaches 7.7 × 10⁶ erg cm−3, which is over two times as large as those of BaFe12O19 (K = 3.0 × 10⁶ erg cm−3) and SrFe12O19 (K = 3.5 × 10⁶ erg cm−3). The present single-nanosize magnetic material may contribute to the high-density magnetic recording technology, for example, LTO-8 of the next-generation magnetic recording tapes, as well as hard disc drives for computers4,5,9,10,11. While this magnitude of magnetization can be detected by high-sensitive reading heads, we are in the process of improving the magnetization value of this series by a double using the approach of metal-substitution procedure. The ε-Fe2O3 nanomagnet also exhibits spontaneous electric polarization, originating from its polar crystal structure, and an optical-magnetoelectric effect between electric polarization (//c-axis) and magnetic polarization (//a-axis), with an MSHG effect. Surprisingly, this nonlinear optical-ME effect is strong. Importantly, this material possesses high optical transparency with a wide band gap. A transparent magnet will open possibilities for new industrial applications, e.g. transparent electromagnetic wave absorbing windows and magnetic color pigments. Such high performance was achieved in a simple iron oxide, which is significant, since iron oxides are ecofriendly and low cost. Therefore, this material can be reasonably expected to be scalable for industrial applications.
Methods
Materials
Nanometer-size ε-Fe2O3 was prepared from a precursor, where Fe10O14(OH)233 with particle size of 2.8 nm was embedded in SiO2. The precursor was sintered at 250 °C–1295 °C for four hours in air, to obtain iron oxide in SiO2 matrix. The SiO2 matrix was then removed by chemical etching using a NaOH aqueous solution.
Physical property measurements
TEM images were acquired with JEM 2000EX. The 2θ–θ scan XRPD measurements were performed using Rigaku Ultima IV and Rigaku RINT2100 with Cu Kα radiation (λ = 1.5418 Å) at 293 K. Rietveld analyses were performed using the PDXL program of RIGAKU. The magnetic properties were measured using a superconducting quantum interference device (SQUID) magnetometer (Quantum Design, MPMS 7). UV-vis spectra were recorded on JASCO V-670 spectrometer.
Particle size dependence of the coercive field
In the case of nanoparticles with a random orientation considering a size distribution, the d value dependence of the Hc value is described by
 |
where VSP and VSW are the mean volumes of superparamagnetic particles and particles with sizes between dp and  dp, respectively, and f(d) is the particle size distribution26,34. The Gaussian function is used as f(d) in the present analysis.
First-principles calculation of electronic structure, optical spectrum, and spontaneous electric polarization
First-principles calculations of ε-Fe2O3 was carried out using the VASP program with the plane-wave projector augmented wave (PAW) method. The spin-polarized density functional theory (DFT) was used as the basis. Approximation of the exchange-correlation functional was done using the generalized gradient approximation (GGA) parameterized by Perdew-Burke-Ernzerhof (PBE).
Experimental details for SHG measurement
For the SHG measurement, incident 1064-nm light was generated by an optical parametric amplifier (Clark-MXR, Vis-OPA; pulse width 190 fs; repetition, 1 kHz) pumped by a frequency-doubled Ti:sapphire laser (Clark-MXR, CPA-2001; wavelength, 775 nm; pulse width 150 fs; repetition, 1 kHz). The incident light was irradiated onto the sample at the angle of 20°. The detection of the reflected SH light (532 nm) was performed by a photomultiplier tube (Hamamatsu R329-02), after passing through color filters.
SHG and MSHG tensors
SH polarization is described by PSH,i = χijk(2)Ej(ω)Ek(ω), where PSH,i and χijk(2) are the SH polarization and SH susceptibility tensor, and the subscripts i, j, and k, refer to the axes of the sample. The space group Pna21 of ε-Fe2O3 has a crystallographic term  in the second-order nonlinear susceptibility35. When the nanoparticles are oriented by electric and magnetic fields as (electric polarization) //z-axis (c-axis) and (magnetic polarization) //x-axis (a-axis), the nonzero
  elements in χijk(2) are
  ,
,  ,
,  ,
,  and
and  . Additionally, below TC, the magnetic polarization generates a magnetic term
  in the Pna21 magnetic space group, that is,
  ,
,  ,
,  ,
,  and
and  . The nonzero tensor elements in χijk(2) are described by the sum of
  and
and  by the following tensor.
 |
Additional Information
How to cite this article: Ohkoshi, S. et al. Nanometer-size hard magnetic ferrite exhibiting high optical-transparency and nonlinear optical-magnetoelectric effect. Sci. Rep. 5, 14414; doi: 10.1038/srep14414 (2015).
Supplementary Material
Acknowledgments
The present research was supported in part by the CREST project of JST, JSPS Grant-in-Aid for Specially promoted Research Grant Number 15H05697, JSPS Grants-in-Aid for Young Scientists (A), (B), APSA from MEXT, and DOWA Technofund. M. K. is grateful to ALPS program from MEXT. Y. M. and T. N. are grateful to MERIT program from JSPS. We thank the Cryogenic Research Center and the Center for Nano Lithography & Analysis, The University of Tokyo, which are supported by MEXT. We are grateful to Ms. Y. Kitano for technical support, Mr. Y. Kakegawa, Mr. H. Tsunakawa, and Mr. S. Ohtsuka of The University of Tokyo for collecting the TEM images, Mr. T. Miyazaki, Mr. T. Yoshida, Mr. K. Masada, and Mr. H. Maekawa of DOWA Electronics Materials Co., Ltd. for the valuable discussions, and Dr. K. Chiba of Ryoka Systems Inc. for his assistance with the first-principles calculations.
Footnotes
Author Contributions S.O. designed and coordinated the study, contributed to all measurements and calculations and wrote the manuscript. A.N. carried out the XRPD analyses and the magnetic measurements and prepared the figures. K.I. carried out the XRPD analyses, magnetic measurements, and SHG and MSHG measurements. M.Y. prepared some of the samples, conducted the magnetic measurements and first-principles calculations, and partially wrote the manuscript. W.T. performed the synthesis, XRPD measurements, magnetic measurements, and TEM observations. K.N. performed the crystal structure analyses. M.K. performed the SHG and MSHG measurements. Y.M. analyzed the magnetic data. T.N. conducted first-principles calculations. Syu.O. prepared and characterized some of the samples. H.T. proposed the synthetic method and contributed to the sample preparation and characterization. All authors commented on the manuscript.
References
- Hayashi T., Hirono S., Tomita M. & Umemura S. Magnetic thin films of cobalt nanocrystals encapsulated in graphite-like carbon. Nature 381, 772–774 (1996). [Google Scholar]
- Yan Y., Timonen J. V. I. & Grzybowski B. A. A long-lasting concentration cell based on a magnetic electrolyte. Nature Nanotech. 9, 901–906 (2014). [DOI] [PubMed] [Google Scholar]
- Herbst J. F. R2Fe14B materials: Intrinsic properties and technological aspects. Rev. Mod. Phys. 63, 819–898 (1991). [Google Scholar]
- Plumer M. L., Ek J. & vanWeller D. The Physics of Ultra-High Density Magnetic Recording (Springer, 2001). [Google Scholar]
- Nakamura Y. Advanced Technologies of Perpendicular Magnetic Recording (CMC Publishing, Tokyo, 2007). [Google Scholar]
- Mao C. et al. Virus-Based Toolkit for the Directed Synthesis of Magnetic and Semiconducting Nanowires. Science 303, 213–217 (2004). [DOI] [PubMed] [Google Scholar]
- Namai A. et al. Hard magnetic ferrite with a gigantic coercivity and high frequency millimetre wave rotation. Nature Commun. 3, 1035 (2012). [DOI] [PMC free article] [PubMed] [Google Scholar]
- Ohkoshi S. et al. A Millimeter-Wave Absorber Based on Gallium-Substituted ε-Iron Oxide Nanomagnets. Angew. Chem. Int. Ed. 46, 8392–8395 (2007). [DOI] [PubMed] [Google Scholar]
- Richter H. J. et al. Recording on Bit-Patterned Media at Densities of 1 Tb/in2 and Beyond. IEEE. Trans. Magn. 42, 2255–2260 (2006). [Google Scholar]
- Rottmayer R. E. et al. Heat-Assisted Magnetic Recording. IEEE. Trans. Magn. 42, 2417–2421 (2006). [Google Scholar]
- Challener W. A. et al. Heat-assisted magnetic recording by a near-field transducer with efficient optical energy transfer. Nature Photon. 3, 220–224 (2009). [Google Scholar]
- Rondinelli J. M., Stengel M. & Spaldin N. A. Carrier-mediated magnetoelectricity in complex oxide heterostructures. Nature Nanotech. 3, 46–50 (2008). [DOI] [PubMed] [Google Scholar]
- Chu Y.-H. et al. Electric-field control of local ferromagnetism using a magnetoelectric multiferroic. Nature Mater. 7, 478–482 (2008). [DOI] [PubMed] [Google Scholar]
- Hur N. et al. Electric polarization reversal and memory in a multiferroic material induced by magnetic fields. Nature 429, 392–395 (2004). [DOI] [PubMed] [Google Scholar]
- Eerenstein W., Mathur N. D. & Scott J. F. Multiferroic and magnetoelectric materials. Nature 442, 759–765 (2006). [DOI] [PubMed] [Google Scholar]
- Gich M. et al. Multiferroic iron oxide thin films at room temperature. Adv. Mater. 26, 4645–4652 (2014). [DOI] [PubMed] [Google Scholar]
- Tokura Y. Materials science—Multiferroics as Quantum Electromagnets. Science 312, 1481–1482 (2006). [DOI] [PubMed] [Google Scholar]
- Tuček J., Zbořil R., Namai A. & Ohkoshi S. ε-Fe2O3: An advanced nanomaterial exhibiting giant coercive field, millimeter-wave ferromagnetic resonance, and magnetoelectric coupling. Chem. Mater. 22, 6483–6505 (2010). [Google Scholar]
- Ohkoshi S. & Tokoro H. Hard magnetic ferrite: ε-Fe2O3. Bull. Chem. Soc. Jpn. 86, 897–907 (2013). [Google Scholar]
- Jin J., Ohkoshi S. & Hashimoto K. Giant coercive field of nanometer-sized iron oxide. Adv. Mater. 16, 48–51 (2004). [Google Scholar]
- Tronc E., Chanéac C., Jolivet J. P. & Grenèche J. M. Spin collinearity and thermal disorder in ε-Fe2O3. J. Appl. Phys. 98, 053901 (2005). [Google Scholar]
- Tseng Y.-C. et al. Nonzero orbital moment in high coercivity ε-Fe2O3 and low-temperature collapse of the magnetocrystalline anisotropy. Phys. Rev. B 79, 094404 (2009). [Google Scholar]
- Namai A. et al. Synthesis of an Electromagnetic Wave Absorber for High-Speed Wireless Communication. J. Am. Chem. Soc. 131, 1170–1173 (2009). [DOI] [PubMed] [Google Scholar]
- Balaev D. A. et al. Dynamic magnetization of ε-Fe2O3 in pulse field: Evidence of surface effect. J. Appl. Phys. 117, 063908 (2015). [Google Scholar]
- Kohout J. et al. The magnetic transition in ε-Fe2O3 nanoparticles: Magnetic properties and hyperfine interactions from Mössbauer spectroscopy. J. Appl. Phys. 117, 17D505 (2015). [Google Scholar]
- Pfeiffer H. Determination of anisotropy field distribution in particle assemblies taking into account thermal fluctuations. Phys. Stat. Sol. (a) 118, 295–306 (1990). [Google Scholar]
- Ziolo R. F. et al. Matrix-mediated synthesis of nanocrystalline γ–Fe2O3: A new optically transparent magnetic material. Science 257, 219–223 (1992). [DOI] [PubMed] [Google Scholar]
- Landolt H. & Börnstein R. Numerical Data and Functional Relationships in Science and Technology, New Series. vol. III/16a (Springer, 1981). [Google Scholar]
- Ohkoshi S., Namai A. & Sakurai S. The origin of ferromagnetism in ε-Fe2O3 and ε-GaxFe2–xO3 nanomagnets. J. Phys. Chem. C 113, 11235–11238 (2009). [Google Scholar]
- Fiebig M., Lottermoser T., Fröhlich D., Goltsev A. V. & Pisarev R. V. Observation of coupled magnetic and electric domains. Nature 419, 818–820 (2002). [DOI] [PubMed] [Google Scholar]
- Train C. et al. Strong magneto-chiral dichroism in enantiopure chiral ferromangets. Nature Mater. 7, 729−734 (2008). [DOI] [PubMed] [Google Scholar]
- Ohkoshi S. et al. 90-degree optical-switching of output second harmonic light in chiral photomagnet. Nature Photonics 8, 65–71 (2014). [Google Scholar]
- Michel F. M. et al. The structure of ferrihydrite, a nanocrystalline material. Science 316, 1726–1729 (2007). [DOI] [PubMed] [Google Scholar]
- Cullity B. D. & Graham C. D. Introduction to Magnetic Materials (IEEE press, 2009). [Google Scholar]
- Birss R. R. Symmetry and Magnetism Vol. 3 (North Holland Publishing Group, 1964). [Google Scholar]
Associated Data
This section collects any data citations, data availability statements, or supplementary materials included in this article.


