Abstract
Background
Diabetes mellitus and hypertension are risk factors for acute kidney injury (AKI). Whether estimated glomerular filtration rate (eGFR) and urine albumin creatinine ratio (ACR) remain risk factors for AKI in the presence and absence of these conditions is uncertain.
Study Design
Meta-analysis of cohort studies.
Setting & Population
8 general population (1,285,045 participants) and 5 CKD (79,519 participants) cohorts.
Selection Criteria for Studies
Cohorts participating in the CKD Prognosis Consortium.
Predictors
Diabetes and hypertension status, eGFR by the CKD Epidemiology Collaboration 2009 creatinine equation, urine ACR, and interactions.
Outcome
Hospitalization with AKI, using Cox proportional hazards models to estimate hazard ratios (HR) of AKI and random effects meta-analysis to pool results.
Results
Over a mean follow-up period of 4 years, there were 16,480 episodes of AKI in the general population and 2,087 episodes in the CKD cohorts. Low eGFR and high ACR were associated with higher risks of AKI in individuals with or without diabetes and with or without hypertension. When compared to a common reference of eGFR 80 mL/min/1.73m2 in non-diabetic patients, HRs for AKI were generally higher in diabetic patients at any level of eGFR. The same was true for diabetic patients at all levels of ACR compared to non-diabetic patients. The risk gradient for AKI with lower eGFR was greater in those without diabetes than with diabetes, but similar with higher ACR in those without versus with diabetes. Those with hypertension had a higher risk of AKI at eGFR greater than 60 ml/min/1.73m2 than those without hypertension. However, the risk gradients for AKI with both lower eGFR and higher ACR were greater for those without than with hypertension.
Limitations
AKI identified by diagnostic code.
Conclusions
Lower eGFR and higher ACR are associated with higher risks of AKI among individuals with or without either diabetes or hypertension.
Keywords: eGFR, albuminuria, diabetes, hypertension, acute kidney injury
Introduction
Acute kidney injury (AKI) is common and its incidence has risen over the last two decades.1–3 AKI has been consistently associated with lengthy hospitalization, kidney failure requiring dialysis, development and progression of chronic kidney disease (CKD) and death.4–6 Pre-existing reduced estimated glomerular filtration rate (eGFR) and albuminuria, two key measures of CKD, are strong risk factors for AKI.7–10 Although they may be used to identify individuals at high risk of AKI, it is not known whether these measures remain consistently associated with the risks of AKI in the presence and absence of comorbid conditions that are prevalent in CKD.
Diabetes and hypertension frequently co-exist with CKD, and can modify kidney disease outcomes.11–16 Importantly, both of these conditions have been associated with heightened risks of AKI in several clinical settings.7–9,17 Despite the overlap among these conditions with CKD, estimates of the strength and consistency of the association between pre-existing reduced eGFR or albuminuria with AKI in the presence or absence of diabetes or hypertension are lacking. The relevance of eGFR and albuminuria as predictors of AKI risk in combination with diabetes and hypertension is thus uncertain.
To address this knowledge gap, we performed a collaborative meta-analysis to assess the risks of AKI according to eGFR, albuminuria, and the presence or absence of diabetes or hypertension, and to determine whether these conditions modified the associations between eGFR and albuminuria with AKI.
Methods
Study selection criteria
Studies were selected according to the criteria of the Chronic Kidney Disease Prognosis Consortium, as previously described.15 We included studies of general population and CKD cohorts with baseline information about eGFR and albuminuria, and at least 50 AKI events. We restricted all analyses to adults ≥18 years of age. Data transfer and analyses were done between October 2013 and January 2014. The institutional review board at the Johns Hopkins Bloomberg School of Public Health approved the study (IRB Number: 3324).
Exposure variables
We estimated GFR from age, sex, race, and serum creatinine concentration using the Chronic Kidney Disease Epidemiology Collaboration (CKD-EPI) equation.18,19 For studies in which serum creatinine concentration was not previously standardized to isotope dilution mass spectrometry, we used an established calibration factor to reduce creatinine concentrations by 5%.20 Albuminuria was ascertained by albumin-to-creatinine ratio (ACR), or quantitative dipstick. In categorical analyses, we considered dipstick test results of negative, trace, 1+, and 2+, ≥3+, to be equivalent to ACR of <10, 10–29, 30–299, 300–999, and ≥1000 mg/g, respectively.11,12,21,22
Effect modification variables
We defined diabetes as fasting glucose of ≥7.0 mmol/L, non-fasting glucose of ≥11.1 mmol/L, glycated haemoglobin (HbA1c) of ≥6.5%, use of glucose-lowering drugs, self-reported diabetes, or using administrative data coding algorithms (Supplemental Material, Appendix 2).23 We defined hypertension as systolic blood pressure of ≥140 mm Hg, diastolic blood pressure of ≥ 90 mm Hg, use of antihypertensive drugs, or based on administrative data codes.24 In sensitivity analyses, we identified hypertension based only on systolic and diastolic blood pressure values, recognizing that antihypertensive drugs may be used for heart failure or CKD with proteinuria in the absence of hypertension.
Outcome
The outcome of the study was AKI, identified using administrative data codes. We used International Classification of Disease, 9th Revision, Clinical Modification (ICD-9-CM) code 584.x or International Classification of Disease, 10th Revision, Clinical Modification (ICD-10-CM) code N17.0 with a hospitalization.25
Statistical analysis
Individual-level data from each study were analyzed according to a common analytical plan, based on previously published methodology.11,12 Participants with missing values for eGFR, albuminuria, or the potential effect modifiers of interest (diabetes or hypertension) were excluded from the respective analyses. We imputed cohort-specific means for all other missing values of baseline covariates. Covariates missing more than 50% of values within a cohort were not included in study level analyses. For each study, we fitted Cox proportional hazards models to estimate hazard ratios (HR) for AKI associated with eGFR and albuminuria in participants with and without diabetes and hypertension. Models included terms for age, sex, race (black versus non-black), systolic blood pressure (continuous), diabetes, cardiovascular disease, total cholesterol (continuous), body mass index (continuous), smoking (present versus former or never), and albuminuria (log-transformed ACR as continuous variables and dipstick proteinuria as a categorical variable) for eGFR analyses, and eGFR splines for ACR analysis. Models fit using eGFR linear splines employed knots placed at each 15 mL/min/1.73m2 interval from 30 to 105 mL/min/1.73m2, and product terms with each potential effect modifier of interest. This approach provided HRs for eGFR (relative to an eGFR of 80 mL/min/1.73m2 in general population cohorts, and 50 mL/min/1.73m2 in CKD cohorts) in those with and without diabetes or hypertension. From these models, we then assessed for interaction by determining the ratio of HRs for participants with versus without diabetes or hypertension, at each 1 mL/min/1.73m2 increment of eGFR (point-wise interaction), and obtained HRs and their standard errors at each eGFR value from each cohort. We applied a similar approach to assess associations with ACR within each study, based on knots at 10 mg/g, 30 mg/g and 300 mg/g and a reference at ACR 5 mg/g in the general population cohorts, and knots at 30mg/g 300 mg/g and 1000 mg/g with a reference at ACR 50 mg/g in the CKD cohorts. We assessed point-wise interactions of potential effect modifiers at 8% increments of ACR.
To assess the effects of diabetes and hypertension on the risk of AKI in the general population cohorts, we also compared risk estimates of participants with and without each of these comorbidities to common reference groups of eGFR 80 mL/min/1.73m2 (50 mL/min/1.73m2 in CKD cohorts) and ACR 5 mg/g (50 mg/g in CKD cohorts) of individuals without diabetes or hypertension.26 In order to explore whether the modifying effects of diabetes or hypertension could be explained by cardiovascular disease, we also repeated all analyses stratified by a history of cardiovascular disease. We also performed categorical analyses, comparing the risk of AKI based on 28 categories of eGFR (15–29, 30–44, 45–59, 60–74, 75–89, 90–104, ≥105 mL/min/1.73m2) and albuminuria (ACR <10, 10–29, 30–299, ≥300 mg/g) in general population cohorts, and 20 categories of eGFR (15–29, 30–44, 45–59, 60–74, ≥75 mL/min/1.73m2) and albuminuria (<30, 30–299, 300–999, ≥1000 mg/g) in CKD cohorts, based on the presence or absence of diabetes and hypertension.
Random effects meta-analysis was used to pool HRs at each eGFR and ACR value from all studies, with weighting according to the inverse of the within and between study variance of each study. Heterogeneity was estimated using the I2 statistic. To assess for overall multiplicative interaction, we pooled the average coefficients of the product terms of eGFR or log-ACR splines and diabetes or hypertension from each study using inverse variance weighting. All analyses were done in Stata version 13.1, using code developed at the data coordination center (Johns Hopkins University, Baltimore, MD, USA).
Results
We included 1,285,045 participants from eight general population cohorts, with mean follow-up ranging from 4 to 12 years, and 79,519 participants from five CKD cohorts followed for a mean of 1 to 5 years (Table 1). The prevalence of diabetes and hypertension ranged from 4 to 34%, and 20 to 82%, respectively, in the general population cohorts, and 14 to 89% and 42 to 93%, respectively, in the CKD cohorts. Among the general population cohorts, there were 16 480 AKI events, and 0.2 to 6% of the individual study populations developed AKI. There were 2,087 AKI events recorded in CKD cohorts, and 2 to 25% of CKD study populations developed AKI during follow-up.
Table 1.
Baseline characteristics of the individual studies: mean (standard deviation) except number (n) percentage (%), where stated.
| Study | Region | N | AKI, n (%) | Follow-up (years) |
Age (years) |
% Female | % Black | % DM | % HTN | %Hx CVD | % HC | % Smoking | BMI (kg/m2)) | eGFR** | %alb* |
|---|---|---|---|---|---|---|---|---|---|---|---|---|---|---|---|
| General Population cohorts | |||||||||||||||
| AKDN | Canada | 920,686 | 9,060 (1%) | 4 (2) | 47 (17) | 55% | na | 6% | 20% | 3% | na | na | na | 92 (20) | 5% |
| ARIC | USA | 11420 | 655 (6%) | 10 (2) | 63 (6) | 56% | 22% | 17% | 47% | 16% | 34% | 15% | 29 (6) | 84 (15) | 8% |
| CHS | USA | 2968 | 115 (4%) | 9 (4) | 78 (5) | 59% | 17% | 16% | 63% | 23% | 38% | 8% | 27 (5) | 71 (17) | 20% |
| HUNT | Norway | 9670 | 281 (3%) | 13 (2) | 62 (15) | 55% | 0% | 18% | 82% | 23% | 64% | 21% | 28 (5) | 85 (20) | 13% |
| Maccabi | Israel | 265800 | 6,112 (2%) | 4 (2) | 57 (14) | 49% | 0% | 34% | 53% | 5% | 60% | 2% | 30 (6) | 86 (21) | 15% |
| PREVEND | Netherlands | 8377 | 54 (1%) | 10 (2) | 49 (13) | 50% | 1% | 4% | 34% | 5% | 40% | 34% | 26 (4) | 84 (16) | 11% |
| Severance | Korea | 65021 | 151 (0.2%) | 11 (3) | 46 (12) | 48% | 0% | 7% | 25% | 2% | 1% | 16% | 24 (3) | 85 (16) | 5% |
| ULSAM | Sweden | 1103 | 52 (5%) | 12 (4) | 71 (1) | 0% | 0% | 19% | 75% | 36% | 58% | 20% | 26 (3) | 76 (11) | 16% |
| Chronic Kidney Disease cohorts | |||||||||||||||
| CRIB | UK | 207 | 51 (25%) | 5 (3) | 62 (14) | 30% | 6% | 14% | 93% | 27% | 59% | 14% | 27 (4) | 26 (8) | 80% |
| Geisinger ACR | USA | 4043 | 561 (14%) | 4 (2) | 69 (10) | 53% | 2% | 89% | 73% | 18% | 10% | 8% | 33 (7) | 52 (8) | 43% |
| Geisinger Dip | USA | 920 | 185 (20%) | 3 (2) | 68 (12) | 49% | 2% | 40% | 64% | 18% | 15% | 9% | 31 (7) | 50 (9) | 38% |
| KPNW | USA | 1624 | 51 (3%) | 4 (2) | 72 (10) | 56% | 3% | 39% | 42% | 59% | 22% | 13% | 30 (6) | 46 (11) | 31% |
| Sunnybrook | Canada | 1994 | 51 (3%) | 3 (2) | 60 (18) | 47% | 0% | 41% | 82% | 39% | 18% | 7% | 29 (16) | 68 (32) | 61% |
| VA CKD | USA | 70731 | 1,188 (2%) | 0.7 (0.5) | 71 (10) | 2% | 12% | 88% | 90% | 52% | 80% | na | 31 (6) | 64 (21) | 56% |
Defined as urine albumin:creatinine ≥30 mg/g, urine protein:creatinine ≥50 mg/g, or dipstick proteinuria ≥ 1+
eGFR=estimated glomerular filtration rate (mL/min/1.73m2)
Abbreviations: AKI=Acute kidney injury, DM=Diabetes melllitus, HTN=Hypertension, CVD=Cardiovascular Disease, HC=High cholesterol, BMI=Body mass index, alb=albuminuria, na=not assessed
Associations in individuals with and without diabetes
Lower eGFR and higher ACR were associated with greater risk of AKI in both those with and without diabetes in the general population cohorts (Figure 1). When compared to a common reference of eGFR 80 mL/min/1.73m2 in individuals without diabetes, HRs for AKI were generally higher in participants with diabetes at any levels of eGFR; however, a steeper relative risk increase associated with lower eGFR in those without diabetes than those with diabetes attenuated the risk difference at eGFR <60 mL/min/1.73m2 (Figure 1 left panel). When we compared HRs based on separate references groups in diabetic and non-diabetic individuals, we confirmed a significant multiplicative point-wise interaction between diabetes and eGFR (Figure 2 left panel). The overall interaction of diabetes with eGFR was also significant (average relative HR for 15 mL/min/1.73m2 lower eGFR between individuals with diabetes versus those without diabetes 0.85; 95% CI 0.83–0.87). We identified no heterogeneity of the overall interaction between eGFR and diabetes between individual studies (I2=0%), with all cohorts exhibiting a weaker association for low eGFR in individuals with diabetes compared to those without diabetes (Figure S1).
Figure 1.
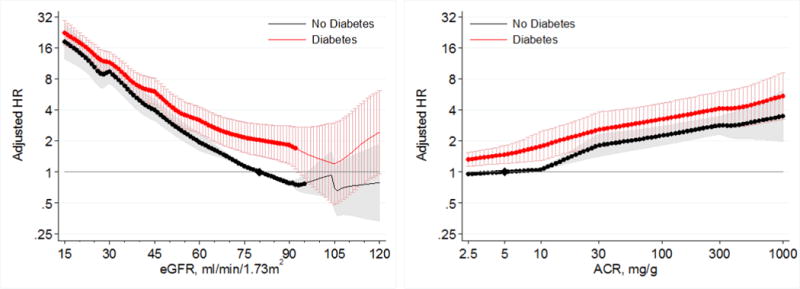
Hazard ratios (with 95% confidence intervals) of AKI, using common referent groupwithout diabetes, according to eGFR (left, reference eGFR 80 without diabetes) and ACR (right, reference ACR 5 without diabetes) in individuals with and without diabetes in general population cohorts.
Figure 2.
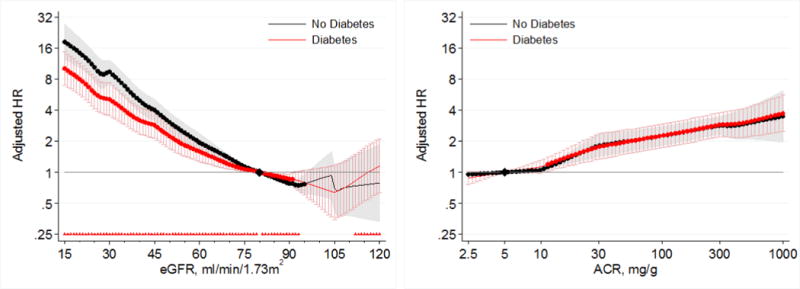
Hazard ratios (with 95% confidence intervals) of AKI, using separate reference groups by diabetes status, according to eGFR (left, reference eGFR 80) and ACR (right, reference ACR 5) in individuals with and without diabetes in general population cohorts. Triangles indicate significant (P<0.05) multiplicative pointwise interactions.
When compared to a common reference point of ACR 5 mg/g in individual without diabetes, individuals with diabetes generally had a higher risk of AKI than those without diabetes at all levels of ACR (Figure 1, right panel). In analyses using separate references at ACR 5 mg/g for those with and without diabetes, we identified no significant multiplicative point-wise interaction across the range of ACR (Figure 2, right panel). There was also no significant overall interaction of diabetes with ACR (average relative HR for 2.7 fold increase in ACR between individuals with diabetes versus those without diabetes 0.98; 95% CI 0.97–1.00), with no heterogeneity of the overall interaction between ACR and diabetes between individual studies (I2=0%) (Figure S2).
In the CKD cohorts, lower eGFR and higher albuminuria were also associated with greater risk of AKI in both those with and without diabetes (Figure 3). The risks of AKI did not significantly differ between those with and without diabetes across ranges of eGFR < 60 mL/min/1.73m2 or across ACR ranges > 10 mg/g in the CKD cohorts (Figures 3 and 4).
Figure 3.
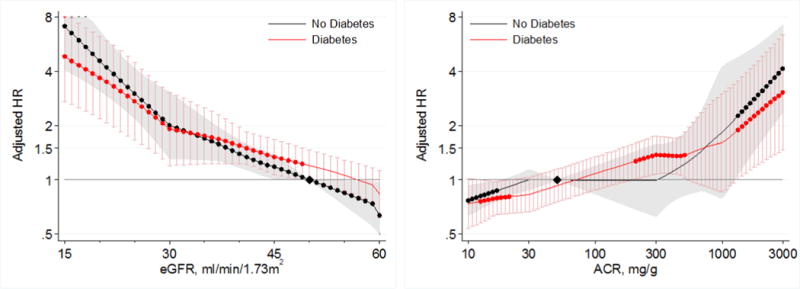
Hazard ratios (with 95% confidence intervals) of AKI, using common referent group without diabetes, according to eGFR (left, reference eGFR 50 without diabetes) and ACR (right, reference ACR 50 without diabetes) in individuals with and without diabetes in CKD cohorts.
Figure 4.
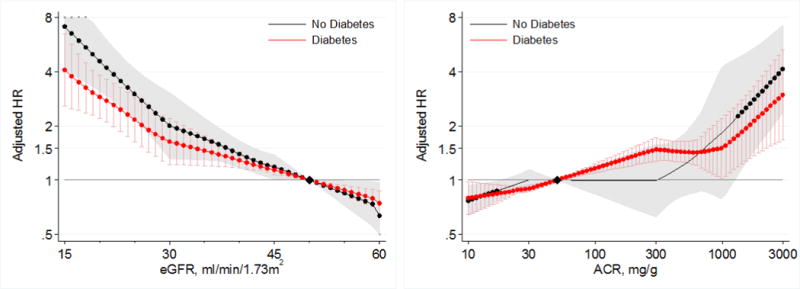
Hazard ratios (with 95% confidence intervals) of AKI, using separate reference groups by diabetes status, according to eGFR (left, reference eGFR 50) and ACR (right, reference ACR 50) in individuals with and without diabetes in CKD cohorts.
When further stratified according to history of cardiovascular disease, significant multiplicative interaction between diabetes and eGFR at eGFR < 75 ml/min/1.73m2, but not diabetes and ACR, was seen in general population cohorts for both those with and without a history of cardiovascular disease (Figure S3).
The findings from the categorical analyses were consistent with the findings from the continuous analysis (Tables 2 and 3). The risk of AKI was greater at lower eGFR and higher albuminuria in both those with and without diabetes, but the risk gradient was greater in those without diabetes than those with diabetes, in most categories.
Table 2.
Hazard ratios for AKI stratified by eGFR and albuminuria categories and by diabetes status for general population cohorts.
| eGFR | No diabetes | Diabetes | ||||||||
|---|---|---|---|---|---|---|---|---|---|---|
| ACR/Dipstick | ACR/Dipstick | |||||||||
| <10/Dip “−” | 10–29/Dip “±” | 30–299/Dip “1+” | 300+/Dip “≥2+” | <10/Dip “−” | 10–29/Dip “±” | 30–299/Dip “1+” | 300+/Dip “≥2+” | |||
| ≥105 | 1.01 (0.59, 1.70) |
1.89 (0.86, 4.16) |
3.05 (1.37, 6.78) |
9.32 (4.20, 20.67) |
0.82 (0.48, 1.41) |
1.14 (0.57, 2.27) |
1.81 (0.96, 3.42) |
3.04 (1.19, 7.78) |
9.39 (4.16, 21.21) |
1.17 (0.66, 2.08) |
| 90–104 | 0.93 (0.73, 1.18) |
1.36 (0.75, 2.47) |
2.83 (2.13, 3.78) |
6.59 (3.31, 13.13) |
0.90 (0.68, 1.20) |
0.82 (0.63, 1.07) |
1.32 (1.00, 1.73) |
2.40 (1.52, 3.79) |
5.50 (4.19, 7.22) |
0.85 (0.61, 1.20) |
| 75–89 | Ref |
1.97 (1.66, 2.34) |
3.51 (2.68, 4.60) |
6.74 (5.30, 8.58) |
Ref | Ref |
1.70 (1.18, 2.44) |
2.49* (2.11, 2.93) |
4.73* (3.14, 7.12) |
Ref |
| 60–74 |
1.66 (1.53, 1.80) |
2.84 (2.04, 3.95) |
4.48 (3.50, 5.73) |
8.56 (6.75, 10.86) |
1.60 (1.47, 1.73) |
1.36* (1.20, 1.53) |
2.12* (1.80, 2.49) |
3.54* (2.72, 4.60) |
6.82* (5.79, 8.05) |
1.41* (1.30, 1.53) |
| 45–59 |
3.06 (2.41, 3.89) |
5.48 (3.82, 7.86) |
7.41 (5.56, 9.87) |
14.08 (11.16, 17.75) |
2.72 (2.22, 3.34) |
2.89* (2.05, 4.09) |
3.24* (2.15, 4.89) |
4.70* (3.05, 7.24) |
8.75* (5.87, 13.05) |
2.10* (1.63, 2.71) |
| 30–44 |
7.87 (6.03, 10.28) |
9.18 (6.05, 13.94) |
14.29 (9.25, 22.10) |
24.91 (15.31, 40.54) |
5.83 (4.63, 7.36) |
5.27* (3.86, 7.20) |
6.30* (4.16, 9.54) |
9.08* (7.83, 10.54) |
15.62* (10.51, 23.23) |
3.96* (3.41, 4.60) |
| 15–29 |
19.36 (16.91, 22.18) |
25.69 (13.20, 49.99) |
28.46 (23.74, 34.10) |
39.18 (29.32, 52.36) |
10.68 (8.05, 14.17) |
9.80* (7.25, 13.23) |
17.27* (8.34, 35.79) |
15.91* (12.30, 20.58) |
23.53* (16.08, 34.44) |
6.68* (5.57, 8.03) |
| Ref |
1.59 (1.32, 1.93) |
2.58 (2.30, 2.90) |
4.00 (3.16, 5.06) |
Ref |
1.46 (1.25, 1.70) |
2.08* (1.95, 2.22) |
3.44 (2.78, 4.24) |
|||
Hazard ratios which, compared to the reference category, are significantly (p<0.05) greater than 1 are in bold, and significant (p<0.05) interactions with diabetes are indicated with an asterisk in the diabetes subtable. Color shading indicates the strength of association (approximately one quarter of all cells are shaded in each color; Green: low; yellow: mild; orange: moderate; red: high). Units: eGFR (mL/min/1.73m2), ACR (mg/g). Abbreviations: Ref = reference group
Table 3.
Hazard ratios for AKI stratified by eGFR and albuminuria categories and by diabetes status for CKD cohorts.
| eGFR | No diabetes | Diabetes | ||||||||
|---|---|---|---|---|---|---|---|---|---|---|
| ACR/Dipstick | ACR/Dipstick | |||||||||
| <30/Dip “−/±” | 30–299/Dip “1+” | 300–999/Dip “2+” | 1000+/Dip “≥3+” | <30/Dip “−/±” | 30–299/Dip “1+” | 300–999/Dip “2+” | 1000+/Dip “≥3+” | |||
| ≥75 | 0.85 (0.26, 2.78) |
0.42 (0.21, 0.84) |
1.04 (0.25, 4.37) |
6.16 (0.35, 108.57) |
0.27 (0.08, 0.84) |
0.76 (0.54, 1.07) |
0.42 (0.33, 0.54) |
0.62 (0.37, 1.04) |
2.69 (0.99, 7.27) |
0.34 (0.28, 0.42) |
| 60–74 | 0.71 (0.15, 3.35) |
0.62 (0.26, 1.51) |
1.47 (0.20, 10.83) |
0.48 (0.20, 1.14) |
0.89* (0.69, 1.15) |
2.02 (0.27, 15.10) |
1.22 (0.50, 2.95) |
0.73 (0.10, 5.24) |
0.70 (0.53, 0.92) |
|
| 45–59 | Ref |
1.71 (1.19, 2.45) |
2.49 (1.44, 4.32) |
7.82 (2.63, 23.27) |
Ref | Ref |
1.60 (1.38, 1.86) |
2.26 (1.80, 2.84) |
5.34 (3.77, 7.57) |
Ref |
| 30–44 |
1.74 (1.19, 2.55) |
2.06 (1.28, 3.31) |
2.69 (1.28, 5.66) |
25.29 (6.37, 100.43) |
1.46 (1.10, 1.94) |
1.48 (0.98, 2.25) |
2.27 (1.86, 2.77) |
2.93 (1.59, 5.39) |
2.68* (0.77, 9.38) |
1.34 (1.03, 1.73) |
| 15–29 |
4.90 (2.91, 8.25) |
6.30 (3.72, 10.69) |
7.70 (3.68, 16.11) |
40.72 (14.03, 118.14) |
4.03 (2.90, 5.62) |
3.24 (2.37, 4.44) |
3.89 (2.19, 6.91) |
5.87 (1.25, 27.43) |
13.70 (2.73, 68.89) |
2.46 (1.83, 3.31) |
| Ref |
1.51 (1.17, 1.93) |
2.11 (1.48, 3.01) |
8.04 (4.46, 14.52) |
Ref |
1.38 (1.24, 1.54) |
1.84 (1.47, 2.31) |
3.23* (1.55, 6.71) |
|||
Hazard ratios which, compared to the reference category, are significantly (p<0.05) greater than 1 are in bold, and significant (p<0.05) interactions with diabetes are indicated with an asterisk in the diabetes subtable. Color shading indicates the strength of association (approximately one quarter of all cells are shaded in each color; Green: low; yellow: mild; orange: moderate; red: high). Units: eGFR (mL/min/1.73m2), ACR (mg/g). Abbreviations: Ref = reference group
Associations in individuals with and without hypertension
Lower eGFR and higher ACR were associated with greater risk of AKI in both individuals with and without hypertension in the general population cohorts (Figure 5). Compared to a common reference of eGFR 80 mL/min/1.73m2 in individuals without hypertension, individuals with hypertension had a higher risk of AKI at eGFR >60 mL/min/1.73m2 (Figure 5, left panel). However, individuals without hypertension had a steeper relative risk increase associated with lower eGFR at eGFR <75 mL/min/1.73m2 than those with hypertension, such that the risk of AKI became similar or even slightly lower in hypertensive than non-hypertensive individuals at eGFR <60 mL/min/1.73m2. When separate references were set at eGFR 80 mL/min/1.73m2 for hypertensive and non-hypertensive individuals to assess for multiplicative interaction, we identified a significant point-wise interaction at eGFR <70 mL/min/1.73m2 (Figure 6, left panel). The overall interaction of hypertension with eGFR was significant (average relative HR for 15 mL/min/1.73m2 lower eGFR between individuals with hypertension versus those without hypertension 0.86; 95% CI 0.77–0.96). Although we found substantial heterogeneity of the overall interaction between individual studies (I2=79.9%), all cohorts showed a similar qualitative pattern with a weaker association for low eGFR in individuals with hypertension compared to those without hypertension (Figure S4).
Figure 5.
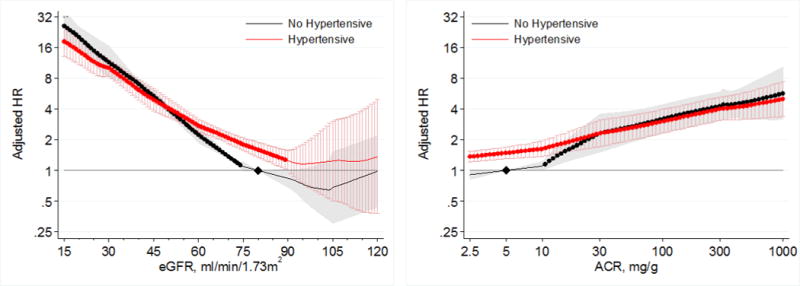
Hazard ratios (with 95% confidence intervals) of AKI, using common referent group without hypertension, according to eGFR (left, reference eGFR 80 without hypertension) and ACR (right, reference ACR 5 without hypertension) in individuals with and without hypertension in general population cohorts.
Figure 6.
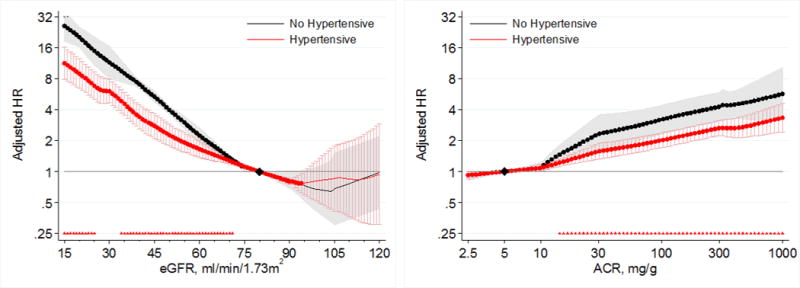
Hazard ratios (with 95% confidence intervals) of AKI, using seperate reference groups by hypertensive status, according to eGFR (left, reference eGFR 80) and ACR (right, reference ACR 5) in individuals with and without hypertension in general population cohorts.
When compared to a common reference point of ACR 5 mg/g in individuals without hypertension, individuals with hypertension had a higher risk of AKI than those without hypertension at ACR < 30 mg/g (Figure 5, right panel). However, individuals without hypertension had a steeper increase in relative risk in the range in ACR of 10–30 mg/g, such that the risks of AKI became similar at and above ACR 30 mg/g for individuals with and without hypertension. In analyses using separate references at ACR 5 mg/g for the hypertensive and non-hypertensive groups, we identified a significant multiplicative point-wise interaction when ACR exceeded 14 mg/g (Figure 6, right panel). The overall interaction of hypertension with ACR was not significant (average relative HR for 2.7 fold increase in ACR between individuals with hypertension versus those without hypertension 0.94; 95% CI 0.85–1.04), although there was high overall heterogeneity of the interaction between ACR and hypertension between individual studies (I2=80.7%). Five of six general population cohorts showed a weaker association between greater ACR and AKI in individuals with hypertension compared to those without hypertension (Figure S5).
Lower eGFR and higher albuminuria were also associated with increased risk of AKI in both hypertensive and non-hypertensive individuals in the CKD cohorts (Figure 7). Similar to findings at comparable ranges of eGFR and ACR in the general population cohorts, the risks of AKI were similar in hypertensive and non-hypertensive individuals across ranges of eGFR < 60 mL/min/1.73m2, and ACR > 10 mg/g in CKD cohorts (Figures 7 and 8).
Figure 7.
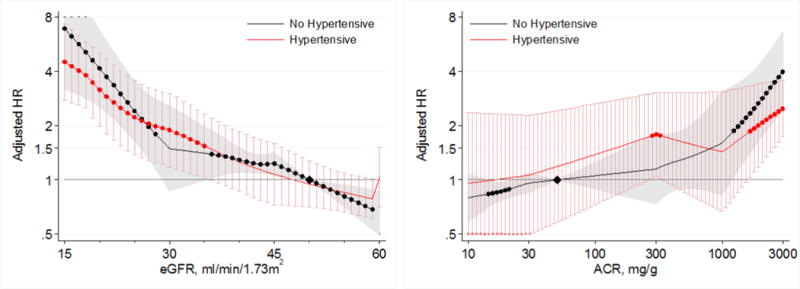
Hazard ratios (with 95% confidence intervals) of AKI, using common referent group without hypertension, according to eGFR (left, reference eGFR 50 without hypertension) and ACR (right, reference ACR 50 without hypertension) in individuals with and without hypertension in CKD cohorts.
Figure 8.
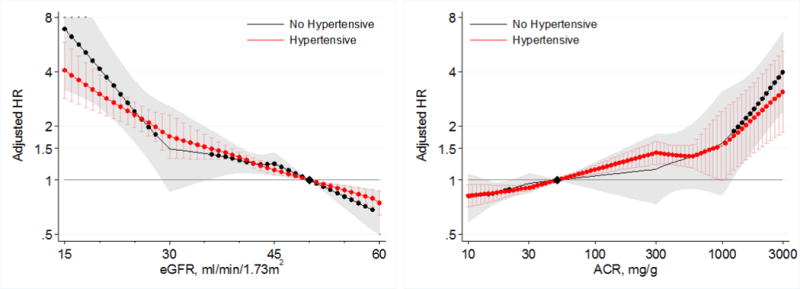
Hazard ratios (with 95% confidence intervals) of AKI, using, separate reference groups by hypertensive status, according to eGFR (left, reference eGFR 50) and ACR (right, reference ACR 50) in individuals with and without hypertension in CKD cohorts.
When hypertensive status was defined by blood pressure values alone (systolic/diastolic blood pressure ≥140/90 mm Hg), we observed similar findings to the primary analysis (Figures S6 and S7). Results were also fundamentally the same in individuals with and without a history of cardiovascular disease (Figure S8). Categorical analyses were consistent with the findings of the continuous analysis (Tables 4 and 5).
Table 4.
Hazard ratios for AKI stratified by eGFR and albuminuria categories and by hypertension status for general population cohorts.
| eGFR | No hypertension | Hypertension | ||||||||
|---|---|---|---|---|---|---|---|---|---|---|
| ACR/Dipstick | ACR/Dipstick | |||||||||
| <10/Dip “−” | 10–29/Dip “±” | 30–299/Dip “1+” | 300+/Dip “≥2+” | <10/Dip “−” | 10–29/Dip “±” | 30–299/Dip “1+” | 300+/Dip “≥2+” | |||
| >105 | 1.03 (0.67, 1.59) |
2.63 (1.09, 6.37) |
5.34 (2.44, 11.67) |
9.38 (3.85, 22.82) |
1.17 (0.74, 1.86) |
1.17 (0.61, 2.22) |
1.92 (0.98, 3.75) |
2.49 (1.02, 6.10) |
10.93* (4.00, 29.89) |
1.02 (0.60, 1.74) |
| 90–104 | 0.92 (0.70, 1.19) |
1.49 (0.70, 3.18) |
3.34 (1.92, 5.81) |
8.94 (6.72, 11.87) |
0.89 (0.69, 1.16) |
0.90 (0.74, 1.10) |
1.39 (1.03, 1.88) |
2.14* (1.79, 2.57) |
5.64* (3.71, 8.59) |
0.91 (0.69, 1.19) |
| 75–89 | Ref |
1.94 (1.59, 2.38) |
3.74 (3.06, 4.58) |
9.39 (7.17, 12.29) |
Ref | Ref |
1.75 (1.38, 2.22) |
2.64* (2.20, 3.17) |
4.82* (3.21, 7.23) |
Ref |
| 60–74 |
1.58 (1.42, 1.76) |
2.73 (2.22, 3.35) |
5.78 (4.74, 7.04) |
13.36 (9.13, 19.54) |
1.56 (1.43, 1.71) |
1.46 (1.34, 1.59) |
2.36 (1.81, 3.08) |
3.33* (2.56, 4.32) |
6.44* (4.66, 8.92) |
1.42 (1.29, 1.57) |
| 45–59 |
3.41 (2.87, 4.06) |
7.16 (5.42, 9.47) |
8.31 (5.73, 12.04) |
17.72 (13.77, 22.79) |
3.14 (2.57, 3.83) |
2.62* (2.03, 3.38) |
3.73* (2.84, 4.90) |
5.33 (3.65, 7.77) |
8.16* (5.34, 12.47) |
2.13* (1.77, 2.57) |
| 30–44 |
8.44 (7.08, 10.07) |
14.32 (11.02, 18.60) |
23.28 (17.67, 30.68) |
42.52 (19.10, 94.67) |
7.48 (5.87, 9.55) |
5.61* (4.24, 7.41) |
6.15* (4.13, 9.15) |
8.93* (6.77, 11.77) |
15.60 (10.23, 23.81) |
4.18* (3.62, 4.82) |
| 15–29 |
20.48 (15.51, 27.03) |
31.23 (19.51, 49.97) |
40.40 (26.37, 61.89) |
52.14 (38.05, 71.43) |
14.61 (10.52, 20.29) |
12.46 (10.08, 15.39) |
16.41* (8.11, 33.19) |
15.42* (10.48, 22.70) |
26.58* (17.35, 40.73) |
7.61* (6.43, 9.01) |
| Ref |
1.85 (1.38, 2.48) |
3.25 (2.60, 4.07) |
6.93 (5.88, 8.15) |
Ref |
1.46 (1.34, 1.60) |
2.03* (1.86, 2.23) |
3.20* (2.54, 4.03) |
|||
Hazard ratios which, compared to the reference category, are significantly (p<0.05) greater than 1 are in bold, and significant (p<0.05) interactions with hypertension are indicated with an asterisk in the hypertension subtable. Color shading indicates the strength of association (approximately one quarter of all cells are shaded in each color; Green: low; yellow: mild; orange: moderate; red: high). Units: eGFR (mL/min/1.73m2), ACR (mg/g). Abbreviations: Ref = reference group.
Table 5.
Hazard ratios for AKI stratified by eGFR and albuminuria categories and by hypertension status for CKD cohorts.
| eGFR | No hypertensive | Hypertensive | ||||||||
|---|---|---|---|---|---|---|---|---|---|---|
| ACR/Dipstick | ACR/Dipstick | |||||||||
| <30/Dip “−/±” | 30–299/Dip “1+” | 300–999/Dip “2+” | 1000+/Dip “≥3+” | <30/Dip “−/±” | 30–299/Dip “1+” | 300–999/Dip “2+” | 1000+/Dip “≥3+” | |||
| >75 | 0.51 (0.11, 2.26) |
0.39 (0.16, 0.92) |
1.16 (0.26, 5.20) |
0.31 (0.16, 0.63) |
0.77 (0.55, 1.08) |
0.42 (0.33, 0.54) |
0.60 (0.36, 1.00) |
4.30 (0.86, 21.66) |
0.35 (0.29, 0.42) |
|
| 60–74 | 0.71 (0.28, 1.80) |
1.80 (0.16, 20.54) |
3.55 (0.35, 36.10) |
0.75 (0.23, 2.37) |
1.28 (0.33, 4.97) |
0.93 (0.73, 1.19) |
1.06 (0.63, 1.77) |
0.68 (0.09, 4.85) |
0.64 (0.27, 1.53) |
|
| 45–59 | Ref |
1.98 (1.13, 3.45) |
3.27 (1.93, 5.54) |
5.68 (2.66, 12.11) |
Ref | Ref |
1.54 (1.32, 1.79) |
1.97 (1.56, 2.49) |
5.66 (3.33, 9.60) |
Ref |
| 30–44 |
1.93 (1.25, 2.98) |
2.43 (1.11, 5.35) |
3.43 (1.59, 7.43) |
54.62 (16.73, 178.27) |
1.50 (1.05, 2.15) |
1.45 (1.19, 1.77) |
2.21 (1.81, 2.69) |
2.60 (1.92, 3.52) |
2.61* (1.12, 6.09) |
1.36 (1.19, 1.55) |
| 15–29 |
3.81 (1.85, 7.87) |
7.75 (3.90, 15.41) |
10.41 (3.98, 27.20) |
107.42 (13.48, 856.23) |
3.55 (2.27, 5.55) |
3.68 (2.76, 4.92) |
3.86 (2.92, 5.10) |
7.05 (1.26, 39.49) |
14.79 (4.94, 44.28) |
2.61 (2.18, 3.13) |
| Ref |
1.67 (1.00, 2.77) |
2.52 (1.53, 4.17) |
5.88 (2.68, 12.93) |
Ref |
1.34 (1.20, 1.49) |
1.75 (1.31, 2.32) |
3.84 (2.19, 6.72) |
|||
Hazard ratios which, compared to the reference category, are significantly (p<0.05) greater than 1 are in bold, and significant (p<0.05) interactions with hypertension are indicated with an asterisk in the hypertension subtable. Color shading indicates the strength of association (approximately one quarter of all cells are shaded in each color; Green: low; yellow: mild; orange: moderate; red: high). Units: eGFR (mL/min/1.73m2), ACR (mg/g). Abbreviations: Ref = reference group
Discussion
In this meta-analysis, lower eGFR and higher levels of albuminuria were independently associated with increased risks of AKI in individuals with and without diabetes and hypertension, with the highest risks of AKI consistently observed in individuals with low eGFR and high albuminuria, regardless of the presence of absence of these conditions. Individuals with diabetes generally had higher risks of AKI compared to individuals without diabetes at any levels of eGFR, but this difference was attenuated in the lower range of eGFR. In contrast, there was no interaction between diabetes, ACR, and risk of AKI. Although the risks of AKI were increased in individuals with hypertension compared to those without hypertension at higher eGFR and lower ACR, larger relative risk increases at lower levels of eGFR led to comparable risks of AKI at eGFR < 60 mL/min/1.73m2 and ACR >30 mg/g in the presence and absence of hypertension. These findings demonstrate that although diabetes and hypertension are associated with heightened risks of AKI in the absence of measures of kidney disease, low eGFR and high ACR remain powerful prognostic markers for AKI in the presence or absence of these conditions.
The strengths of our study include the use of several international cohorts, including participants from the general population and with pre-existing CKD, thereby increasing the generalizability of our findings to other settings. All cohorts included comprehensive data on eGFR, ACR, diabetes, and hypertension, and continuous analyses using splines allowed us to perform a detailed characterization of the associations with AKI across a wide range of eGFR and ACR. There are limitations to our study. First, measurement of serum creatinine and albuminuria was not standardized across all studies, with collection performed prospectively for some cohorts and occurring as part of routine clinical care in others. As a result, the interpretation of eGFR and albuminuria thresholds where risk gradients appear to change should be made with some caution, although reassuringly the gradients of risk with lower eGFR and higher ACR were consistent between studies. Second, the presence of diabetes and hypertension was ascertained prospectively in some studies and from administrative codes in other cohorts. Variability in ascertainment of hypertension may explain between-study heterogeneity observed in the magnitude of the interaction terms between kidney markers and hypertension, although the point estimates from most individual studies included in the meta-analysis showed stronger relative risks in the absence of hypertension. As there was no heterogeneity of the interactions between kidney measures and diabetes, any differences in ascertainment of diabetes between studies are unlikely to have influenced our findings. Finally, we used administrative codes to identify AKI, which have low sensitivity but high specificity for AKI, and which may vary by baseline kidney function.25 Reassuringly, past work has shown that risk gradients for eGFR and albuminuria with AKI follow similar relationships for AKI treated with dialysis, which has high sensitivity for identification using administrative codes.10 While our findings are likely to be representative of risk for severe forms of AKI, they may not be generalizable to all forms of AKI, including milder events defined by smaller changes in creatinine.
Other studies have reported associations between reduced eGFR and albuminuria with the risk of AKI. Both eGFR and albuminuria have been previously associated with risk of AKI in three community-based cohorts from North America,7,9,10 as confirmed in an earlier analysis by the CKD Prognosis Consortium that was limited to 4 cohorts that examined the risk of AKI.27 Mild and heavy dipstick proteinuria, in addition to eGFR, has also been associated with higher odds of AKI in adults undergoing coronary artery bypass surgery.8 Several studies have also identified independent associations between diabetes and hypertension with the risk of AKI across a range of settings including sepsis, cardiovascular surgery, and coronary angiography.4,17,28,29 Our study builds on this prior work, providing new information about associations between kidney disease markers in both the presence and absence of these common conditions. Although many of the individual studies included in our analyses lacked power to detect significant interactions between diabetes and hypertension and eGFR or albuminuria, our meta-analysis allowed us to evaluate interactions across multiple cohorts and identify how these conditions modified the risk of AKI.
A possible reason for the higher risk of AKI in individuals with diabetes and hypertension at high eGFR and low ACR, is the frequent occurrence of complications of these conditions that may lead to AKI even in the absence of CKD.11 These include cardiovascular disease, heart failure, exposure to medications such as antihypertensive agents, diuretics, and potentially nephrotoxic drugs, episodes of sepsis, and increased exposure to surgical procedures or iodinated contrast agents. The attenuation of risk differences between individuals with hypertension, versus those without hypertension, with lower eGFR and higher ACR may be because these kidney measures incorporate the risks conferred by hypertension at low eGFR and high ACR. This may also explain the similarly observed attenuation of differences in risk of AKI between individuals with diabetes, versus those without diabetes, at low eGFR. In contrast, the absence of an interaction between ACR and diabetes on risk of AKI, suggest that additional features of diabetes may confer risk of AKI regardless of the level of ACR. Importantly, the observation that lower eGFR and higher ACR are associated with markedly elevated risks of AKI underscores the importance of kidney measures as risk factors for AKI, regardless of the presence of absence of these conditions.
In conclusion, this meta-analysis demonstrates that low eGFR and high albuminuria are associated with higher risks of AKI among people with or without either diabetes or hypertension. In non-diabetic patients the risk gradients for AKI with lower eGFR were stronger than in diabetic patients, but this was not true for higher ACR. For those without hypertension, there was a steeper risk gradient with both lower eGFR and higher ACR, compared to hypertensive persons. These findings suggest that future research on strategies to identify individuals at risk of AKI should incorporate measures of eGFR and albuminuria regardless of the presence of diabetes and hypertension, in order to target AKI prevention and care strategies to the highest risk individuals.
Supplementary Material
Acknowledgments
The CKD-PC Data Coordinating Center is funded in part by a program grant from the US National Kidney Foundation (NKF funding sources include AbbVie and Amgen) and the National Institute of Diabetes and Digestive and Kidney Diseases (R01DK100446-01). A variety of sources have supported enrollment and data collection including laboratory measurements, and follow-up in the collaborating cohorts of the CKD-PC. These funding sources include government agencies such as national institutes of health and medical research councils as well as foundations and industry sponsors listed in Appendix 3 p 6. The funders had no role in the design, analysis, interpretation of this study, and did not contribute to the writing of this report and the decision to submit the article for publication.
Footnotes
Contributors: Research idea and study design: MTJ, MEG, ASL, MS; data acquisition: MEG; data analysis/interpretation: MTJ, MEG, MW, CRE, JAG, DCW, PdJ, RTG, ASL, DGW, and MS; statistical analysis: MEG, MW; supervision or mentorship: ASL. Each author contributed important intellectual content during manuscript drafting or revision and accepts accountability for the overall work by ensuring that questions pertaining to the accuracy or integrity of any portion of the work are appropriately investigated and resolved. ASL takes responsibility that this study has been reported honestly, accurately, and transparently; that no important aspects of the study have been omitted, and that any discrepancies from the study as planned have been explained.
CKD-PC investigators/collaborators (study acronyms/abbreviations are listed in Appendix 1 p 2):
AKDN: Marcello Tonelli, Brenda R. Hemmelgarn, Matthew T. James, Tanvir Chowdhury Turin; ARIC: Josef Coresh, Kunihiro Matsushita, Morgan Grams, Yingying Sang; CHS: Michael Shlipak, Mark J Sarnak, Ronit Katz; CRIB: David C Wheeler, Jonathan Emberson, Jonathan N Townend, Martin J Landray; Geisinger: Jamie Green, H Les Kirchner, Robert Perkins, Alexander Chang; HUNT: Solfrid Romundstad, Knut Aasarød, Cecilia M. Øien, Stein Hallan; Kaiser Permanente NW: David H Smith, Micah L Thorp, Eric S Johnson; Maccabi: Gabriel Chodick, Varda Shalev, Esma Herzel, Rachel Katz; PREVEND: Ron T Gansevoort, Stephan JL Bakker, Hanneke Joosten, Pim van der Harst; Severance: Sun Ha Jee, Heejin Kimm, Ji Eun Yun; Sunnybrook: Navdeep Tangri, David Naimark; ULSAM: Johan Ärnlöv, Lars Lannfelt, Anders Larsson; VA CKD: Csaba P Kovesdy, Kamyar Kalantar-Zadeh
CKD-PC Steering Committee: Josef Coresh (Chair), Morgan Grams, Ron T Gansevoort, Paul E de Jong, Kunitoshi Iseki, Andrew S Levey, Kunihiro Matsushita, Mark J Sarnak, Benedicte Stengel, David Warnock, Mark Woodward
CKD-PC Data Coordinating Center: Shoshana H Ballew (Coordinator), Josef Coresh (Principal investigator), Morgan Grams, Kunihiro Matsushita (Director), Yingying Sang (Lead programmer), Mark Woodward (Senior statistician)
Financial disclosures: There are no conflicts
References
- 1.Waikar SS, Curhan GC, Wald R, McCarthy EP, Chertow GM. Declining mortality in patients with acute renal failure, 1988 to 2002. J Am Soc Nephrol. 2006 Apr;17(4):1143–1150. doi: 10.1681/ASN.2005091017. [DOI] [PubMed] [Google Scholar]
- 2.Xue JL, Daniels F, Star RA, et al. Incidence and mortality of acute renal failure in Medicare beneficiaries, 1992 to 2001. J Am Soc Nephrol. 2006;17(4):1135–1142. doi: 10.1681/ASN.2005060668. [DOI] [PubMed] [Google Scholar]
- 3.Hsu CY, McCulloch CE, Fan D, Ordonez JD, Chertow GM, Go AS. Community-based incidence of acute renal failure. Kidney Int. 2007 Jul;72(2):208–212. doi: 10.1038/sj.ki.5002297. [DOI] [PMC free article] [PubMed] [Google Scholar]
- 4.Waikar SS, Liu KD, Chertow GM. Diagnosis, epidemiology, and outcomes of acute kidney injury. Clin J Am Soc Nephrol. 2008;3:844–861. doi: 10.2215/CJN.05191107. [DOI] [PubMed] [Google Scholar]
- 5.Coca SG, Yusuf B, Shlipak MG, Garg AX, Parikh CR. Long-term risk of mortality and other adverse outcomes after acute kidney injury: a systematic review and meta-analysis. Am J Kidney Dis. 2009;53:961–973. doi: 10.1053/j.ajkd.2008.11.034. [DOI] [PMC free article] [PubMed] [Google Scholar]
- 6.Coca SG, Singanamala S, Parikh CR. Chronic kidney disease after acute kidney injury: a systematic review and meta-analysis. Kidney Int. 2012 Mar;81(5):442–448. doi: 10.1038/ki.2011.379. [DOI] [PMC free article] [PubMed] [Google Scholar]
- 7.Hsu CY, Ordonez JD, Chertow GM, Fan D, McCulloch CE, Go AS. The risk of acute renal failure in patients with chronic kidney disease. Kidney Int. 2008 Jul;74(1):101–107. doi: 10.1038/ki.2008.107. [DOI] [PMC free article] [PubMed] [Google Scholar]
- 8.Huang T, Wu V, Young G, et al. Preoperative proteinuria predicts adverse renal outcomes after coronary artery bypass grafting. J Am Soc Nephrol. 2011;22:156–163. doi: 10.1681/ASN.2010050553. [DOI] [PMC free article] [PubMed] [Google Scholar]
- 9.Grams ME, Astor BC, Bash LD, Matsushita K, Wang Y, Coresh J. Albuminuria and estimated glomerular filtration rate independently associate with acute kidney injury. J Am Soc Nephrol. 2010 Oct;21(10):1757–1764. doi: 10.1681/ASN.2010010128. [DOI] [PMC free article] [PubMed] [Google Scholar]
- 10.James MT, Hemmelgarn BR, Wiebe N, et al. Glomerular filtration rate, proteinuria, and the incidence and consequences of acute kidney injury: a cohort study. Lancet. 2010 Dec 18;376(9758):2096–2103. doi: 10.1016/S0140-6736(10)61271-8. [DOI] [PubMed] [Google Scholar]
- 11.Mahmoodi BK, Matsushita K, Woodward M, et al. Associations of kidney disease measures with mortality and end-stage renal disease in individuals with and without hypertension: a meta-analysis. Lancet. 2012;380(9854):1649–1661. doi: 10.1016/S0140-6736(12)61272-0. [DOI] [PMC free article] [PubMed] [Google Scholar]
- 12.Fox CS, Matsushita K, Woodward M, et al. Associations of kidney disease measures with mortality and end-stage renal disease in individuals with and without diabetes: a meta-analysis. Lancet. 2012;380(9854):1662–1673. doi: 10.1016/S0140-6736(12)61350-6. [DOI] [PMC free article] [PubMed] [Google Scholar]
- 13.Go AS, Chertow GM, Fan D, McCulloch CE, Hsu CY. Chronic kidney disease and the risks of death, cardiovascular events, and hospitalization. N Engl J Med. 2004 Sep 23;351(13):1296–1305. doi: 10.1056/NEJMoa041031. [DOI] [PubMed] [Google Scholar]
- 14.U.S. Renal Data System. USRDS 2013 Annual Data Report: Atlas of Chronic Kidney Disease and End-Stage Renal Disease in the United States. Bethesda, MD: National Institutes of Health, National Institute of Diabetes and Digestive and Kidney Diseases; 2013. [Google Scholar]
- 15.Matsushita K, Ballew SH, Astor BC, et al. Cohort Profile: The Chronic Kidney Disease Prognosis Consortium. Int J Epidemiol. 2013 Dec 12;42:1660–1668. doi: 10.1093/ije/dys173. [DOI] [PubMed] [Google Scholar]
- 16.Hemmelgarn BR, Manns BJ, Lloyd A, et al. Relation between kidney function, proteinuria, and adverse outcomes. JAMA. 2010 Feb 3;303(5):423–429. doi: 10.1001/jama.2010.39. [DOI] [PubMed] [Google Scholar]
- 17.Mehran R, Aymong ED, Nikolsky E, et al. A simple risk score for prediction of contrast-induced nephropathy after percutaneous coronary intervention: development and initial validation. J Am Coll Cardiol. 2004 Oct 6;44(7):1393–1399. doi: 10.1016/j.jacc.2004.06.068. [DOI] [PubMed] [Google Scholar]
- 18.Levey AS, Stevens LA, Schmid CH, et al. A new equation to estimate glomerular filtration rate. Ann Intern Med. 2009 May 5;150(9):604–612. doi: 10.7326/0003-4819-150-9-200905050-00006. [DOI] [PMC free article] [PubMed] [Google Scholar]
- 19.Matsushita K, Mahmoodi BK, Woodward M, et al. Comparison of risk prediction using the CKD-EPI equation and the MDRD study equation for estimated glomerular filtration rate. JAMA. 2012 May 9;307(18):1941–1951. doi: 10.1001/jama.2012.3954. [DOI] [PMC free article] [PubMed] [Google Scholar]
- 20.Levey AS, Coresh J, Greene T, et al. Expressing the Modification of Diet in Renal Disease Study Equation for Estimating Glomerular Filtration Rate with Standardized Serum Creatinine Values. Clin Chem. 2007 Apr 1;53(4):766–772. doi: 10.1373/clinchem.2006.077180. [DOI] [PubMed] [Google Scholar]
- 21.Lamb EJ, MacKenzie F, Stevens PE. How should proteinuria be detected and measured? Ann Clin Biochem. 2009 May;46(Pt 3):205–217. doi: 10.1258/acb.2009.009007. [DOI] [PubMed] [Google Scholar]
- 22.Konta T, Hao Z, Takasaki S, et al. Clinical utility of trace proteinuria for microalbuminuria screening in the general population. Clin Exp Nephrol. 2007 Mar;11(1):51–55. doi: 10.1007/s10157-006-0458-z. [DOI] [PubMed] [Google Scholar]
- 23.Hux J, Ivis F, Flintoft V, Bica A. Diabetes in Ontario: determination of prevalence and incidence using a validated administrative data algorithm. Diabetes Care. 2002;25(3):512–516. doi: 10.2337/diacare.25.3.512. [DOI] [PubMed] [Google Scholar]
- 24.Quan H, Khan N, Hemmelgarn B, et al. Validation of a case definition to define hypertension using administrative data. Hypertension. 2009;54(6):1423–1428. doi: 10.1161/HYPERTENSIONAHA.109.139279. [DOI] [PubMed] [Google Scholar]
- 25.Waikar SS, Wald R, Chertow GM, et al. Validity of International Classification of Diseases, Ninth Revision, Clinical Modification Codes for Acute Renal Failure. J Am Soc Nephrol. 2006 Jun;17(6):1688–1694. doi: 10.1681/ASN.2006010073. [DOI] [PubMed] [Google Scholar]
- 26.Hallan SI, Matsushita K, Sang Y, et al. Age and Association of Kidney Measures With Mortality and End-stage Renal Disease. JAMA. 2012 Oct 30;308(22):2349–2360. doi: 10.1001/jama.2012.16817. [DOI] [PMC free article] [PubMed] [Google Scholar]
- 27.Gansevoort RT, Matsushita K, van der Velde M, et al. Lower estimated GFR and higher albuminuria are associated with adverse kidney outcomes in both general and high-risk populations. A collaborative meta-analysis of general and high-risk population cohorts. Kidney Int. 2011 Jul;80(1):93–104. doi: 10.1038/ki.2010.531. [DOI] [PMC free article] [PubMed] [Google Scholar]
- 28.Bartholomew B, Harjai K, Dukkipati S, et al. Impact of nephropathy after percutaneous coronary intervention and a method for risk stratification. Am J Cardiol. 2004;93:1515–1519. doi: 10.1016/j.amjcard.2004.03.008. [DOI] [PubMed] [Google Scholar]
- 29.Kiers H, van den Boogaard M, Schoenmakers M, et al. Comparison and clinical suitability of eight prediction modesl for cardiac surgery-related acute kidney injury. Nephrol Dial Transplant. 2013;28:345–351. doi: 10.1093/ndt/gfs518. [DOI] [PubMed] [Google Scholar]
Associated Data
This section collects any data citations, data availability statements, or supplementary materials included in this article.


