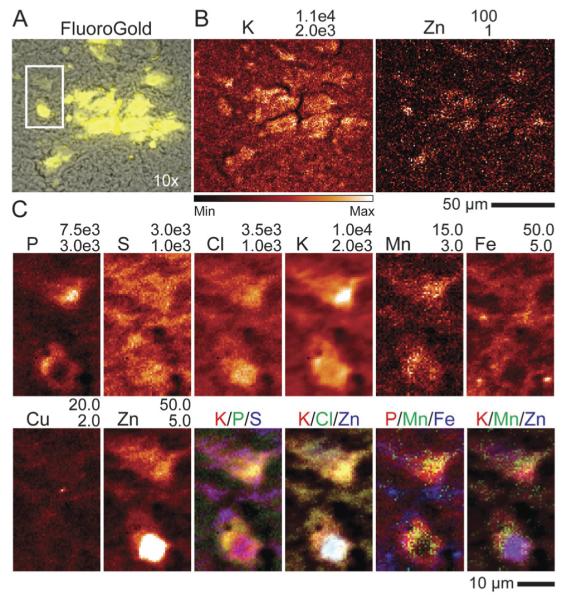
Fig. 3.

Optical and XRF imaging of FG, Mn treated rat brain. (A) Brightfield (BF) image of the SNc (gray) with FG fluorescence image overlayed (yellow). Not all dopaminergic cells of the SNc are FG positive. (B) Fly scan XRF image of K and Zn that assist in co-localizing XRF imaging with BF/FG optical images. Dashed white box indicates an area measured at high resolution which contains two cells (C). Example of XRF image recorded at subcellular resolution (0.5 μm × 0.5 μm). A high Zn content was taken to indicate the location of the nucleus. All numbers given are in μg g−1.
