

Abstract
Background and Purpose
There is current interest in vitamin D as a potential anti-inflammatory treatment for chronic inflammatory lung disease, including cystic fibrosis (CF). Vitamin D transcriptionally up-regulates the anti-inflammatory gene DUSP1, which partly controls production of the inflammatory chemokine IL-8. IL-8 is overabundant in CF airways, potentially due to hyperinflammatory responses of CF macrophages. We tested the ability of vitamin D metabolites to down-regulate IL-8 production in CF macrophages.
Experimental Approach
CF and healthy monocyte-derived macrophages (MDM) were treated with two vitamin D metabolites, 25-hydroxyvitamin D3 (25OHD3) and 1,25-dihydroxyvitamin D3 (1,25(OH)2D3), or paricalcitol, synthetic analogue of 1,25(OH)2D3. 25OHD3 was tested at doses of 25–150 nM, whereas 1,25(OH)2D3 and paricalcitol at doses of up to 100 nM. IL-8 was stimulated by bacterial virulence factors. As potential anti-inflammatory mechanism of vitamin D metabolites, we assessed up-regulation of DUSP1.
Key Results
MDM from patients with CF and some healthy donors showed excessive production of stimulated IL-8, highlighting their hyperinflammatory phenotype. Vitamin D metabolites down-regulated stimulated IL-8 only in those hyperinflammatory MDM, and only when used at high doses (>100 nM for 25OHD3, or >1 nM for 1,25(OH)2D3 and paricalcitol). The magnitude of IL-8 down-regulation by vitamin D metabolites or paricalcitol was moderate (∼30% vs. >70% by low-dose dexamethasone). Transcriptional up-regulation of DUSP1 by vitamin D metabolites was seen in all tested MDM, regardless of IL-8 down-regulation.
Conclusions and Implications
Vitamin D metabolites and their analogues moderately down-regulate IL-8 in hyperinflammatory macrophages, including those from CF. This down-regulation appears to go through DUSP1-independent mechanisms.
Tables of Links
| TARGETS |
|---|
| Nuclear hormone receptorsa |
| Vitamin D receptor |
| Enzymesb |
| CYP24A1 |
| CYP27B1 |
| LIGANDS |
|---|
| 1,25(OH)2D3, 1,25-dihydroxyvitamin D3 |
| 25OHD3, 25-hydroxyvitamin D3 |
| Paricalcitol |
| Vitamin D |
These Tables list key protein targets and ligands in this article which are hyperlinked to corresponding entries in http://www.guidetopharmacology.org, the common portal for data from the IUPHAR/BPS Guide to PHARMACOLOGY (Pawson et al., 2014) and are permanently archived in the Concise Guide to PHARMACOLOGY 2013/14 (a,bAlexander et al., 2013a,b).
Introduction
Vitamin D is a steroid hormone regulating bone health and is also considered to exert beneficial extra-skeletal effects (Holick, 2007), including anti-inflammatory effects. Vitamin D exists in the form of several metabolites, of which the circulating metabolite 25-hydroxyvitamin D3 (25OHD3) and the transcriptionally active metabolite 1,25-dihydroxyvitamin D3 (1,25(OH)2D3) are the most relevant ones for biological effects of this hormone. 25OHD3 is converted by the mitochondrial enzyme CYP27B1 in kidney and other tissues to 1,25(OH)2D3 (Figure 1). The latter exerts its biological effects mostly through binding to vitamin D receptor (Figure 1) and up-regulating transcription of vitamin D responsive genes, such as DUSP1 or hCAP18 (Figure 1). The effects of 1,25(OH)2D3 are limited by its catabolism by the mitochondrial enzyme CYP24A1 (Figure 1).
Figure 1.
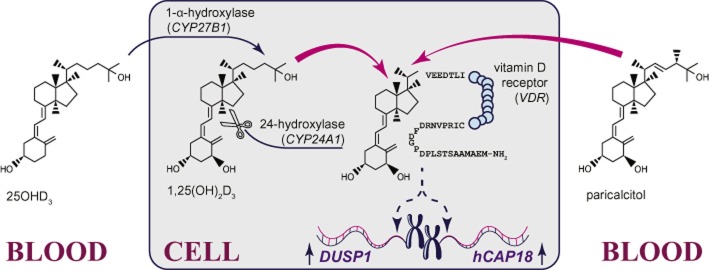
Vitamin D metabolism and signalling. The circulating metabolite of vitamin D (25OHD3) is converted to the transcriptionally active metabolite (1,25(OH)2D3) by the mitochondrial enzyme 1-α-hydroxylase (encoded by the gene CYP27B1). 1,25(OH)2D3 associates with the vitamin D receptor (gene: VDR) and cofactors (not shown), leading to transcriptional up-regulation of vitamin D responsive genes, such as anti-inflammatory DUSP1 and antibacterial hCAP18. The effects of 1,25(OH)2D3 are terminated by the mitochondrial enzyme 24-hydroxylase (encoded by the gene CYP24A1). Clinically, intracellular levels of 1,25(OH)2D3 can be augmented through supplementation with precursors of 25OHD3 or 25OHD3 directly. In contrast, direct supplementation with 1,25(OH)2D3 is not practical due to hypercalcaemia and hyperphosphatemia caused by high doses of this metabolite. However, low calcemic synthetic analogues of 1,25(OH)2D3 (e.g. paricalcitol) can be used to activate the vitamin D receptor and up-regulate transcription of vitamin D responsive genes.
DUSP1 encodes a homonymous anti-inflammatory phosphatase (Abraham and Clark, 2006; Wang and Liu, 2007). Experimental evidence indicates that anti-inflammatory effects of vitamin D may involve DUSP1 (Zhang et al., 2012). DUSP1 partly controls production of the pro-inflammatory chemokine IL-8 (Dauletbaev et al., 2011) and mediates, to some extent, IL-8 down-regulation by corticosteroids (Dauletbaev et al., 2011; Shah et al., 2014). Therefore, it is plausible to assume that vitamin D metabolites could also down-regulate IL-8.
Such down-regulation of IL-8 would benefit many chronic inflammatory lung diseases, including cystic fibrosis (CF). CF is a genetic multi-organ disease with lifelong hyperinflammation in the airways, and IL-8 is overabundant in airway secretions of these patients (Balough et al., 1995; Bonfield et al., 1995; Khan et al., 1995; Rosenfeld et al., 2001; McGarvey et al., 2002; Kieninger et al., 2013). Although supplementation with vitamin D is routinely recommended for all patients with CF (Tangpricha et al., 2012), this is primarily on order to control CF-associated bone disease (Grey et al., 2008). In contrast, potential ability of vitamin D to modulate inflammation in CF, for instance by down-regulating IL-8 production, has not been systematically tested. It is also unclear whether the recommended circulating levels of 25OHD3 of 50 nM [Institute of Medicine (US) Committee to Review Dietary Reference Intakes for Vitamin D and Calcium, 2011] or 75 nM (Holick et al., 2011) are sufficient to modulate IL-8.
To address these questions, we evaluated the down-regulation of IL-8 by vitamin D metabolites in primary cultures of macrophages from patients with CF and healthy subjects. Macrophages are innate immune cells resident to the airways under physiological conditions and recruited from blood monocytes during inflammation. Macrophages play a pivotal role in bacterial clearance (Lovewell et al., 2014) but may also contribute to airway inflammation (Khan et al., 1995). CF macrophages are considered by many researchers (Kopp et al., 2012; Simonin-Le Jeune et al., 2013; Zhang et al., 2013) as intrinsically hyperinflammatory.
The present study addressed the following three objectives. First, we tested whether macrophages from patients with CF adequately express the genes CYP27B1, VDR and CYP24A1 that would be required for down-regulation of IL-8 by vitamin D metabolites. Next, we evaluated how efficiently two vitamin D metabolites, 25OHD3 and 1,25(OH)2D3, would down-regulate IL-8 production in CF macrophages stimulated with bacterial virulence factors. Finally, we examined whether down-regulation of IL-8 by vitamin D metabolites would be associated with up-regulation of DUSP1.
Methods
Isolation of monocytes and culture of monocyte-derived macrophages (MDM)
The use of venous blood from patients with CF or healthy donors to obtain monocytes or MDM was approved by the Human Ethics Board of McGill University Health Centre, and all donors gave written informed consent.
We isolated monocytes as peripheral mononuclear cells from heparin-treated blood using the Ficoll-Paque (GE Healthcare Life Sciences, Mississauga, Canada) protocol. In some experiments, monocytes were further purified using the negative selection Dynabeads Untouched Human Monocytes kit (Life Technologies, Burlington, Canada), according to the manufacturer's instructions. Purified monocytes were used directly in downstream assays, as described below. In the majority of experiments, monocytes were matured to MDM according to the following protocol.
After the Ficoll-Paque isolation, peripheral mononuclear cells were plated onto 96-well plates (Fisher Scientific, Ottawa, Canada) at a concentration of 2.5 × 10⁶ cells·mL−1 and allowed to attach for 3 days in RPMI1640 (Life Technologies) supplemented with 10% normal FBS (Wisent; Saint-Jean-Baptiste, Canada), antibiotics (Life Technologies), and 40 ng·mL−1 of M-CSF (Peprotech; Dollard des Ormeaux, Canada; Figure 2). Then, half the volume of the cell supernatant was removed and replaced with fresh culture medium. After 1 week, culture medium was removed entirely and replaced with RPMI1640 with 10% of either normal or charcoal-depleted FBS (Hyclone, Fisher Scientific), antibiotics, M-CSF (Figure 2). After 3 days, half volumes of cell supernatants were replaced with fresh culture medium. After another 3 days, cell supernatants were removed entirely, cells were washed once with PBS to remove any remaining non-adherent cells, and supplemented with respective culture medium (Figure 2).
Figure 2.
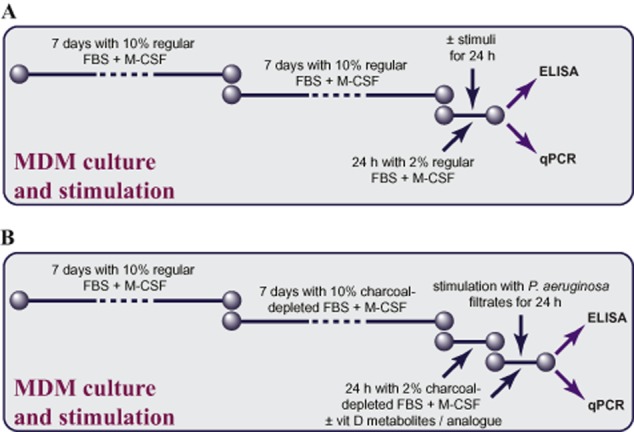
Study design. (A) Study design for experiments testing expression of VDR, CYP27B1 and CYP24A1, and experiments testing bacterial virulence factors. MDM were prepared from peripheral blood mononuclear cells and differentiated for 14 days in RPMI1640 supplemented with normal FBS, antibiotics and 40 ng·mL−1 of M-CSF. After maturation, MDM were either collected for qPCR analysis of expression of vitamin D-related genes VDR, CYP27B1 and CYP24A1, or stimulated with bacterial virulence factors (stimuli) for 24 h in antibiotic-free RPMI1640 supplemented with 2% normal FBS and M-CSF. Afterwards, cell supernatants were collected for IL-8 elisa. (B). Study design for experiments testing down-regulation of IL-8 by the two vitamin D metabolites – 25OHD3 or 1,25(OH)2D3 – or the analogue paricalcitol. MDM were prepared from peripheral blood mononuclear cells and differentiated for 7 days in RPMI1640 supplemented with antibiotics, normal FBS and M-CSF. Then, normal FBS was replaced by charcoal-depleted FBS (week 2) to minimize potential confounding effects of vitamin D metabolites present in animal serum. After maturation, MDM were cultured for 24 h in RPMI1640 supplemented with 2% charcoal-depleted FBS, M-CSF, diluent or vitamin D (vit D) metabolites/analogue. Then, MDM received fresh dilutions of the tested compounds and were stimulated for 24 h with diluted (1:100) sterile filtrates of P. aeruginosa culture. Afterwards, cell supernatants were collected for IL-8 elisa, while cells were lysed and subjected to qPCR to quantify expression of DUSP1 and hCAP18.
After MDM differentiation for 2 weeks, culture medium was replaced with experimental culture medium and the cells were used in experiments (Figure 2). After a 24 h pretreatment, MDM were stimulated with bacterial virulence factors, as described below, in experimental culture medium (Figure 2). These MDM are equivalent to the M2 macrophage phenotype, prevalent in CF airway secretions (Murphy et al., 2010).
Preparation of sterile filtrates of Pseudomonas aeruginosa culture
We used sterile filtrates of Pseudomonas (P.) aeruginosa as a stimulus for the majority of the experiments. These filtrates were prepared as described previously (Berube et al., 2010), aliquoted, and stored at −20°C until used for stimulation. In some experiments, we used P. aeruginosa flagellin (Invivogen, San Diego, CA, USA), conventional purity and ultrapure Escherichia (E.) coli lipopolysaccharide (LPS; Invivogen), and recombinant human IL-1β (BD Biosciences, Mississauga, Canada).
Downstream assays
Plasma samples from healthy individuals and patients with CF were analysed for circulating levels of 25OHD3 using an elisa assay from Enzo Life Sciences (Farmingdale, NY, USA) according to the manufacturer's instructions.
The IL-8 contents of supernatants from MDM cultures were quantified using an IL-8 elisa set (BD Biosciences). To account for well-to-well differences in MDM numbers, we used two wells per each experimental condition. Supernatants from replicate wells were analysed separately; average IL-8 values were calculated for each set of replicate wells and used in the final analyses.
For analyses of gene expression, MDM were lysed in lysis buffer RLT (Qiagen, Toronto, Canada). Lysates from duplicate wells were combined to yield sufficient RNA levels, and subjected to RNA isolation (RNeasy Micro kit; Qiagen), reverse transcription (Quantitect RT kit; Qiagen) and qPCR (Quantifast SYBR Green PCR kit; Qiagen). Most primers for qPCR were from Qiagen. Expression of CYP27B1 mRNA was quantified using either Quantifast SYBR Green PCR kit and primers from Qiagen, or TaqMan probe-based primer assay (Life Technologies). Genes of interests were expressed in % of expression of ACTB, the gene encoding β-actin. Monocytes isolated by negative selection were lysed, and subjected to RNA isolation, reverse transcription and qPCR, similarly to MDM.
In some experiments, monocytes and MDM were lysed using RIPA buffer: 50 mM Tris–HCl, pH 7.5, 1 mM EDTA, 150 mM NaCl, 0.1% lauryl sulphate, 0.5% deoxycholic acid, 1% Igepal CA-630, protein inhibitors (Sigma-Aldrich, Mississauga, Canada). These lysates were used in Western blots. Briefly, protein concentrations were quantified and normalized. Samples containing 10 μg of total protein were first denaturated by 1 min incubation at 95°C with denaturating and reducing sample buffer, separated electrophoretically on 10% gels, and transferred onto PVDF membranes (40 V, 90 min). The membranes were blocked for 1 h at room temperature with 5% non-fat dry milk in Tris-buffered saline (0.1% Tween), incubated overnight at 4°C with a 1:500 diluted rabbit polyclonal antibody against CYP27B1 (Abcam; Toronto, Canada), washed extensively, probed for 45 min with a 1:5000 diluted goat anti-rabbit secondary antibody (Cell Signaling, Danvers, MA, USA), and washed extensively again. Protein bands were visualized using Western Lightning Plus ECL (Perkin-Elmer, Woodbridge, Canada) and ChemiDoc imaging system (Bio-Rad, Missisauga, Canada). Western blot images were exported as TIFF files to Adobe Photoshop (Creative Suite 5.0; Adobe, San Jose, CA, USA). Only linear adjustments of contrast and non-obscuring cropping of the bands of interest were applied to those images.
Data analysis
Statistical analyses were conducted using GraphPad Prism (GraphPad Software, La Jolla, CA, USA) and included descriptive statistics, parametric or non-parametric one- or two-way anova comparisons with Tukey or Dunn's post hoc tests, or Wilcoxon signed-rank or the Mann–Whitney U-test. Absolute values of IL-8 production, IL-8 down-regulation by dexamethasone, and expression of genes of interest in monocytes and MDM were presented as box-and-whisker plots (median, interquartile range and min–max values). Inhibition curves were presented as medians and interquartile ranges of either absolute IL-8 concentrations, or as % of remaining IL-8, versus concentration of the studied compound. The logistic regression analysis of concentration–response to vitamin D metabolites was carried out as previously described (Dauletbaev et al., 2011). The level of statistical confidence was set at P < 0.05.
Materials
Most cell culture supplies were from Life Technologies. Synthetic vitamin D metabolites (25OHD3 and 1,25(OH)2D3) were purchased from, respectively, EMD Millipore (Billerica, MA, USA) and Sigma-Aldrich. Their stock solutions (100 μM each) were prepared in 95% ethanol and stored at −20°C. Paricalcitol, a low-calcemic analogue of 1,25(OH)2D3, was a kind gift from AbbVie (North Chicago, IL, USA). Its stock solution was prepared at 100 μM in 100% ethanol and stored at −80°C. Dexamethasone was from Sigma-Aldrich; the 1 mM stock solution was prepared in 100% ethanol and stored at −20°C. Gel electrophoresis supplies (BupH Tris-HEPES-SDS running buffer, BupH Tris-glycine transfer buffer, and 10% Pierce Precise precast protein gels) were from Fisher Scientific, Life Technologies (Magic Mark XP Western Protein Standard), or Bio-Rad. Unless specified, all other supplies were from Sigma-Aldrich.
Results
Expression of vitamin D-related genes in monocytes and MDM
We used cells from 16 healthy individuals (Table 1) and 8 patients with CF (Table 2). Patients with CF were mostly homozygous for the delF508 mutation, which is the most common mutation in Europe and North America. The patients were in clinical remission; all of them received vitamin D supplementation (Table 2).
Table 1.
Demographic characteristics, enrolment season and plasma levels of 25OHD3 of healthy individuals
| ID | Ethnicity | Enrolment season | Plasma level of 25OHD3 (nM) | Vitamin D supplementation |
|---|---|---|---|---|
| 1 | Caucasian | Fall | 5.3 | None |
| 2 | Caucasian | Summer | 50.8 | None |
| 3 | Caucasian | Summer | 26.8 | None |
| 4 | Caucasian | Fall | Not enough sample | None |
| 5 | Caucasian | Winter | Undetectable | None |
| 6 | Caucasian | Fall | 32.8 | None |
| 7 | Caucasian | Summer | 44.0 | None |
| 8 | Caucasian | Summer | 94.9 | None |
| 9 | Caucasian | Summer | 32.3 | None |
| 10 | Caucasian | Fall | 33.1 | None |
| 11 | Caucasian | Fall | 130.2 | None |
| 12 | Caucasian | Fall | 50.4 | None |
| 13 | Caucasian | Fall | 40.1 | None |
| 14 | Caucasian | Winter | 59.1 | None |
| 15 | Caucasian | Summer | Undetectable | None |
| 16 | Caucasian | Summer | 28.6 | None |
Table 2.
Demographic characteristics, enrolment season, and plasma levels of 25OHD3 of patients with CF
| ID (CF genotype) | Age | Ethnicity | Enrolment season | Chronic infection with Pseudomonas aeruginosa | Plasma level of 25OHD3 (nM) | Vitamin D supplementation | Pulmonary function (FEV1, % predicted) |
|---|---|---|---|---|---|---|---|
| 1 (delF508/delF508) | 26 | Caucasian | Fall | No | 108 | 800 IU q.d. | 81 |
| 2 (delF508/delF508) | 29 | Caucasian | Fall | Yes | 42 | 1000 IU q.d. | 86 |
| 3 (delF508/delF508) | 25 | Caucasian | Fall | Unknown | 88 | 1000 IU q.d. | 58 |
| 4 (delF508/Y1092X) | 28 | Caucasian | Fall | Yes | 77 | 400 IU q.d. | 29 |
| 5 (delF508/G85E) | 24 | Caucasian | Winter | No | 75 | 1000 IU q.d. | 20 |
| 6 (delF508/delF508) | 31 | Caucasian | Winter | Yes | 32 | 1000 IU q.d. | 89 |
| 7 (delF508/delF508) | 27 | Caucasian | Spring | Yes | 37 | 1000 IU q.d. | 44 |
| 8 (delF508/delF508) | 26 | Caucasian | Spring | Yes | 69 | 1000 IU q.d. | 25 |
We first evaluated expression of vitamin D-related genes CYP27B1, VDR and CYP24A1 in monocytes and MDM, as both these cell types are targeted by vitamin D metabolites. Both healthy and CF monocytes demonstrated comparable levels of VDR expression (respectively Figure 3A, B), while expressions of CYP27B1 and CYP24A1 were non-detectable in both monocyte populations (Figure 3A, B). We next assessed MDM for expression of the above genes. MDM expressed VDR at the levels comparable to the expression in monocytes (Figure 3C, D vs. Figure 3A, B); there was no difference in expression of VDR between healthy and CF MDM (respectively Figure 3C, D). In contrast to monocytes, MDM expressed detectable levels of CYP27B1 (Figure 3C, D vs. Figure 3A, B), with no detectable difference between healthy and CF MDM in expression of this gene. However, MDM expressed CYP24A1 at low levels, similar to monocytes, (Figure 3C, D). Again, a similar trend was seen in both healthy and CF MDM.
Figure 3.
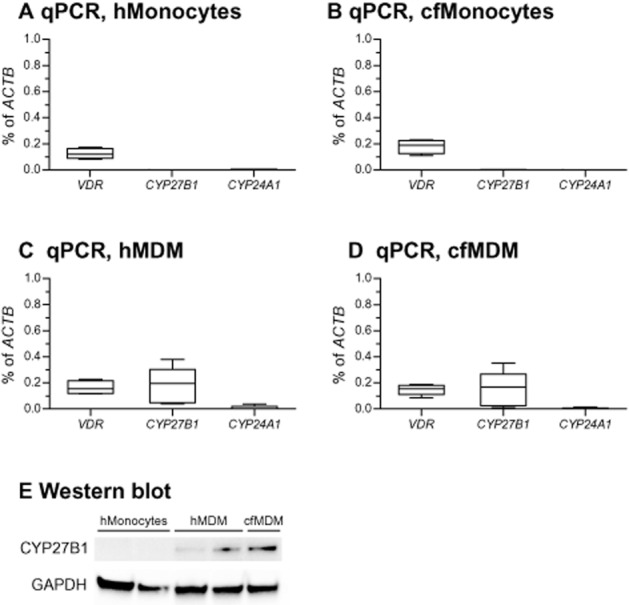
Expressions of genes related to vitamin D metabolism and signalling. (A and B) Healthy and CF monocytes (hMonocytes and cfMonocytes) were isolated and subjected to qPCR. Expressions of the genes of interest (VDR: vitamin D receptor gene; CYP27B1: gene encoding 1-α-hydroxylase that converts 25OHD3 to 1,25(OH)2D3; CYP24A1: gene encoding 24-hydroxylase that deactivates 1,25(OH)2D3) were normalized to expression of ACTB (gene encoding β-actin). Data are presented as box-and-whisker plots (medians, interquartile ranges and min–max values). (C and D) MDM were obtained from healthy individuals (hMDM) or patients with CF (cfMDM) and subjected to qPCR. Expressions of the genes of interest were normalized as in (A) and (B). Data are presented as box-and-whisker plots (medians, interquartile ranges and min–max values). (E) A representative Western blot demonstrating intracellular expression of 1-α-hydroxylase (CYP27B1) in hMonocytes, hMDM and cfMDM. GAPDH served as a gel-loading control.
We next confirmed the expression levels of CYP27B1 using TaqMan probe-based qPCR to warrant higher specificity. TaqMan qPCR yielded results similar to those presented in Figure 3 (data not shown). This indicated that expression of this gene is initiated during monocyte maturation to MDM. This maturation-related phenomenon was also observed by others (Kreutz et al., 1993; Gottfried et al., 2006). We also confirmed the mRNA results at the protein level, comparing expression of corresponding protein in monocytes with that in MDM by Western blot analysis. In agreement with qPCR results, monocytes lacked protein expression, while both healthy and CF MDM expressed it at detectable levels (Figure 3E).
Basal and stimulated IL-8 production in healthy and CF MDM
To test for the hyperinflammatory phenotype of CF MDM, we compared the basal and stimulated IL-8 production between healthy and CF MDM. As a bacterial virulence stimulus, we selected sterile filtrates of P. aeruginosa, which stimulated robust secretion of IL-8 in MDM. For the reasons for the use of these filtrates and validating experiments, please refer to Supplementary Results and Supporting Information Fig. S1.
We observed that basal IL-8 production was significantly higher in CF MDM (Figure 4A), compared with healthy MDM, supporting the notion that CF cells may be hyperinflammatory. We next stimulated healthy and CF MDM with sterile P. aeruginosa filtrates. Again, the responses of stimulated CF MDM tended to be higher than those of healthy MDM (Figure 4B), indicating that CF MDM exhibit a hyperinflammatory phenotype.
Figure 4.

Basal and stimulated IL-8 production. (A) Healthy and CF MDM (hMDM and cfMDM) were tested for basal IL-8 production. IL-8 levels in cell supernatants were quantified by elisa. *P < 0.05. Data are presented as box-and-whisker plots (medians, interquartile ranges and min–max values) of cultures from 16 healthy individuals and 8 patients with CF. (B) The above hMDM and cfMDM were stimulated with diluted (1:100) sterile filtrates of P. aeruginosa culture. IL-8 levels in cell supernatants were quantified by elisa. Data are presented as box-and-whisker plots (medians, interquartile ranges and min–max values).
Down-regulation of stimulated IL-8 by 25OHD3
We next assessed down-regulation of IL-8 by the circulating metabolite 25OHD3. MDM were supplemented with 25OHD3 at the physiological (25, 50 and 75 nM) or supraphysiological (100 and 150 nM) concentrations, followed by stimulation with P. aeruginosa filtrates. The highest 25OHD3 concentration of 150 nM was set twofold higher than the maximal recommended concentration (Holick et al., 2011). The inhibitory effects of 25OHD3 on IL-8 secretion were measured against ethanol as diluent. Ethanol was added to control wells at the same concentration as that in the wells exposed to 150 nM of 25OHD3.
Analysing the down-regulation of absolute IL-8 by the top concentration of 25OHD3, we noticed that half of healthy MDM did not down-regulate IL-8, while the other half demonstrated a significant down-regulation of >20% (Figure 5A). Interestingly, the latter MDM, which we dubbed as ‘responder’ MDM, produced significantly higher levels of stimulated IL-8, compared with ‘non-responder’ MDM (respective median values of 174635 and 41843 pg·mL−1, P < 0.01; Figure 5A). ‘Non-responder’ MDM mildly, but significantly, up-regulated stimulated IL-8, when treated with 25OHD3 (Figure 5A). In contrast, ‘responder’ MDM showed moderate and significant down-regulation of absolute IL-8 levels, especially on 150 nM of 25OHD3 (Figure 5A). Furthermore, as evident from the analysis of IL-8 levels relative to diluent, treatment with 150 nM of 25OHD3 mildly up-regulated IL-8 levels in ‘non-responder’ MDM (Figure 5B), but down-regulated IL-8 in ‘responder’ MDM by about 30% (Figure 5C).
Figure 5.
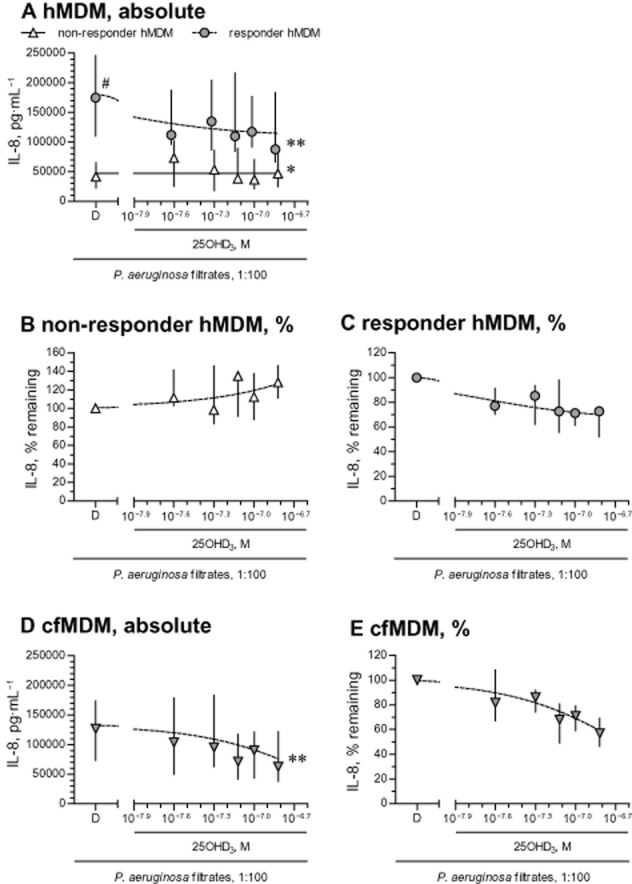
Down-regulation of stimulated IL-8 by 25OHD3. (A) MDM from 16 healthy individuals (hMDM) were pretreated with diluent (D) or 25OHD3, and stimulated with diluted (1:100) sterile filtrates of P. aeruginosa culture. IL-8 levels in cell supernatants were quantified by elisa. hMDM from seven healthy individuals that showed a >20% down-regulation of stimulated IL-8 on incubation with the highest concentration of 25OHD3 (150 nM = 10−6.82 M) were defined as ‘responder’ hMDM, while other (n = 8) hMDM with a <20% down-regulation or, in some cases, an up-regulation, were considered as ‘non-responder’ hMDM. One hMDM culture did not yield sufficient number of wells to test the entire concentration range and was excluded from the analysis. To prevent overlap of error bars, the symbols were slightly set apart along the X-axis on panel (A). Panels (B) and (C) represent down-regulation of stimulated IL-8 relative to diluent in respectively ‘non-responder’ and ‘responder’ hMDM. Cultures of MDM obtained from eight patients with CF (cfMDM), were treated in the same way as the hMDM and the corresponding absolute (D) and relative (E) inhibition of stimulated IL-8 release by 25OHD3 are shown here. Data in panels (A)–(E) are presented as medians and interquartile ranges (symbols and bars); lines are logistic concentration–response curves. #P < 0.01, significantly different from non-responder diluent values; *P < 0.05, **P < 0.01; significantly different from corresponding diluent values.
There was no such heterogeneity of responsiveness to 25OHD3 in CF MDM samples, as all the CF cells showed a uniform response to 25OHD3 (Figure 5D). In addition, all tested CF MDM showed high absolute levels of stimulated IL-8 (median value of 126 727 pg·mL−1; Figure 5D), and these were comparable to those of the healthy ‘responder’ MDM (Figure 5A). In addition, as seen with the healthy ‘responder’ MDM, CF cells down-regulated their relative production of stimulated IL-8 by nearly 40% when treated with 150 nM of 25OHD3 (Figure 5E).
Stratification of MDM by their responsiveness to 25OHD3
The above experiments described above showed that the effects of 25OHD3 on IL-8 secretion were moderate and individualized, in that they were present only in MDM that produced high levels of IL-8 when stimulated with P. aeruginosa filtrates (i.e. hyperinflammatory MDM). To further explore the association between the magnitude of stimulated IL-8 production and responsiveness to 25OHD3, we stratified basal and stimulated output of IL-8 from healthy MDM, based on their responsiveness to 25OHD3.
According to this stratification, healthy ‘responder’ MDM tended to exhibit higher basal IL-8 production (Figure 6A) and significantly higher values of stimulated IL-8 (Figure 6B), compared with healthy ‘non-responder’ MDM (respectively Figure 6A, B). Further supporting an association between the magnitude of stimulated IL-8 and responsiveness to 25OHD3, healthy ‘responder’ MDM produced IL-8 at the levels comparable to those of CF MDM (Figure 6B).
Figure 6.
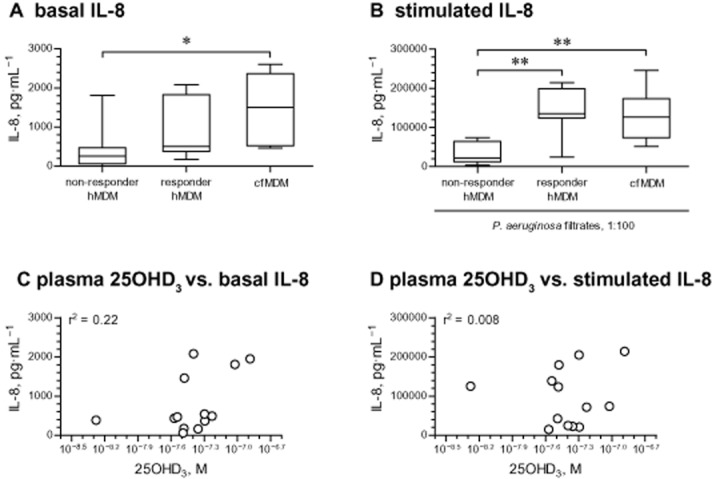
Stratification of healthy MDM on the basis of their responsiveness to IL-8 down-regulating effects of 25OHD3. (A) Basal IL-8 levels in eight ‘non-responder’ and seven ‘responder’ healthy MDM (hMDM), stratified by the inhibition of IL-8 release by 25OHD3. IL-8 levels in cell supernatants were quantified by elisa. The responsiveness was defined as a >20% down-regulation of stimulated IL-8 by 150 nM of 25OHD3 (Figure 5A). *P < 0.05. (B) Levels of IL-8 after stimulation with diluted (1:100) sterile filtrates of P. aeruginosa culture. The hMDM cultures were stratified based on responsiveness in terms of the down-regulation of IL-8 by 25OHD3 as defined on panel (A). In both panels (A) and (B), IL-8 production in cfMDM from seven patients with CF is shown as comparison. **P < 0.01. Data on panels (A) and (B) are presented as box-and-whisker plots (medians, interquartile ranges and min–max values). (C) Association between circulating levels of 25OHD3 in plasma specimens from healthy individuals and basal IL-8 production in their MDM. The levels of 25OHD3 in plasma specimens and IL-8 in cell supernatants were quantified by respective elisas. Two plasma specimens yielded 25OHD3 levels greatly below the level of detection of the elisa and were excluded from the analysis. One healthy individual did not produce blood specimen to obtain sufficient quantity of plasma for 25OHD3 elisa. Thus, the final analysis included cultures from 13 healthy subjects with plasma levels of 25OHD3 ranging from 5.3 nM (10−8.23 M) to 130 nM (10−6.89 M). (D) Association between circulating levels of 25OHD3 in plasma specimens from healthy individuals and IL-8 production stimulated with diluted (1:100) sterile filtrates of P. aeruginosa culture. All MDM cultures and analyses were as in (C).
We next tested whether there was an association between circulating levels of 25OHD3 in the blood samples from which the MDM were derived, and IL-8 production in these MDM. We measured the levels of 25OHD3 in blood plasma of the healthy donors (Table 1), and plotted them against basal (Figure 6C) and stimulated (P. aeruginosa filtrates; Figure 6D) IL-8 production by their MDM. As shown, circulating levels of 25OHD3 did not predict subsequent IL-8 production of healthy MDM. Mesurements in the CF samples showed a similar lack of correlation between endogenous 25OHD3 levels and output of IL-8 from MDM (data not shown).
Down-regulation of IL-8 by 1,25(OH)2D3 or its synthetic analogue paricalcitol
In the preceding set of experiments, stimulated IL-8 production in ‘non-responder’ MDM was not affected by 25OHD3. It was possible that this reflected less efficient conversion of 25OHD3 to transcriptionally active 1,25(OH)2D3 in ‘non-responder’ MDM. To test this, we treated MDM with 1,25(OH)2D3, the transcriptionally active metabolite, before stimulation with the filtrates of P. aeruginosa. CF MDM were not tested here, as all samples of these cells were ‘responders’ to 25OHD3 in the preceding experiments.
As before, we observed two distinct populations of MDM, either responding or not responding to 1,25(OH)2D3, in terms of IL-8 release. Similar to previous findings, ‘non-responder’ MDM exhibited lower absolute production of stimulated IL-8 (Figures 7A and B). Furthermore, as with 25OHD3, ‘non-responder’ MDM showed some up-regulation of IL-8 secretion when treated with 1,25(OH)2D3 (10 and 100 nM; Figure 7A). In contrast, ‘responder’ MDM uniformly showed down-regulation of stimulated IL-8 (Figure 7B), with the greatest effect of about 40% inhibition, at 100 nM 1,25(OH)2D3.
Figure 7.
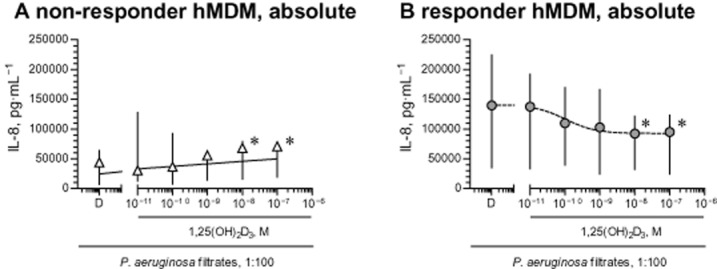
Down-regulation of stimulated IL-8 by 1,25(OH)2D3. (A and B) Healthy ‘non-responder’ (n = 7) and ‘responder’ (n = 7) MDM (hMDM) were pretreated with diluent (D) or 1,25(OH)2D3 and stimulated with diluted (1:100) sterile filtrates of P. aeruginosa culture. IL-8 levels in cell supernatants were quantified by elisa and normalized to IL-8 levels of cells treated with diluent (D). Definition of ‘non-responder’ and ‘responder’ hMDM was as in Figure 5. Data in panels (A) and (B) are presented as medians and interquartile ranges (respectively symbols and bars); lines are logistic concentration–response curves. *P < 0.05, significantly different from corresponding diluent values.
Importantly, in ‘responder’ MDM, release of stimulated IL-8 was inhibited by 1,25(OH)2D3 at concentrations equal to or greater than 1 nM (Figure 7B). These concentrations exceed the levels of 1,25(OH)2D3 typically observed in blood (Lips, 2007; Biancuzzo et al., 2013) by at least two orders of magnitude. It is not recommended clinically to use 1,25(OH)2D3 at such concentrations range because of the potential side effects of hypercalcaemia and hyperphosphatemia. However, these adverse effects are less pronounced in low calcemic analogues of 1,25(OH)2D3, such as paricalcitol, and these analogues offer an alternative to 1,25(OH)2D3 for supplementation in clinical settings. We next tested the effects of paricalcitol on the stimulated release of IL-8. When tested in three ‘responder’ MDM cultures, paricalcitol down-regulated IL-8 release similarly to 1,25(OH)2D3. Thus, median levels of stimulated IL-8 were decreased from 219 989 pg·mL−1 (diluent treated MDM) to 165 327 pg·mL−1 (10 nM paricalcitol) or to 157 731 pg·mL−1 (100 nM paricalcitol). This was equivalent to about 40% inhibition of the control (diluent only) release (inhibitory curves not shown).
Up-regulation of hCAP18 as a measure of transcriptional activity of 25OHD3 and 1,25(OH)2D3
The data from the preceding set of experiments demonstrated that the transcriptionally active metabolite 1,25(OH)2D3 did not down-regulate IL-8 in ‘non-responder’ MDM. We therefore wanted to exclude the possibility of abnormal vitamin D signalling in these cells. To this end, we next assessed up-regulation of expression of the vitamin D responsive gene, hCAP18, as a measure of cell responsiveness to vitamin D metabolites.
Up-regulation of hCAP18 by 25OHD3 and 1,25(OH)2D3 was quantified in the presence of P. aeruginosa filtrates to exclude potential negative regulation of cell responsiveness to vitamin D metabolites by bacterial virulence factors. The filtrates alone mildly up-regulated expression of hCAP18 (<2-fold increase; data not shown). We further observed that in the presence of P. aeruginosa filtrates, hCAP18 was potently and concentration-dependently up-regulated by 1,25(OH)2D3 in both ‘non-responder’ and ‘responder’ MDM (Figure 8A). The relative up-regulation of hCAP18 greatly exceeded one order of magnitude in both ‘non-responder’ and ‘responder’ MDM, and was at its maximum at 100 nM 1,25(OH)2D3 (Figure 8A). The magnitude of relative up-regulation of hCAP18 tended to be even higher in the ‘non-responder’ compared with ‘responder’ MDM (respective median increases of 155- and 78-fold).
Figure 8.
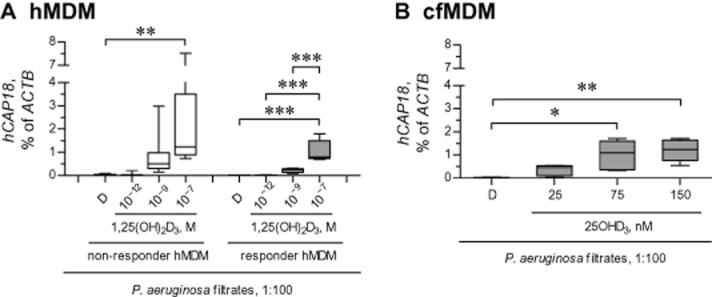
Up-regulation of hCAP18 expression by two vitamin D metabolites 25OHD3 and 1,25(OH)2D3 in ‘non-responder’ and ‘responder’ MDM. (A) Healthy ‘non-responder’ and ‘responder’ MDM (hMDM) were pretreated with diluent (D) or 1,25(OH)2D3, and stimulated for 24 h with diluted (1:100) sterile filtrates of P. aeruginosa culture in the presence of D or 1,25(OH)2D3. Definition of ‘non-responder’ and ‘responder’ hMDM is given in Figure 6. Expression of the vitamin responsive gene hCAP18 was quantified by qPCR and normalized to expression of ACTB, the gene encoding β-actin. **P < 0.01, ***P < 0.001; significantly different as indicated. (B) cfMDM were pretreated with diluent (D) or 25OHD3, and stimulated with diluted (1:100) P. aeruginosa filtrates. Expressions of hCAP18 and ACTB were quantified as in panel (A). *P < 0.05, **P < 0.01; significantly different as indicated. Data in panels (A) and (B) are presented as box-and-whisker plots (medians, interquartile ranges and min–max values).
We next tested the magnitude of hCAP18 up-regulation by 25OHD3. To this end, we incubated CF MDM, all of which were responsive to 25OHD3 in preceding experiments, with sterile filtrates of P. aeruginosa culture and 25OHD3. As expected, 25OHD3 also very efficiently up-regulated expression of hCAP18, with the most dramatic up-regulation at concentrations of 75 nM and above (Figure 8B). Currently, 75 nM is the highest concentration recommended for optimal bone health (Holick et al., 2011).
Up-regulation of DUSP1 by 1,25(OH)2D3 in ‘non-responder’ and ‘responder’ MDM
The previous experiments revealed that ‘non-responder’ MDM fully retained their responsiveness to transcriptional effects of two vitamin D metabolites, 25OHD3 and 1,25(OH)2D3, as judged by up-regulation of hCAP18. DUSP1 is another vitamin D responsive gene, which partly controls stimulated IL-8 production (Dauletbaev et al., 2011), and up-regulation of DUSP1 could represent a mechanism for the down-regulation of IL-8 by vitamin D metabolites. Therefore, in the next experiment, we tested basal expression of DUSP1 and the magnitude of up-regulation of this gene by 1,25(OH)2D3, in both ‘non-responder’ and ‘responder’ MDM. Basal expression of DUSP1 was comparable between ‘non-responder’ and ‘responder’ MDM (Figure 9). Furthermore, 1,25(OH)2D3 up-regulated DUSP1 with comparable magnitudes in both ‘non-responder’ and ‘responder’ MDM (Figure 9).
Figure 9.
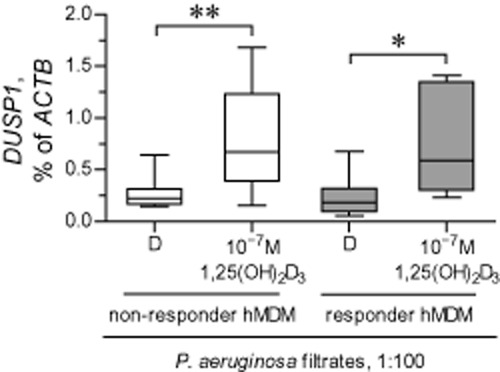
Up-regulation of DUSP1 expression by vitamin D metabolites 25OHD3 and 1,25(OH)2D3 in ‘non-responder’ and ‘responder’ MDM. Healthy ‘non-responder’ and ‘responder’ MDM (hMDM) were pretreated with diluent (D) or 1,25(OH)2D3, and stimulated for 24 h with diluted (1:100) sterile filtrates of Pseudomonas aeruginosa culture in the presence of D or 1,25(OH)2D3. Definition of ‘non-responder’ and ‘responder’ hMDM was as in Figure 6. Expression of the vitamin responsive gene DUSP1 was quantified by qPCR and normalized to expression of ACTB, the gene encoding β-actin. *P < 0.05, **P < 0.01, significantly different as indicated. Data are presented as box-and-whisker plots (medians, interquartile ranges and min–max values).
‘Non-responder’ MDM down-regulate stimulated IL-8 when treated with low-dose dexamethasone
Finally, we wanted to establish whether the lack of down-regulation of stimulated IL-8 in ‘non-responder’ MDM was specific to vitamin D metabolites. We thus treated both ‘non-responder’ and ‘responder’ MDM with a low concentration (5 nM) of dexamethasone, a potent anti-inflammatory corticosteroid. We found that ‘non-responder’ MDM, in general, retained their responsiveness to dexamethasone by down-regulating IL-8 production (Supporting Information Fig. S2). Even though the magnitude of IL-8 down-regulation was slightly less pronounced in ‘non-responder’ MDM (median down-regulation of 72% vs. 83% in ‘responder’ MDM), dexamethasone down-regulated stimulated IL-8 far more effectively than vitamin D metabolites or their analogues, and this was true for both tested MDM populations (dexamethasone-induced down-regulation: <70% in all tested MDM; vitamin D metabolites/analogues: ∼30% in ‘responder’ MDM and none in ‘non-responder’ MDM).
Discussion
In this study, we tested whether primary cultures of macrophages from patients with CF, modelled by their MDM, expressed sufficient levels of vitamin D-related genes (CYP27B1, VDR and CYP24A1) to benefit from the possible down-regulation of IL-8 by two vitamin D metabolites, 25OHD3 and 1,25(OH)2D3, and an analogue. It was further assessed to what extent these metabolites down-regulate IL-8 in cells stimulated with bacterial virulence factors. We also tested whether the down-regulation of IL-8 by vitamin D metabolites involved up-regulation of the vitamin D responsive anti-inflammatory gene DUSP1.
Epidemiological studies highlight an association between circulating levels of 25OHD3 and various disease outcomes in CF (McCauley et al., 2014; Simoneau et al., 2014; Sexauer et al., 2015; Vanstone et al., 2015). Studying this subject more closely, there has been an interventional study (Grossmann et al., 2012) and an in vitro study with immortalized airway epithelial cell lines (McNally et al., 2011) that tested modulation of inflammatory cytokines by vitamin D metabolites. There has been no study to date that tested the anti-inflammatory effects of vitamin D metabolites in macrophages, which are important innate immunity cells. Furthermore, to our knowledge, whether CF cells adequately express the genes involved in metabolism, signalling, and catabolism of 25OHD3 and 1,25(OH)2D3 had never been tested.
Here we have presented evidence that CF MDM expressed normal levels of vitamin D-related genes. Furthermore, CF MDM, similar to healthy MDM, expressed the gene CYP27B1 to convert 25OHD3 to 1,25(OH)2D3. Supporting this, our subsequent experiments demonstrated that CF MDM respond to 25OHD3 by up-regulating the vitamin D responsive gene, hCAP18, and down-regulating the stimulated release of IL-8.
IL-8 down-regulation by vitamin D metabolites and their analogue in our cell culture experiments was achievable only when high concentrations were applied. Furthermore, the MDM that were most responsive to down-regulation of IL-8 by vitamin D metabolites exhibited a hyperinflammatory phenotype, defined by a higher level of IL-8 release when stimulated with bacterial virulence factors. These hyperinflammatory MDM included all the samples from patients with CF and, surprisingly, from some healthy individuals. The hyperinflammatory MDM phenotype was not associated with a diminished expression of DUSP1 or the magnitude of up-regulation of this gene by 1,25(OH)2D3.
As the responsiveness to down-regulation of IL-8 by 25OHD3 and 1,25(OH)2D3 was individualized, it was necessary to identify its determinants. To this end, in the present study we have excluded transcriptional up-regulation of DUSP1 as one such determinant.
The concentrations of vitamin D metabolites necessary to achieve IL-8 down-regulation in vitro were much higher than those currently recommended to maintain proper bone metabolism in vivo. Specifically, the maximal recommended blood concentration of 25OHD3 is either 50 or 75 nM, depending on the guidelines. However, in our study, at least 100 nM of 25OHD3 was needed to down-regulate stimulated IL-8 in MDM. Consistent with this, the concentrations of 1,25(OH)2D3 that down-regulated the stimulated release of IL-8 were also substantially higher than those typically found in patients' blood. One possible interpretation of our findings is that in patients supplementation with vitamin D may require achieving substantial systemic levels, if the aim is to control excessive airway inflammation.
Interestingly, in ‘non-responder’ MDM, we observed some potentiation of stimulated IL-8 response, most obvious when the relative IL-8 change was considered. There have been reports of a similar potentiation of IL-8 production by 1,25(OH)2D3 in a monocytic leukaemia cell line THP-1, differentiated to macrophage-like cells (Ikeuchi et al., 2013; Ryynanen and Carlberg, 2013). It was suggested that this potentiation may occur as a ‘by-product’ of vitamin D receptor binding close to the IL-8 gene on chromosome 4, with subsequent chromatin opening and up-regulated transcription (Ryynanen and Carlberg, 2013). Therefore, not all intracellular effects of vitamin D may be anti-inflammatory. It is possible that, in any one individual, the IL-8 down-regulating efficacy of vitamin D is determined by a net effect of macrophage chromatin organization, interaction with transcription factors via the vitamin D receptor, down-regulation of innate immune receptors (Sadeghi et al., 2006; Khoo et al., 2011), and other intracellular factors modulated by vitamin D. Furthermore, not all beneficial effects of vitamin D may depend on its transcriptional activity, and recent reports appear to support the existence of such pathways (Giangreco and Nonn, 2013; Ito et al., 2013; Li et al., 2013).
In addition, the initial state of the cell treated with vitamin D metabolites could also define the resulting anti-inflammatory effect. Vitamin D metabolites do appear to cause mild non-specific up-regulation of IL-8 under certain circumstances, for example, by the chromatin reorganization discussed above. But their effects against excessive IL-8 production, such as in ‘responder’ MDM and CF MDM in our study, seemed to be predominantly anti-inflammatory. This suggests that the mechanisms and net results of treatment with vitamin D metabolites may be individualized. As intracellular signalling of vitamin D metabolites is complex, there may be more than one single factor that determines the extent of IL-8 down regulation by these metabolites. Furthermore, net treatment results may also be determined by the levels of these metabolites.
Our experiments demonstrated that the hyperinflammatory MDM phenotype was not associated with circulating levels of 25OHD3. It is possible that such an association could exist in vivo, but that it was lost during the in vitro maturation of monocytes to MDM. Further studies would be needed to test the hyperinflammatory phenotypes of blood monocytes before they are put into culture. If monocyte responsiveness to vitamin D metabolites is to be tested, this will require the use of 1,25(OH)2D3 to bypass their lack of CYP27B1 expression.
The fact that two vitamin D metabolites, 25OHD3 and 1,25(OH)2D3, most effectively down-regulated IL-8 in hyperinflammatory MDM may provide a clue to their anti-inflammatory mechanisms. Identification of intracellular protein(s) or pathway(s) that exaggerate the inflammatory response in specific individuals may reveal how vitamin D metabolites down-regulate the stimulated release of IL-8. Paradoxically, the observed hyperinflammatory MDM phenotype did not translate into refractoriness to other anti-inflammatory therapies, such as low concentrations of dexamethasone, in our studies. Importantly, those MDM which were ‘non-responders’ in terms of the down-regulation of IL-8 by the tested vitamin D metabolites, did down-regulate IL-8 when treated with low concentrations of dexamethasone. Thus, their ‘non-responsiveness’ was specific to the effects of vitamin D metabolites on IL-8 production. It would be of interest to determine if this ‘non-responsiveness’ is a reflection of the complex nature of intracellular effects of vitamin D metabolites discussed above.
Because the hyperinflammatory phenotype is not limited to CF MDM and was found in cells from some healthy donors, it would appear that an exaggerated inflammatory response is not feature unique to CF. It is possible that this hyperinflammatory phenotype is determined by genetic variability of the so-called inflammatory ‘modifier’ genes (Guillot et al., 2014) that may be present in the general population as well. DUSP1, the anti-inflammatory gene up-regulated by 25OHD3 and 1,25(OH)2D3, did not appear, in our experiments, to be such a gene. Hyperinflammatory MDM expressed normal levels of DUSP1 under basal conditions and efficiently up-regulated this gene when treated with the vitamin D metabolites 25OHD3 and 1,25(OH)2D3. Furthermore, this hyperinflammatory phenotype was expressed when MDM were tested with bacterial virulence factors, such as sterile filtrates of P. aeruginosa or P. aeruginosa flagellin, but not when the MDM were stimulated with the pro-inflammatory cytokine IL-1β. This could be another clue to understanding hyperinflammation in MDM.
As down-regulation of IL-8 by 25OHD3 and 1,25(OH)2D3 was present only in hyperinflammatory MDM from specific individuals and only manifest with high concentrations of these metabolites, this may explain the mixed results from a recent interventional study with vitamin D supplementation in CF (Grossmann et al., 2012). It is therefore important to be able to identify, prospectively, the potential ‘responders’ to the anti-inflammatory therapy with vitamin D. Furthermore, as the hyperinflammatory phenotype and down-regulation of IL-8 by vitamin D metabolites are not specifically associated with CF, it is possible that there could also be ‘non-responders’ among CF, explaining the variability of responses observed in interventional studies with vitamin D supplementation in CF. We believe that the results of our study have contributed important points of discussion in CF research.
There are some important questions that remain unanswered. First, our study did not address the long-term reproducibility of the hyperinflammatory MDM phenotype that responded the most to the anti-inflammatory effects of vitamin D. Furthermore, we did not study how macrophage inflammatory responses would be affected by their maturation in the presence of high concentrations of 25OHD3 or 1,25(OH)2D3. The effects of vitamin D on macrophage IL-8 production that were studied here can be described as ‘acute’, as the overall incubation time with these vitamin D metabolites did not exceed 48 h. It is still possible that these vitamin D metabolites, 25OHD3 and 1,25(OH)2D3, may also modulate inflammatory responses by affecting the macrophage phenotype during maturation. In addition, the focus of this study was on IL-8, the chemokine propagating airway inflammation. However, macrophages produce many other cytokines and chemokines, apart from IL-8. We did not test here whether other macrophage-derived inflammatory factors would be affected by vitamin D metabolites 25OHD3 and 1,25(OH)2D3. Further studies should study the effects of vitamin D metabolites on these other inflammatory cytokines or chemokines. Finally, the beneficial effects of vitamin D also include stimulation of antibacterial defences, as mediated by the up-regulation of the antibacterial gene hCAP18. A diminished bacterial load would indirectly decrease airway inflammation.
In conclusion, we have demonstrated that high concentrations of 25OHD3 and 1,25(OH)2D3, and the synthetic analogue paricalcitol, moderately down-regulate IL-8 in hyperinflammatory macrophages from specific individuals, including those from patients with CF. We further demonstrated that the down-regulation of IL-8 by these vitamin D metabolites and analogues was not associated with up-regulation of the vitamin D responsive anti-inflammatory gene DUSP1. Identification of the factors that cause the observed heterogeneity of the down-regulation of IL-8 by vitamin D will help individualize vitamin D supplementation in CF and extend its beneficial effects to modulation of excessive airway inflammation.
Acknowledgments
N. D. acknowledges funding from US Cystic Fibrosis Foundation, Cystic Fibrosis Canada and Krieble Foundation. K. H. was a recipient of the Quebec Respiratory Health Training Programme (CIHR/FRSQ) and a scholarship of the Research Institute of MUHC. M. D. was the recipient of a scholarship from Cystic Fibrosis Canada. S. R. acknowledges funding from Cystic Fibrosis Canada and CIHR. L. C. L. acknowledges funding from US Cystic Fibrosis Foundation and Krieble Foundation. The authors would like to thank R. Reiss, M. Cammisano, A. Allard-Coutu, S. Singh and C. Crépeau for their help with carrying out this study. The authors further wish to thank Dr J. H. White for helpful comments and discussions. The kind gift of paricalcitol (Zemplar) by AbbVie was highly appreciated.
Glossary
- 25OHD3
25-hydroxyvitamin D3
- 1,25(OH)2D3
1,25-dihydroxyvitamin D3
- CF
cystic fibrosis
- MDM
monocyte-derived macrophage
- qPCR
quantitative PCR
Author contributions
N. D. and L. C. L. conceived the study and developed its research design. N. D. contributed to acquisition, analysis and interpretation of data. K. H. contributed to acquisition, analysis and interpretation of data. M. D. and H. C. contributed to acquisition of data. J. B. and E. M. recruited patients with CF. J. B. and S. R. prepared sterile filtrates of Pseudomonas aeruginosa culture. L. C. L. recruited patients with CF, and contributed to the analysis and interpretation of data. N. D. drafted the paper. K. H. and L. C. L. critically revised the paper and the concept presented in it. All co-authors have contributed to and approved the submitted version of the paper.
Conflict of interest
The authors have no conflicts of interest to disclose. None of the authors have been or are consultants for AbbVie.
Supporting information
Additional Supporting Information may be found in the online version of this article at the publisher's web-site:
http://dx.doi.org/10.1111/bph.13249
Figure S1 Up-regulation of IL-8 production by bacterial virulence factors.
Figure S2 Responsiveness of ‘non-responder’ and ‘responder’ cells to low-dose dexamethasone.
References
- Ross AC, Taylor CL, Yaktine AL, Del Valle HB, editors. Institute of Medicine (US) Committee to Review Dietary Reference Intakes for Vitamin D and Calcium. Dietary Reference Intakes for Calcium and Vitamin D. Washington, DC: The National Academies Press; 2011. [PubMed] [Google Scholar]
- Abraham SM, Clark AR. Dual-specificity phosphatase 1: a critical regulator of innate immune responses. Biochem Soc Trans. 2006;34:1018–1023. doi: 10.1042/BST0341018. [DOI] [PubMed] [Google Scholar]
- Alexander SPH, Benson HE, Faccenda E, Pawson AJ, Sharman JL, Spedding M, et al. The Concise Guide to PHARMACOLOGY 2013/14: Nuclear Hormone Receptors. Br J Pharmacol. 2013a;170:1652–1675. doi: 10.1111/bph.12448. [DOI] [PMC free article] [PubMed] [Google Scholar]
- Alexander SPH, Benson HE, Faccenda E, Pawson AJ, Sharman JL, Spedding M, et al. The Concise Guide to PHARMACOLOGY 2013/14: Enzymes. Br J Pharmacol. 2013b;170:1797–1867. doi: 10.1111/bph.12451. [DOI] [PMC free article] [PubMed] [Google Scholar]
- Balough K, McCubbin M, Weinberger M, Smits W, Ahrens R, Fick R. The relationship between infection and inflammation in the early stages of lung disease from cystic fibrosis. Pediatr Pulmonol. 1995;20:63–70. doi: 10.1002/ppul.1950200203. [DOI] [PubMed] [Google Scholar]
- Berube J, Roussel L, Nattagh L, Rousseau S. Loss of cystic fibrosis transmembrane conductance regulator function enhances activation of p38 and ERK MAPKs, increasing interleukin-6 synthesis in airway epithelial cells exposed to Pseudomonas aeruginosa. J Biol Chem. 2010;285:22299–22307. doi: 10.1074/jbc.M109.098566. [DOI] [PMC free article] [PubMed] [Google Scholar]
- Biancuzzo RM, Clarke N, Reitz RE, Travison TG, Holick MF. Serum concentrations of 1,25-dihydroxyvitamin D2 and 1,25-dihydroxyvitamin D3 in response to vitamin D2 and vitamin D3 supplementation. J Clin Endocrinol Metab. 2013;98:973–979. doi: 10.1210/jc.2012-2114. [DOI] [PMC free article] [PubMed] [Google Scholar]
- Bonfield TL, Panuska JR, Konstan MW, Hilliard KA, Hilliard JB, Ghnaim H, et al. Inflammatory cytokines in cystic fibrosis lungs. Am J Respir Crit Care Med. 1995;152:2111–2118. doi: 10.1164/ajrccm.152.6.8520783. [DOI] [PubMed] [Google Scholar]
- Dauletbaev N, Eklove D, Mawji N, Iskandar M, Di Marco S, Gallouzi IE, et al. Down-regulation of cytokine-induced interleukin-8 requires inhibition of p38 mitogen-activated protein kinase (MAPK) via MAPK phosphatase 1-dependent and -independent mechanisms. J Biol Chem. 2011;286:15998–16007. doi: 10.1074/jbc.M110.205724. [DOI] [PMC free article] [PubMed] [Google Scholar]
- Giangreco AA, Nonn L. The sum of many small changes: microRNAs are specifically and potentially globally altered by vitamin D3 metabolites. J Steroid Biochem Mol Biol. 2013;136:86–93. doi: 10.1016/j.jsbmb.2013.01.001. [DOI] [PMC free article] [PubMed] [Google Scholar]
- Gottfried E, Rehli M, Hahn J, Holler E, Andreesen R, Kreutz M. Monocyte-derived cells express CYP27A1 and convert vitamin D3 into its active metabolite. Biochem Biophys Res Commun. 2006;349:209–213. doi: 10.1016/j.bbrc.2006.08.034. [DOI] [PubMed] [Google Scholar]
- Grey V, Atkinson S, Drury D, Casey L, Ferland G, Gundberg C, et al. Prevalence of low bone mass and deficiencies of vitamins D and K in pediatric patients with cystic fibrosis from 3 Canadian centers. Pediatrics. 2008;122:1014–1020. doi: 10.1542/peds.2007-2336. [DOI] [PubMed] [Google Scholar]
- Grossmann RE, Zughaier SM, Liu S, Lyles RH, Tangpricha V. Impact of vitamin D supplementation on markers of inflammation in adults with cystic fibrosis hospitalized for a pulmonary exacerbation. Eur J Clin Nutr. 2012;66:1072–1074. doi: 10.1038/ejcn.2012.82. [DOI] [PMC free article] [PubMed] [Google Scholar]
- Guillot L, Beucher J, Tabary O, Le Rouzic P, Clement A, Corvol H. Lung disease modifier genes in cystic fibrosis. Int J Biochem Cell Biol. 2014;52c:83–93. doi: 10.1016/j.biocel.2014.02.011. [DOI] [PubMed] [Google Scholar]
- Holick MF. Vitamin D deficiency. N Engl J Med. 2007;357:266–281. doi: 10.1056/NEJMra070553. [DOI] [PubMed] [Google Scholar]
- Holick MF, Binkley NC, Bischoff-Ferrari HA, Gordon CM, Hanley DA, Heaney RP, et al. Evaluation, treatment, and prevention of vitamin D deficiency: an Endocrine Society clinical practice guideline. J Clin Endocrinol Metab. 2011;96:1911–1930. doi: 10.1210/jc.2011-0385. [DOI] [PubMed] [Google Scholar]
- Ikeuchi T, Nakamura T, Fukumoto S, Takada H. A vitamin D3 analog augmented interleukin-8 production by human monocytic cells in response to various microbe-related synthetic ligands, especially NOD2 agonistic muramyldipeptide. Int Immunopharmacol. 2013;15:15–22. doi: 10.1016/j.intimp.2012.10.027. [DOI] [PubMed] [Google Scholar]
- Ito I, Waku T, Aoki M, Abe R, Nagai Y, Watanabe T, et al. A nonclassical vitamin D receptor pathway suppresses renal fibrosis. J Clin Invest. 2013;123:4579–4594. doi: 10.1172/JCI67804. [DOI] [PMC free article] [PubMed] [Google Scholar]
- Khan TZ, Wagener JS, Bost T, Martinez J, Accurso FJ, Riches DW. Early pulmonary inflammation in infants with cystic fibrosis. Am J Respir Crit Care Med. 1995;151:1075–1082. doi: 10.1164/ajrccm/151.4.1075. [DOI] [PubMed] [Google Scholar]
- Khoo AL, Chai LY, Koenen HJ, Kullberg BJ, Joosten I, van der Ven AJ, et al. 1,25-dihydroxyvitamin D3 modulates cytokine production induced by Candida albicans: impact of seasonal variation of immune responses. J Infect Dis. 2011;203:122–130. doi: 10.1093/infdis/jiq008. [DOI] [PMC free article] [PubMed] [Google Scholar]
- Kieninger E, Singer F, Tapparel C, Alves MP, Latzin P, Tan HL, et al. High rhinovirus burden in lower airways of children with cystic fibrosis. Chest. 2013;143:782–790. doi: 10.1378/chest.12-0954. [DOI] [PubMed] [Google Scholar]
- Kopp BT, Abdulrahman BA, Khweek AA, Kumar SB, Akhter A, Montione R, et al. Exaggerated inflammatory responses mediated by Burkholderia cenocepacia in human macrophages derived from Cystic fibrosis patients. Biochem Biophys Res Commun. 2012;424:221–227. doi: 10.1016/j.bbrc.2012.06.066. [DOI] [PMC free article] [PubMed] [Google Scholar]
- Kreutz M, Andreesen R, Krause SW, Szabo A, Ritz E, Reichel H. 1,25-dihydroxyvitamin D3 production and vitamin D3 receptor expression are developmentally regulated during differentiation of human monocytes into macrophages. Blood. 1993;82:1300–1307. [PubMed] [Google Scholar]
- Li YC, Chen Y, Liu W, Thadhani R. MicroRNA-mediated mechanism of vitamin D regulation of innate immune response. J Steroid Biochem Mol Biol. 2013;144 Pt A:81–86. doi: 10.1016/j.jsbmb.2013.09.014. [DOI] [PMC free article] [PubMed] [Google Scholar]
- Lips P. Relative value of 25(OH)D and 1,25(OH)2D measurements. J Bone Miner Res. 2007;22:1668–1671. doi: 10.1359/jbmr.070716. [DOI] [PubMed] [Google Scholar]
- Lovewell RR, Patankar YR, Berwin B. Mechanisms of phagocytosis and host clearance of Pseudomonas aeruginosa. Am J Physiol Lung Cell Mol Physiol. 2014;306:L591–L603. doi: 10.1152/ajplung.00335.2013. [DOI] [PMC free article] [PubMed] [Google Scholar]
- McCauley LA, Thomas W, Laguna TA, Regelmann WE, Moran A, Polgreen LE. Vitamin D deficiency is associated with pulmonary exacerbations in children with cystic fibrosis. Ann Am Thorac Soc. 2014;11:198–204. doi: 10.1513/AnnalsATS.201208-068OC. [DOI] [PMC free article] [PubMed] [Google Scholar]
- McGarvey LP, Dunbar K, Martin SL, Brown V, Macmahon J, Ennis M, et al. Cytokine concentrations and neutrophil elastase activity in bronchoalveolar lavage and induced sputum from patients with cystic fibrosis, mild asthma and healthy volunteers. J Cyst Fibros. 2002;1:269–275. doi: 10.1016/s1569-1993(02)00098-x. [DOI] [PubMed] [Google Scholar]
- McNally P, Coughlan C, Bergsson G, Doyle M, Taggart C, Adorini L, et al. Vitamin D receptor agonists inhibit pro-inflammatory cytokine production from the respiratory epithelium in cystic fibrosis. J Cyst Fibros. 2011;10:428–434. doi: 10.1016/j.jcf.2011.06.013. [DOI] [PubMed] [Google Scholar]
- Murphy BS, Bush HM, Sundareshan V, Davis C, Hagadone J, Cory TJ, et al. Characterization of macrophage activation states in patients with cystic fibrosis. J Cyst Fibros. 2010;9:314–322. doi: 10.1016/j.jcf.2010.04.006. [DOI] [PubMed] [Google Scholar]
- Pawson AJ, Sharman JL, Benson HE, Faccenda E, Alexander SP, Buneman OP, et al. NC-IUPHAR. The IUPHAR/BPS Guide to PHARMACOLOGY: an expert-driven knowledge base of drug targets and their ligands. Nucl Acids Res. 2014;42(Database Issue):D1098–D1106. doi: 10.1093/nar/gkt1143. [DOI] [PMC free article] [PubMed] [Google Scholar]
- Rosenfeld M, Gibson RL, McNamara S, Emerson J, Burns JL, Castile R, et al. Early pulmonary infection, inflammation, and clinical outcomes in infants with cystic fibrosis. Pediatr Pulmonol. 2001;32:356–366. doi: 10.1002/ppul.1144. [DOI] [PubMed] [Google Scholar]
- Ryynanen J, Carlberg C. Primary 1,25-dihydroxyvitamin D3 response of the interleukin 8 gene cluster in human monocyte- and macrophage-like cells. PLoS ONE. 2013;8:e78170. doi: 10.1371/journal.pone.0078170. [DOI] [PMC free article] [PubMed] [Google Scholar]
- Sadeghi K, Wessner B, Laggner U, Ploder M, Tamandl D, Friedl J, et al. Vitamin D3 down-regulates monocyte TLR expression and triggers hyporesponsiveness to pathogen-associated molecular patterns. Eur J Immunol. 2006;36:361–370. doi: 10.1002/eji.200425995. [DOI] [PubMed] [Google Scholar]
- Sexauer WP, Hadeh A, Ohman-Strickland PA, Zanni RL, Varlotta L, Holsclaw D, et al. Vitamin D deficiency is associated with pulmonary dysfunction in cystic fibrosis. J Cyst Fibros. 2015;14:497–506. doi: 10.1016/j.jcf.2014.12.006. [DOI] [PubMed] [Google Scholar]
- Shah S, King EM, Chandrasekhar A, Newton R. Roles for the mitogen-activated protein kinase (MAPK) phosphatase, DUSP1, in feedback control of inflammatory gene expression and repression by dexamethasone. J Biol Chem. 2014;289:13667–13679. doi: 10.1074/jbc.M113.540799. [DOI] [PMC free article] [PubMed] [Google Scholar]
- Simoneau T, Bazzaz O, Sawicki GS, Gordon C. Vitamin D status in children with cystic fibrosis: associations with inflammation and bacterial colonization. Ann Am Thorac Soc. 2014;11:205–210. doi: 10.1513/AnnalsATS.201306-171BC. [DOI] [PubMed] [Google Scholar]
- Simonin-Le Jeune K, Le Jeune A, Jouneau S, Belleguic C, Roux PF, Jaguin M, et al. Impaired functions of macrophage from cystic fibrosis patients: CD11b, TLR-5 decrease and sCD14, inflammatory cytokines increase. PLoS ONE. 2013;8:e75667. doi: 10.1371/journal.pone.0075667. [DOI] [PMC free article] [PubMed] [Google Scholar]
- Tangpricha V, Kelly A, Stephenson A, Maguiness K, Enders J, Robinson KA, et al. An update on the screening, diagnosis, management, and treatment of vitamin D deficiency in individuals with cystic fibrosis: evidence-based recommendations from the Cystic Fibrosis Foundation. J Clin Endocrinol Metab. 2012;97:1082–1093. doi: 10.1210/jc.2011-3050. [DOI] [PubMed] [Google Scholar]
- Vanstone MB, Egan ME, Zhang JH, Carpenter TO. Association between serum 25-hydroxyvitamin D level and pulmonary exacerbations in cystic fibrosis. Pediatr Pulmonol. 2015;50:441–446. doi: 10.1002/ppul.23161. [DOI] [PubMed] [Google Scholar]
- Wang X, Liu Y. Regulation of innate immune response by MAP kinase phosphatase-1. Cell Signal. 2007;19:1372–1382. doi: 10.1016/j.cellsig.2007.03.013. [DOI] [PMC free article] [PubMed] [Google Scholar]
- Zhang PX, Murray TS, Villella VR, Ferrari E, Esposito S, D'Souza A, et al. Reduced caveolin-1 promotes hyperinflammation due to abnormal heme oxygenase-1 localization in lipopolysaccharide-challenged macrophages with dysfunctional cystic fibrosis transmembrane conductance regulator. J Immunol. 2013;190:5196–5206. doi: 10.4049/jimmunol.1201607. [DOI] [PMC free article] [PubMed] [Google Scholar]
- Zhang Y, Leung DY, Richers BN, Liu Y, Remigio LK, Riches DW, et al. Vitamin D inhibits monocyte/macrophage proinflammatory cytokine production by targeting MAPK phosphatase-1. J Immunol. 2012;188:2127–2135. doi: 10.4049/jimmunol.1102412. [DOI] [PMC free article] [PubMed] [Google Scholar]
Associated Data
This section collects any data citations, data availability statements, or supplementary materials included in this article.
Supplementary Materials
Figure S1 Up-regulation of IL-8 production by bacterial virulence factors.
Figure S2 Responsiveness of ‘non-responder’ and ‘responder’ cells to low-dose dexamethasone.