

Abstract
We investigated functional, morphological and molecular adaptations to strength training exercise and cold water immersion (CWI) through two separate studies. In one study, 21 physically active men strength trained for 12 weeks (2 days per week), with either 10 min of CWI or active recovery (ACT) after each training session. Strength and muscle mass increased more in the ACT group than in the CWI group (P < 0.05). Isokinetic work (19%), type II muscle fibre cross-sectional area (17%) and the number of myonuclei per fibre (26%) increased in the ACT group (all P < 0.05), but not the CWI group. In another study, nine active men performed a bout of single-leg strength exercises on separate days, followed by CWI or ACT. Muscle biopsies were collected before and 2, 24 and 48 h after exercise. The number of satellite cells expressing neural cell adhesion molecule (NCAM) (10−30%) and paired box protein (Pax7) (20−50%) increased 24–48 h after exercise with ACT. The number of NCAM+ satellite cells increased 48 h after exercise with CWI. NCAM+- and Pax7+-positive satellite cell numbers were greater after ACT than after CWI (P < 0.05). Phosphorylation of p70S6 kinaseThr421/Ser424 increased after exercise in both conditions but was greater after ACT (P < 0.05). These data suggest that CWI attenuates the acute changes in satellite cell numbers and activity of kinases that regulate muscle hypertrophy, which may translate to smaller long-term training gains in muscle strength and hypertrophy. The use of CWI as a regular post-exercise recovery strategy should be reconsidered.
Key points
Cold water immersion is a popular strategy to recover from exercise. However, whether regular cold water immersion influences muscle adaptations to strength training is not well understood.
We compared the effects of cold water immersion and active recovery on changes in muscle mass and strength after 12 weeks of strength training. We also examined the effects of these two treatments on hypertrophy signalling pathways and satellite cell activity in skeletal muscle after acute strength exercise.
Cold water immersion attenuated long term gains in muscle mass and strength. It also blunted the activation of key proteins and satellite cells in skeletal muscle up to 2 days after strength exercise.
Individuals who use strength training to improve athletic performance, recover from injury or maintain their health should therefore reconsider whether to use cold water immersion as an adjuvant to their training.
Introduction
Strength training is among the most common forms of organised physical activity. This type of exercise is often used to improve athletic performance, recover from injury, counteract age- or disease-related decline in muscle mass and function, and modify body composition/aesthetics (Folland & Williams, 2007). Athletes and coaches, individuals exercising for recreation, and practitioners working with clinical populations often seek ancillary strategies to enhance the benefits of strength training. It is generally assumed that, when used on a regular basis, post-exercise recovery strategies will reduce muscle fatigue and help exercising individuals to maintain the required workload during subsequent training sessions, thereby improving the effects of exercise training while reducing the risk of injury (Barnett, 2006).
Cold water immersion after exercise is believed to reduce muscle fatigue and soreness, and is thus a frequently used post-exercise recovery modality (Versey et al. 2013). However, few studies have assessed whether regular cold water immersion after each exercise session influences long-term training adaptations to exercise training. Several studies have indicated that cold water immersion attenuates gains in strength (Frohlich et al. 2014), muscle endurance capacity and brachial artery diameter (Ohnishi et al. 2004; Yamane et al. 2006, 2015) after 4−5 weeks of strength training. Conversely, other studies have demonstrated that cold water immersion augmented strength gains after 5 days of strength training (Burke et al. 2000) and increased markers of mitochondrial biogenesis in muscle (Ihsan et al. 2015). Considering this disparity and the limitations of these studies (e.g. short training periods, isolated muscle groups, no assessment of muscle hypertrophy), further research is warranted to develop a better understanding of the effects of cold water immersion on long-term adaptations to strength training. Knowledge gained from this research will help to establish how to use cold water immersion most effectively to optimize training adaptations.
Cold water immersion reduces muscle blood flow at rest (Gregson et al. 2011) and after exercise (Vaile et al. 2010; Mawhinney et al. 2013). Because muscle protein synthesis depends on an adequate blood supply (Fujita et al. 2006; Timmerman et al. 2010), the decrease in muscle blood flow after cold water immersion may have important implications for muscle metabolism during recovery from exercise. For example, lower blood flow in muscle in response to cold water immersion could reduce muscle protein synthesis. This might explain, in part, previous observations that cold water immersion attenuates gains in muscle strength and endurance capacity following strength training (Ohnishi et al. 2004; Yamane et al. 2006, 2015; Frohlich et al. 2014). Although these studies assessed changes in performance, they did not evaluate whether regular cold water immersion influences gains in muscle mass after strength training.
Only two studies have investigated how cold water immersion influences muscle metabolism after acute exercise in humans (Gregson et al. 2013; Ihsan et al. 2014). Several animal studies have examined the effects of applying ice to muscle strain or crush injuries (Lee et al. 2005; Carvalho et al. 2010; Puntel et al. 2011; Takagi et al. 2011). However, these studies focused more on inflammation and oxidative stress, and produced inconsistent findings. The mammalian target of rapamycin (mTOR) signalling pathway and satellite cells play important roles in regulating muscle hypertrophy following strength training (Baar & Esser, 1999; Dreyer et al. 2006; Petrella et al. 2008; Terzis et al. 2008; Bellamy et al. 2014; Mitchell et al. 2014). The effects of cold water immersion on mTOR signalling and satellite cells after exercise are unknown. If cold water immersion reduces the activity of the mTOR pathway and satellite cells, then this could attenuate muscle adaptations to strength training.
We investigated the effects of cold water immersion on functional, morphological and molecular adaptations in muscle after strength training. The present investigation was divided into two studies. The aim of the first study was to examine the influence of regular cold water immersion on changes in muscle mass and strength after 12 weeks of strength training. The aim of the second study was to investigate the effects of cold water immersion on acute hypertrophy-signalling pathways and satellite cell activity in skeletal muscle during recovery from an acute bout of strength exercise. We hypothesized that cold water immersion would attenuate long-term training adaptation by reducing the activity of key signalling proteins in skeletal muscle and/or blunting satellite cell activity in the first 48 h following strength exercise.
Methods
Ethical approval
Before providing their written informed consent, all participants were informed of the requirements and potential risks of the studies. The experimental procedures adhered to the standards set by the latest revision of the Declaration of Helsinki and were approved by the Human Research Ethics Committee of The University of Queensland.
Experimental details for Study 1
Experimental design
Study 1 was a randomized, controlled trial in which 24 physically active young men volunteered to participate in a 12-week lower-body strength training programme. Before the training period began, the participants were matched for strength and lean body mass, and one of each pair of participants was randomly assigned to a group that performed cold water immersion (n = 12), or active recovery (n = 12) within 10 min after each training session. The second person in the pair was allocated to the other group. Before the training period began and again at least 2 days after the final training session, muscle strength and mass were measured, and resting muscle biopsies were collected from vastus lateralis. Inclusion criteria required that all participants had at least 12 months of experience in strength training and were familiar with all exercise aspects of the study. One participant in the cold water immersion group and two participants in the active recovery group withdrew from study 1 because of injury not associated with the study. Their data were subsequently excluded from the analysis. The characteristics of the participants in this study are described in Table1.
Table 1.
Descriptive characteristics of participants in both experimental groups for both studies
| ACT | CWI | |
|---|---|---|
| Study 1 | ||
| Age (years) | 21.3 ± 1.9 | 21.2 ± 2.2 |
| Height (m) | 1.83 ± 0.1 | 1.81 ± 0.1 |
| Body mass (kg) | 79.2 ± 4.4 | 81.3 ± 11.6 |
| Lower body lean mass (%)a | 28.0 ± 3.0 | 28.1 ± 4.1 |
| 45 deg leg press 1 RM (kg) | 348 ± 80 | 366 ± 81 |
| Knee extension 1 RM (kg) | 88 ± 9 | 87 ± 12 |
| Knee flexion 1 RM (kg) | 75 ± 11 | 75 ± 17 |
| Study 2 | ||
| Age (years) | 22.1 ± 2.2 | |
| Height (m) | 1.80 ± 0.06 | |
| Body mass (kg) | 83.9 ± 15.9 | |
| Unilateral 45 deg leg press 8 RM (kg)b | 299 ± 44.8 | |
| Unilateral knee extension 8 RM (kg)b | 71 ± 11.97 |
Percentage of total body mass. bRepresentative of the mean 8 RM strength from both legs unilaterally. ACT, active recovery group; CWI, cold water immersion group. There were no significant differences between experimental groups for any of the descriptive characteristics in either study. All data in this table are mean ± SD.
Strength training
Strength training for Study 1 involved mainly the lower body. Training sessions were performed twice a week, separated by 72 h. The loads were set to 8, 10 and 12 repetition maximum (RM), and weights corresponding to a proportion of each participant’s body mass. Strength training was progressive, and included 45 deg leg press, knee extension, knee flexion, walking lunges and plyometrics exercises. The plyometric component comprised countermovement drop jumps, slow eccentric squat jumps, split lunge jumps and countermovement box jumps. All strength training was supervised and was performed at normal room temperature (23–25°C). See Table2 for further details.
Table 2.
Training session composition of studies 1 and 2
| Study 1 | |||
|---|---|---|---|
| Exercise | Repetitions (in set order) | Repetition load | Progression |
| 1. 45 deg leg press | Week 1–2; (8, 8, 10, 12, 10, 10) | 8, 10 and 12 RM | Adjusted at the start of every 5th session |
| Week 3–4; (8, 8, 10, 12, 10, 10) | 8, 10 and 12 RM | ||
| Week 5–6; (8, 8, 10, 12, 10, 10) | 8, 10 and 12 RM | ||
| Week 7–8; (8, 8, 10, 12, 10, 10) | 8, 10 and 12 RM | ||
| Week 9–10; (8, 8, 10, 12, 10, 10) | 8, 10 and 12 RM | ||
| Week 11–12; (8, 8, 10, 12, 10, 10) | 8, 10 and 12 RM | ||
| 2. Knee extensions | Week 1–12; (12, 12, 12) | 12 RM | Adjusted at the start of every 5th session |
| 3. Knee flexions | Week 1–12; (12, 12, 12) | 12 RM | Adjusted at the start of every 5th session |
| 4. Walking lunges | Week 1, 4, 7, 10; (10, 12, 14) | Week 1−3; 20% of PTBM | — |
| Week 2, 5, 8, 11; (12, 14, 16) | Week 4−6; Week 1–3 load + 5 kg | ||
| Week 3, 6, 9, 12; (14, 16, 18) | Week 7−9; Week 1–3 load +10 kg | ||
| Week 10−12; Week 1–3 load +15 kg | |||
| 5. Plyometrics | Week 1–3; (12, 12, 12) | Body weight | Countermovement drop jumps |
| Week 4–6; (12, 12, 12) | 50% of lunge load | Slow eccentric squat jumps | |
| Week 7–9; (12, 12, 12 each leg) | 50% of lunge load | Split lunge jumps | |
| Week 10–12; (12, 12, 12) | 50% of lunge load | Countermovement box jumps | |
| Study 2 | |||
| 1. 45 deg leg press | (8, 8, 10, 12, 10, 10) | 8, 10 and 12 RM | — |
| 2. Single leg squat | (12, 12, 12) | 12 RM | — |
| 3. Knee extensions | (8, 8, 10, 12, 10, 10) | 8, 10 and 12 RM | — |
| 4. Walking lunges | (12, 12, 12) | 12 RM | — |
Exercise order is denoted by 1−5 (study 1) and 1−4 (study 2). Concentric phases of repetitions were performed as quickly as possible, whilst eccentric and inter-repetition periods lasted approximately 1 s. Recovery time between sets was set at 1 min, and recovery between exercises was set at 3 min, leading to a total training session duration of approximately 45 min. PTBM, pre-training body mass; RM, repetition maximum.
Recovery therapies
Cold water immersion was performed within 5 min after each training session. Participants in the cold water immersion group sat in an inflatable bath (iCool iBody, iCool, Miami, Australia) for 10 min with both legs immersed in water up to the waist. Water was circulated continuously and maintained at 10.1 ± 0.3°C using a circulatory cooling unit (iCool LITE, iCool). Participants in the active recovery group performed 10 min active recovery at a self-selected low intensity on a stationary cycle ergometer (Wattbike, Nottingham, UK). The mean power output for each participant in the active recovery group was recorded after the first recovery session and was replicated following subsequent recovery sessions. The mean power output during active recovery was 59.5 ± 9.4 W. The participants minimized any re-warming following cold water immersion or cooling following active recovery by not showering or bathing for at least 2 h after the recovery therapies.
Assessment of muscle function
The participants were familiarized with the testing protocol and pre-training muscle strength for training load prescription was assessed over 2 days, 10−14 days before the first training session. On day 1, unilateral isometric torque, isokinetic work and rate of force development (RFD) were assessed using a dynamometer (Cybex 6000, CSMI, Stoughton, MA, USA). On day 2, bilateral isotonic (1, 8, 10 and 12 RM) leg press strength, bilateral 1 and 12 RM knee flexion and extension strength, and unilateral peak isometric torque were measured. Walking lunges and plyometric jumps were also performed for further familiarization. Post-training strength and muscle function were assessed in the 12th week of training in place of the last (i.e. 24th) training session. This testing was performed 48 h following the last training session to avoid any residual fatigue from prior training. Isometric and isokinetic strength, and RFD were measured in the dominant leg. For these measurements, the lateral condyle of the femur was aligned with the axis of rotation, and the seat angle was fixed at 90 deg. Peak isometric knee extension strength was identified as the peak torque measure at any time during two 5 s contractions, separated by 90 s, and performed at 70 deg knee angle (full knee extension = 0 deg). Isometric RFD was assessed over the initial 500 ms of the contraction. Isokinetic work was assessed during 50 isokinetic knee extensions performed over a 90 deg range at a velocity of 90 deg s–1. Repetition tempo was set at 0.5 Hz using a metronome (MT50, Wittner GmbH, Wernberg-Köblitz, Germany), and knee flexion velocity was set at 250 deg s–1 to allow passive flexion following each knee extension.
All data from the dynamometer were collected at 1000 Hz using a custom-designed LabVIEW script (LabVIEW, National Instruments Corp., Austin, TX, USA) and were stored on a personal computer for offline analysis. The test–retest coefficients of variation were 2.1% for peak torque in the 5 s isometric contraction and 3.5% for work performed in the isokinetic task.
Assessment of muscle mass
Muscle mass was assessed in Study 1 by measuring the mass of the quadriceps muscle group of the dominant leg using magnetic resonance imaging (MRI; Magnetom Sonata 1.5T, Siemens AG, Munich, Germany). MRI assessment comprised serial 5 mm slices with no inter-slice gap covering the area between the iliac crest and the superior border of the patella. Quadriceps volume was first calculated (blindly) by semi-automated manual segmentation and open-source software (Yushkevich et al. 2006) from the most proximal to distal slice in which the vastus lateralis was visible. Quadriceps volume was then converted to lean mass based on a muscle density of 1.04 kg l–1 (Vierdort, 1906). The test−retest coefficient of variation for quadriceps muscle volume was 2.8% based on calculations from six pre-training and six post-training MRI scans. Pre-training measurements were performed at rest 8−10 days before the first training session and again 4–5 days after the final training session.
Collection of muscle tissue
A muscle biopsy was collected from the mid-portion of the vastus lateralis muscle of the dominant leg of each subject after an overnight fast. Post-training biopsies were collected ∼3 cm proximal to the pre-training site. Pre-training biopsies were collected 4−5 days before the first training session, and post-training biopsies were collected 6−7 days after the last training session. Biopsies were collected under local anaesthesia (10 mg ml−1 xylocaine) with a 6 mm Bergström needle (Pelomi, Alberteslund, Denmark), which had been modified for the application of manual suction. All muscle tissue was washed quickly in 0.9% saline, and any fat, connective tissue or blood was dissected before the sample was weighed and frozen in liquid N2 (for Western blotting) or isopentane cooled in dry ice (for immunohistochemistry). All samples were stored at −80°C until analysis.
Control procedures
We attempted to minimize potential variation in training responses by providing standardized nutrition after each training session and instructing the participants to avoid doing any extra strength exercise outside the prescribed training. All participants were given a 30 g serve of whey protein isolate (WPI; Body Science, Gold Coast, Australia) containing 27 g protein to drink 60 min before each training session and following the completion of the recovery therapy. They were also given a recovery bar (Missile Performance Energy Bar, Body Science) containing 18 g protein and 30.7 g carbohydrate to eat 2 h after each training session. The participants were instructed to avoid consuming any additional dietary supplements and to follow their habitual diet for the duration of Study 1. Dietary intake was monitored through a 5 day food diary completed every third week. The participants refrained from any additional lower-body strength exercise during the 12 weeks of supervised training.
Immunohistochemistry analysis of muscle fibre type, myofibre cross-sectional area and myonuclear number
Monoclonal antibodies were obtained from the Developmental Studies Hybridoma Bank (DSHB), created by the NICHD of the NIH and maintained at The University of Iowa, Department of Biology, Iowa City, IA 52242.
Muscle cross-sections (10 μm) were cut at −20°C on a cryostat (CM3050 S, Leica, Nußloch, Germany), mounted on microscope slides and air-dried at room temperature. Sections were blocked for 60 min in 10% goat serum with phosphate buffered saline (PBS) before incubation overnight at 4°C in primary antibodies against type I myosin (mouse IgG2b, 1:50; DSHB, no. BA-F8), type II myosin (mouse IgG1, 1:300; DSHB, no. SC-71), and dystrophin (mouse IgG2a, 1:12.5; DSHB, no. MANDYS1(3B7)). The following morning sections were washed in PBS and then incubated at room temperature for 60 min with the respective secondary antibodies at a 1:500 dilution in PBS (goat anti-mouse IgG1 Alexa Fluor 488 (A-21121) to detect SC-71, goat anti-mouse IgG2b Alexa Fluor 555 (A-21147) to detect BA-F8 and goat anti-mouse IgG2a Alexa Fluor 647 (A-21241) to detect MANDYS1(3B7); Invitrogen, Grand Island, NY, USA). Nuclei were stained with 4′,6-diamidino-2-phenylindole (DAPI). The microscope slides were mounted in aqueous medium, covered with a coverslip, sealed and stored at 4°C. Muscle sections were visualized using a high-resolution camera (CoolCube 1c, Meta-Systems, Newton, MA, USA) mounted on a fluorescence microscope and equipped with the ISIS fluorescence imaging system (MetaSystems, Altlussheim, Germany). Images for fibre type and cross-sectional area analysis were exported to a personal computer and analysed in a blinded manner using open-source ImageJ software (Schneider et al. 2012). A mean (±SD) of 440 (±256) fibres were analysed to assess muscle fibre cross-sectional area. Myonuclear number was analysed by counting the number of DAPI stained nuclei within the sarcolemma (visualised by dystrophin staining) of 50 (25 type I and 25 type II) randomly selected fibres per section.
Experimental details for Study 2
Experimental design
Study 2 comprised a randomized, cross-over study in which 10 physically active young men completed two bouts of single-leg strength exercise on separate days; each of the sessions was followed by cold water immersion or active recovery. Muscle biopsies were collected from vastus lateralis of the exercised leg before and after each training session. Similar to Study 1, all participants had at least 12 months of experience in strength training, and were familiar with all exercise aspects of the studies. Because of injury not associated with the study, one participant withdrew from Study 2, and his data were subsequently excluded from the analysis. The characteristics of the participants in this study are described in Table1.
Muscle function assessment
Unilateral knee extension and leg press 8, 10 and 12 RM strength for both legs was assessed 4−5 days before each experimental trial. Single-leg squats and walking lunges were also performed for further familiarization, and to reinforce correct technique.
Strength exercises
The strength training sessions for the two experimental trials involved lower-body exercises such as the 45 deg leg press, single leg squats, knee extensions and walking lunges. These exercises were performed at loads of 8, 10 and 12 RM. All strength training was supervised, and performed at normal room temperature (23–25°C). See Table2 for further details.
Recovery therapies
The same recovery therapies and equipment described previously were also used in Study 2. In the cold water immersion trial, water was circulated continuously and maintained at 10.3 ± 0.5°C. In the active recovery trial, the participants exercised on a bike at a self-selected power output of 36.6 ± 13.8 W. The participants minimized any re-warming following cold water immersion or cooling following active recovery by not showering or bathing until after the 2 h muscle biopsy was collected. Participants were allowed to towel dry and change clothing if desired following each therapy.
Muscle tissue collection
The muscle biopsy collection and storage procedures for Study 2 were similar to those described above for Study 1. Biopsies in Study 2 were collected while the participants were in a fed state before exercise and again at 2, 24 and 48 h after each exercise trial. Pre-exercise and 2 h post-exercise biopsies were collected from the same incision. The pre-exercise biopsy was collected with the needle inserted in a distal direction, and the 2 h biopsy was collected with the needle inserted in a proximal direction. This method ensured that the two biopsy sites were separated by at least 3 cm. Biopsies at 24 and 48 h were collected from separate incisions, each ∼3 cm proximal from the previous incision.
Control procedures
For the same reasons described above for Study 1, we attempted to control the post-exercise diet and patterns of physical activity between the two trials. Before each trial, the participants consumed the same meal 2 h before the pre-exercise muscle biopsy and consumed a 30 g serve of the same whey protein isolate used in Study 1 before the recovery therapy. The participants then fasted until the 2 h biopsy was collected, after which they were provided with another 30 g of whey protein isolate to drink. The participants were instructed to avoid consuming any additional supplements between 4 days before each pre-exercise biopsy and the 48 h post-exercise muscle biopsy. The participants were encouraged to consume their habitual diet for 2 days before each experimental trial and until the 48 h muscle biopsy. Dietary intake before and during the first experimental trial of Study 2 was recorded in a food diary and replicated for the second experimental trial. The participants refrained from any additional lower-body strength exercise until after the 48 h muscle biopsy.
Western blotting
About 25 mg of muscle tissue was homogenised on ice in 15 μl mg–1 of 1× RIPA lysis buffer (no. 20-188, Millipore, Temecula, CA, USA) with added protease and phosphatase inhibitors (Halt, Thermo Scientific, Waltham, MA, USA, no. 78442). Samples were centrifuged at 15,000 g for 10 min at 4°C, and the supernatant was collected and analysed for protein concentration using the bicinchoninic acid assay (Pierce BCA Protein Assay Kit, Thermo Scientific, no. 23225). Working samples were diluted to 2 μg μl–1 of protein in distilled water and Laemmli loading buffer, and then heated at 95°C for 5 min. Samples and a pooled control (20 μg) were loaded onto 8−15% SDS-PAGE gels for protein separation by electrophoresis. Proteins were transferred to polyvinylidene fluoride membranes (Bio-Rad, Hercules, CA, USA, no. 170-4157) by semi-dry transfer (Trans-Blot Turbo, Bio-Rad) before blocking for 2 h at room temperature in 5% bovine serum albumin in Tris-buffered saline with 0.1% Tween 20 (TBST). The membrane was incubated overnight at 4°C with primary antibodies (from Cell Signaling Technology, Danvers, MA, USA, unless stated otherwise) against phosphorylated (p) p-p70S6 kinaseThr421/Ser424 (1:1000; no. 9204), p-p70S6 kinaseThr389 (1:1000; no. 9205), pERK-1Thr202/Tyr204 and pERK2Thr185/Tyr187 (1:1000; no. 4377), p-rpS6Ser235/236 (1:2000; no. 2215S), p-rpS6Ser240/244 (1:2000; no. 4856S) and total (T) proteins for T-p70S6 kinase (1:1000; no. 2708), T-ERK1/2 (1:1000; no. 4695), 4E-BP1 (1:1;000; no. 9644) and T-rpS6 (1:1000; Abcam, no. 40820). The membrane was washed in TBST, incubated with horseradish peroxidase conjugated secondary antibody at room temperature for 1 h, and washed again in TBST. Immunoreactive bands were detected by chemiluminescence (Amersham ECL Select, GE Healthcare, Pittsburgh, PA, USA, no. RPN2235) on a ChemiDoc XRS+ imaging system (Bio-Rad). Densitometry of the bands was measured using native software (ImageLab V4.1, Bio-Rad). The intensity of each band was recorded relative to the pooled control sample run on each gel and then adjusted to the intensity of the band for the housekeeping protein glyceraldehyde 3-phosphate dehydrogenase (GAPDH) (1:10000; Abcam, no. 9485) to control for equal protein loading. The intensity of the phosphorylated 4E-BP1 band was recorded relative to the pooled control and then adjusted for the expression of the γ-form of 4E-BP1 (Kimball et al. 1997; Vary, 2006).
Immunohistochemistry
For satellite cell counts, 8 μm sections were incubated with primary antibodies against neural cell adhesion molecules (NCAM) and paired box protein (Pax) 7 (1:200; Abcam, no. AB9018 and no. AB55494) in combination with laminin (Abcam, no. AB831009, incubated at 4°C overnight). The sections were then incubated with goat anti-mouse (Alexa Fluor 488, Invitrogen) and goat-anti rabbit (Alexa Fluor 594, Invitrogen) secondary antibodies for 1 h at room temperature. The nuclei were stained with 4′,6-diamidino-2-phenylindole (DAPI) (ProLong Gold Antifade Reagent with DAPI, P36935, Invitrogen). The slides were covered with coverslips and stored at room temperature before visualization with an Axi-ocam camera (Zeiss, Oberkochen, Germany) mounted on an Axioskop-2 light microscope (Zeiss). Satellite cells were identified by DAPI staining surrounded by NCAM staining and by DAPI staining overlapping with Pax7 staining, inside the laminin ring (Hanssen et al. 2013). Only regions of interest were analysed from sections. Any damaged or transverse orientated fibres were excluded. A mean (±SD) of 296 ± 136 fibres was analysed to calculate the numbers of satellite cells. Satellite cells were visualized and counted at ×40 magnification and are presented as the number of positive cells per fibre.
Statistical analysis
Statistical analyses were performed using the Statistical Package for Social Sciences (SPSS; v19, IBM, Armonk, NY, USA). All data were assessed and conformed to a normal distribution as determined by the Shapiro–Wilk test. A two-factor repeated-measures ANOVA was used to evaluate time effects and trial × time interaction effects. Following ANOVA, multiple pairwise comparisons were evaluated by Student’s t test (unpaired for Study 1; paired for Study 2), and validated using the false discovery rate (Curran-Everett, 2000). Absolute data were used to analyse changes in performance and muscle mass data, whereas relative changes (% or fold-change) from pre-training (Study 1) or pre-exercise (Study 2) were used to analyse protein expression and immunohistochemistry data. Cohen’s effect size (d) was calculated to compare the magnitude of differences between conditions. Magnitudes were assessed as follows: 0.2 to ≤0.5 = small effect, 0.51 to ≤0.8 = moderate effect, and ≥0.8 = large effect. Data are presented as means ± SD. Significance was accepted at P < 0.05.
Results
Study 1: muscle mass accretion
Muscle mass increased significantly following training in both the active recovery group (309 ± 73 g) and cold water immersion group (103 ± 71 g) (P < 0.001) (Fig. 1). However, the change in muscle mass accretion was significantly smaller in the cold water immersion group compared with the active recovery group (206 g; d = −4.1; P < 0.001). Type II fibre (17.1 ± 5.1%; P = 0.009) and total (type I + type II) cross-sectional area (14.2 ± 5.4%; P = 0.021) increased significantly following training in the active recovery group, but not in the cold water immersion group (type II fibre P = 0.10; total P = 0.12) (Fig. 2A). The number of myonuclei per type II fibre (26.1 ± 4.2%; P < 0.001) and the total number of myonuclei (type I + type II fibres) (17.0 ± 4.4%; P = 0.005) increased significantly after training in the active recovery group, but not in the cold water immersion group (P = 0.13 for myonuclei per type II fibre and P = 0.18 for the total number of myonuclei) (Fig. 2B).
Figure 1.
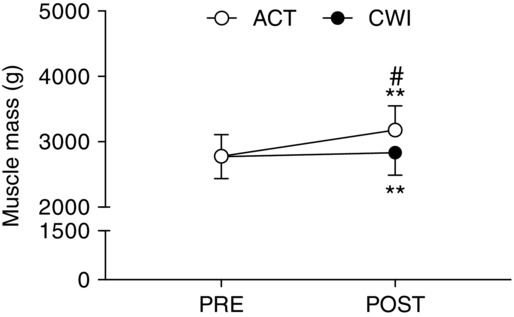
Quadriceps muscle mass
Main effects existed for time (P < 0.001) and time × group (P < 0.001). **P < 0.001 for the change from PRE. #P < 0.05 difference between groups.
Figure 2.
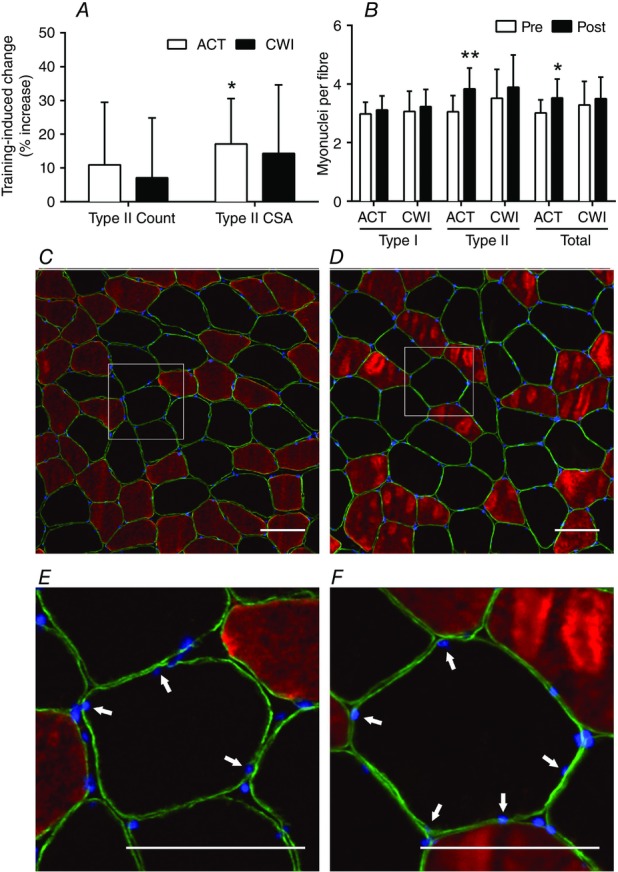
Change in type II muscle fibre count, myofibre cross-sectional area and myonuclear accretion
A and B, main effects for time existed for type II fibre cross-sectional area (P = 0.004) (A) and myonuclear accretion (type II, P < 0.001; and total, P = 0.002) (B). **P < 0.001 and *P < 0.05 change following training. C–F, representative pre-training (C and E) and post-training (D and F) images from the same participant. Type I fibres stain red, nuclei stain blue, and type II fibres are unstained. The dystrophin labelled muscle fibre membrane stains far-red but is pseudo-coloured green for presentation. Myonuclei were identified as nuclei within dystrophin rings (E and F; highlighted by arrows). Scale bars = 100 μm.
Study 1: strength changes
Maximal strength (1 RM) was significantly greater (P < 0.05) after training (compared with pre-training) for the active recovery and cold water immersion groups during the leg press (201 ± 65 kg for the active recovery group vs. 133 ± 43 kg for the cold water immersion group) and knee extension (33.8 ± 8.5 kg for the active recovery group vs. 17.8 ± 9.2 kg for the cold water immersion group) (Fig. 3). After training, leg press strength (57 kg; d = 1.5; P = 0.033; Fig. 3A) and knee extension strength (15.6 kg; d = 1.4; P < 0.001; Fig. 3B) were significantly greater in the active recovery group than in the cold water immersion group. Maximal isometric torque increased following training in the active recovery group (65 ± 32 N m; P < 0.001), whereas no increase occurred in the cold water immersion group (P = 0.11) (Fig. 3C). The RFD impulse increased significantly after training in the active recovery group (164 ± 130 N m s−1) and cold water immersion group (51 ± 44 N m s−1) (P < 0.001; Fig. 3D). Both maximal isometric torque (45 N m, d = 1.2; P = 0.039) and the RFD impulse (114 N m s−1, d = 2.1; P = 0.012) were significantly greater after training in the active recovery group compared with the cold water immersion group. Similarly, isokinetic knee extension work performed over contractions 1−25 only increased after training in the active recovery group (0.7 ± 0.4 kJ; P = 0.032) (Table3). Training did not alter maximal isokinetic knee extension torque (P = 0.19 for the active recovery group vs. P = 0.83 for the cold water immersion group) or the total isokinetic work performed during contractions 26−50 (P = 0.25 for the active recovery group vs. P = 0.46 for the cold water immersion group).
Figure 3.
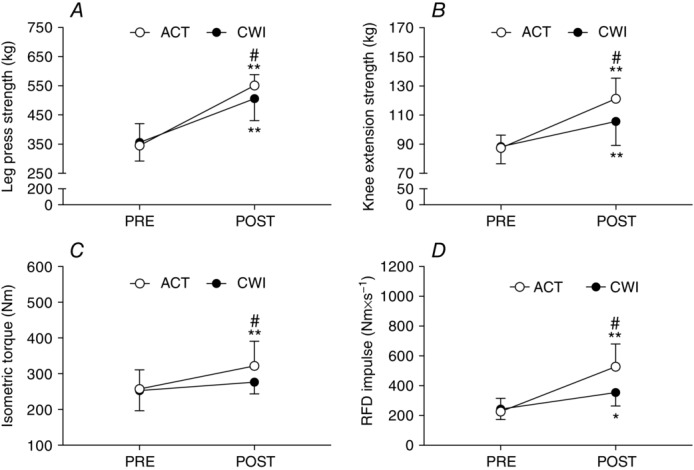
Maximum leg press strength (A), knee extension strength (B), knee extension isometric torque (C) and isometric rate of force development (RFD) impulse (D)
Main effects existed for leg press (time P < 0.001; time × group P = 0.013), knee extension strength (time P < 0.001; time × group P < 0.001), isometric torque (time P < 0.001; time × group P = 0.014) and RFD impulse (time P < 0.001; time × group P = 0.005). *P < 0.05 and **P < 0.001 for the change following training. #P < 0.05 difference between groups.
Table 3.
Isokinetic knee extension performance characteristics measured before (Pre) and after (Post) training in Study 1
| ACT | CWI | Between-group | Between-group | |||||
|---|---|---|---|---|---|---|---|---|
| Pre | Post | d | Pre | Post | d | P value | d | |
| Maximal isokinetic torque (N m) | 186 ± 20 | 206 ± 44 | 0.9 | 183 ± 28 | 186 ± 31 | 0.1 | 0.400 | 0.5 |
| Isokinetic work over contractions 1−25 (kJ) | 3.6 ± 0.6 | 4.3 ± 0.7** | 1.5 | 3.5 ± 0.7 | 3.7 ± 0.8 | 0.4 | 0.032 | 1.1 |
| Isokinetic work over contractions 26−50 (kJ) | 2.6 ± 0.6 | 2.3 ± 0.5 | 0.8 | 2.5 ± 0.6 | 2.3 ± 0.6 | 0.5 | 0.901 | 0.1 |
d, Cohen’s effect size. Main effects existed for time (P < 0.001) and time × group (P = 0.034) for the work performed over contractions 1−25. No main effect for time or interaction existed for maximal isokinetic torque, or the work performed over contractions 26–50. **P < 0.001 change from Pre. Exact P values and d are also displayed for relative differences between groups. ACT, active recovery group; CWI, cold water immersion group. All data in this table are mean ± SD.
Study 2: anabolic signalling
The phosphorylation of p70S6 kinaseThr421/Ser424 was significantly greater 2 h after exercise compared to pre-exercise in the active recovery trial (3.6-fold increase; P = 0.002) and the cold water immersion trial (2.2-fold increase; P = 0.002) (Fig. 4A). p70S6KThr421/Ser424 phosphorylation remained significantly higher than pre-exercise at 24 h (2-fold; P = 0.007), and tended to remain higher at 48 h (1.8-fold; P = 0.068) after exercise in the active recovery trial. p70S6KThr421/Ser434 phosphorylation was significantly greater following active recovery compared with cold water immersion at 2 h (90%; d = 4.7; P = 0.048) and 24 h (60%; d = 5.3; P = 0.049) after exercise. Similarly, phosphorylation of p70S6 kinaseThr389 was significantly greater 2 h after exercise compared to pre-exercise in the active recovery trial (0.7-fold increase; P = 0.008) and the cold water immersion trial (0.6-fold increase; P = 0.024) (Fig. 4B). Phosphorylation of p70S6 kinaseThr389 remained elevated at 24 h (0.9-fold increase; P = 0.020) and 48 h (0.4-fold increase; P = 0.032) after exercise in the active recovery trial, whilst it had returned to the pre-exercise phosphorylative state at the same time points in the cold water immersion trial. Phosphorylation tended to be higher in the active recovery trial compared with the cold water immersion trial at 24 h post-exercise (0.8-fold higher; P = 0.060). p70S6K total protein content was significantly elevated at 48 h (1.3-fold; P = 0.030) after the active recovery trial, and was significantly higher compared with the cold water immersion trial (30%; d = 1.8; P = 0.021) (Fig. 4C). p70S6K total protein remained unchanged at all time points following the cold water immersion trial (P = 0.25 to 0.89).
Figure 4.
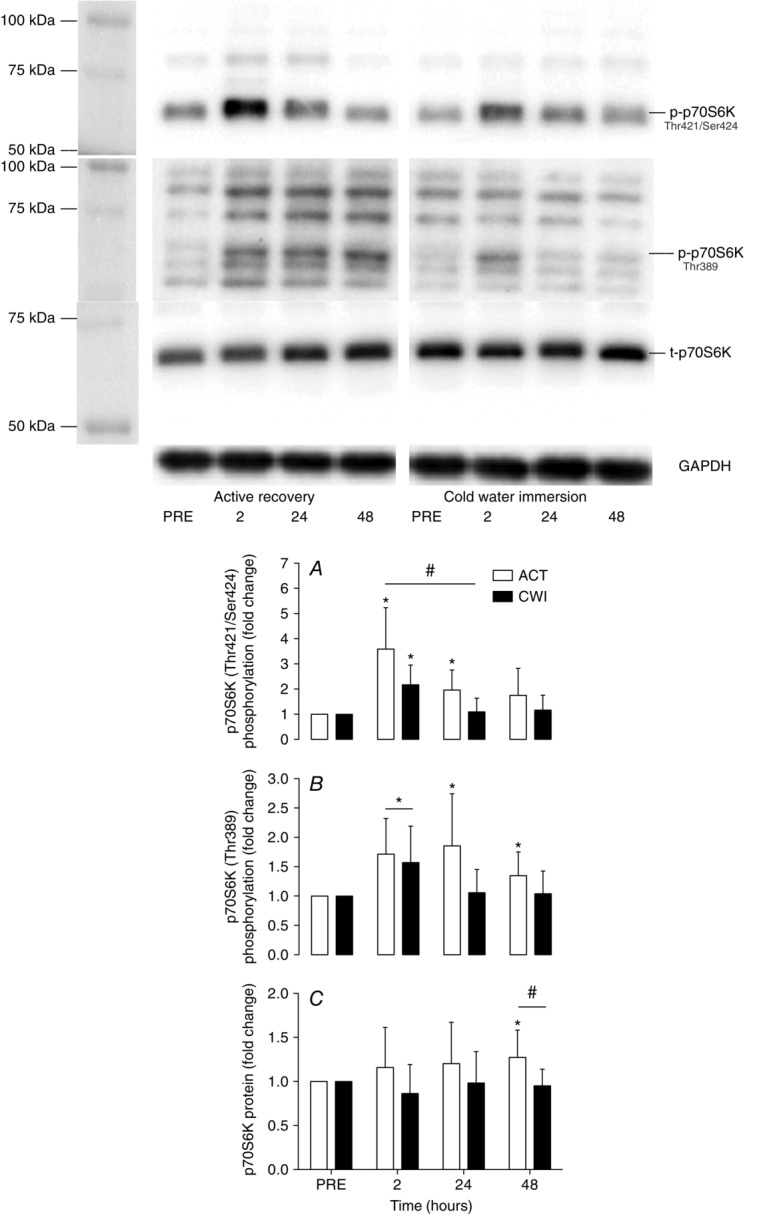
Change in phosphorylated p70S6KThr421/424 (A), phosphorylated p70S6KThr389 (B) and total p70S6K (C)
Main effects existed for time (P < 0.001) and time × trial (P = 0.028) for phosphorylated p70S6KThr421/424. A main effect existed for time (P = 0.001) for phosphorylated p70S6KThr389. Molecular mass marker information has been provided for phosphorylated p70S6KThr389 to aid with antibody specificity. The molecular mass of p70S6K resolved by SDS-PAGE is 70 kDa. *P < 0.05 change from PRE, #P < 0.05 difference between groups.
4E-BP1 phosphorylation (assessed by the mobility shift appearance of the γ isoform) was higher 2 h after exercise compared with exercise in the active recovery trial (4.2%; P = 0.008) and the cold water immersion trial (4.1%; P = 0.008) (Fig. 5). The phosphorylation state of 4E-BP1 had returned to pre-exercise values by 24 h after both trials. There were no significant differences in 4E-BP1 phosphorylation between the trials (P = 0.15 to 0.77).
Figure 5.
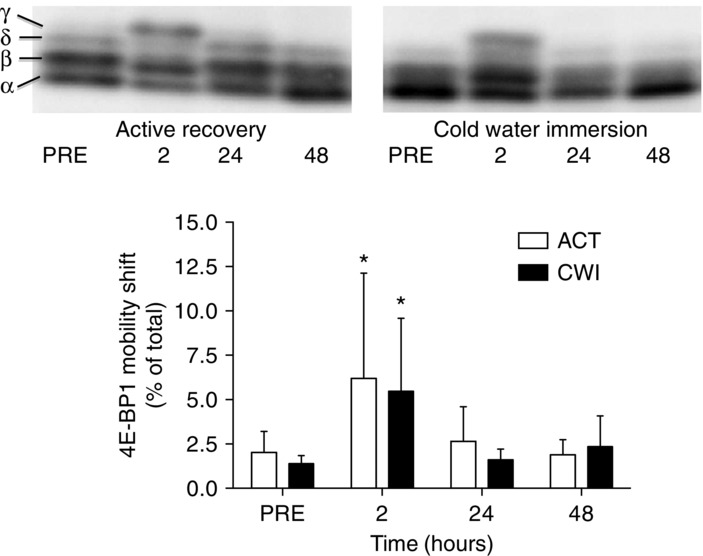
Change in the γ-form of 4E-BP1
A main effect existed for time (P = 0.001). *P < 0.05 change from PRE.
Phosphorylation of ERK-1Thr202/Tyr204 and -2Thr185/Tyr187 tended to increase after exercise in the cold water immersion trial (P = 0.067) (Fig. 6A and B) but did not increase significantly at any time after exercise in the active recovery trial (P = 0.11 to 0.98). There were no significant differences between the trials (P = 0.12 to 0.38). Total ERK phosphorylation (phosphorylation of ERK-1 + ERK-2 combined; Fig. 6C) increased 2 h after exercise in the cold water immersion trial (P = 0.019) and remained elevated at 24 h (P = 0.034). ERK-1 and -2 total protein expression did not change over time or differ between conditions (P = 0.13 to 0.82) (data not shown).
Figure 6.
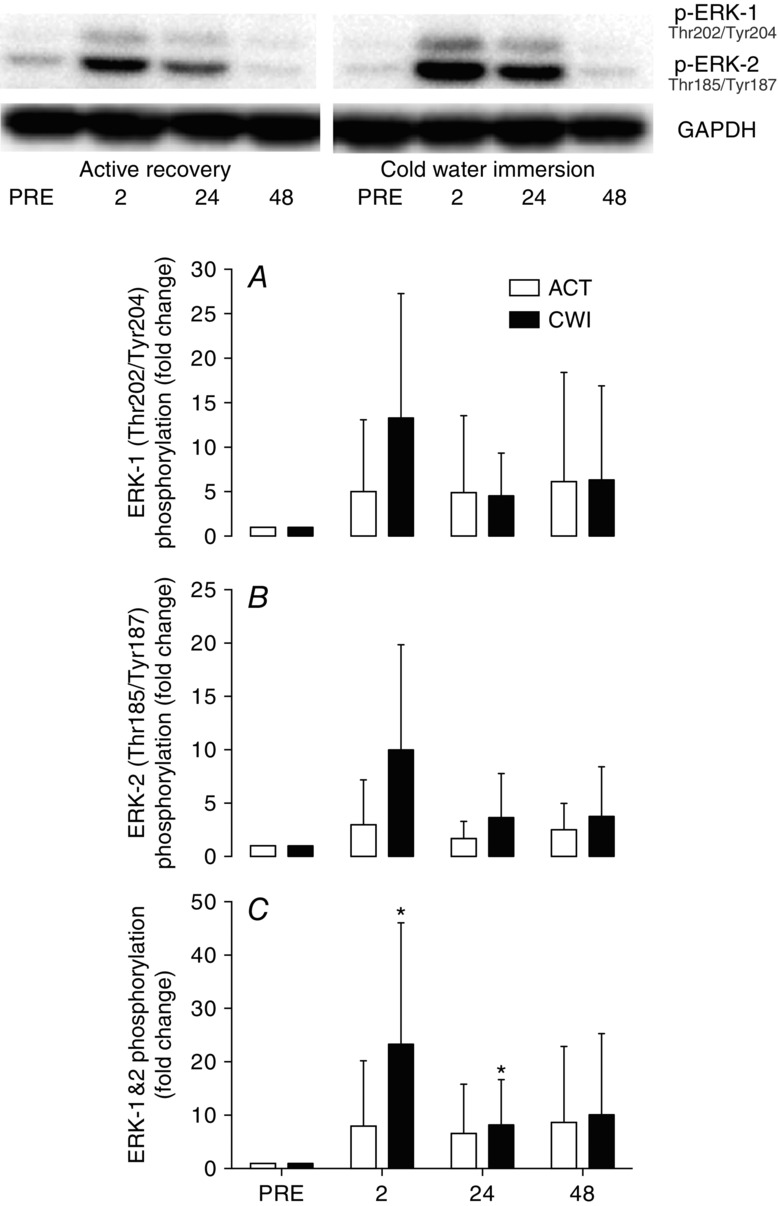
Change in phosphorylated ERK-1 (A), ERK-2 (B) and total ERK (phosphorylated ERK-1 + ERK-2) (C)
The main effect for time was not statistically significant for ERK-1 (P = 0.067) or ERK-2 (P = 0.12), but was for ERK1/2 (P = 0.004).
Phosphorylation of rpS6Ser240/244 and rpS6Ser235/236 did not change significantly after exercise in either trial (P = 0.09 to 0.65; Fig. 7A and B). However, rpS6 total protein was greater at 24 h (40%; d = 1.2; P = 0.027) and 48 h (50%; d = 1.5; P = 0.032) following exercise in the active recovery trial compared with the cold water immersion trial (Fig. 7C).
Figure 7.
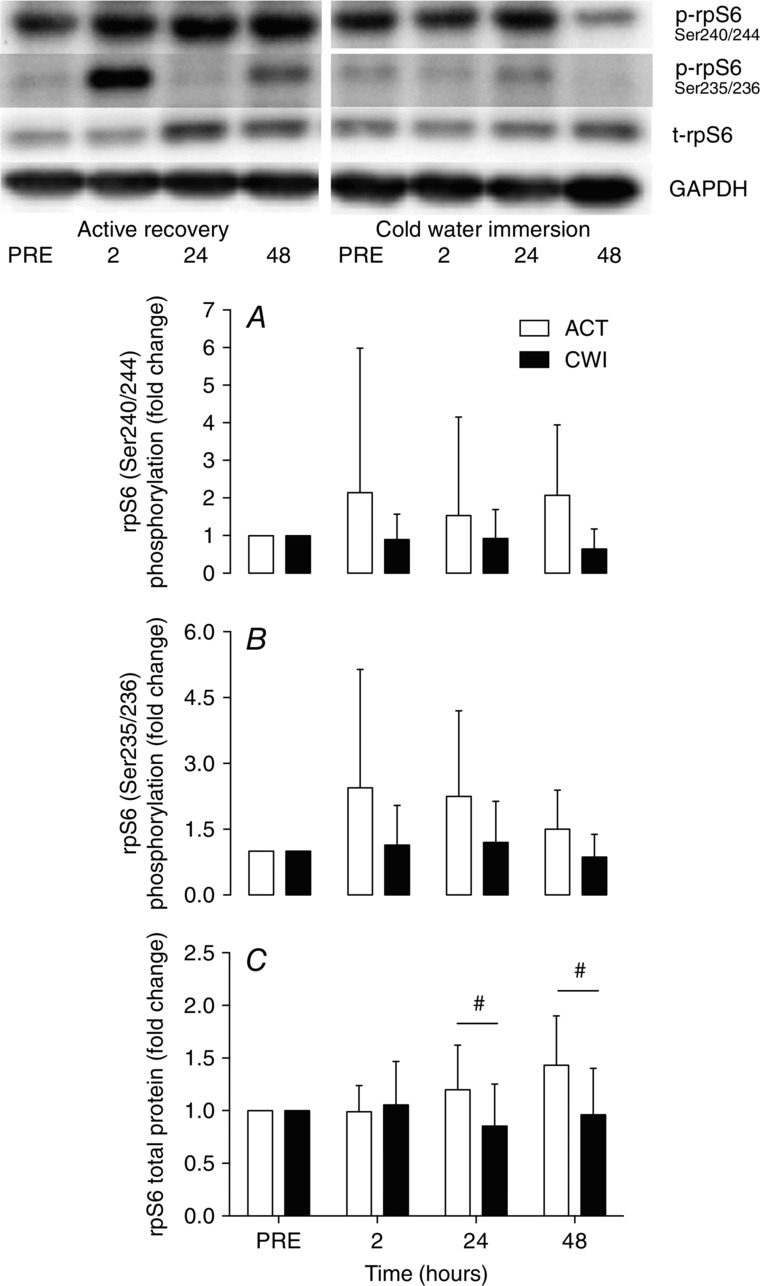
Change in phosphorylated rpS6Ser240/244 (A), phosphorylated rpS6Ser235/236 (B) and total rpS6 (C)
Main effects for time were not statistically significant for phosphorylated rpS6Ser240/244 (time P = 0.22), phosphorylated rpS6Ser235/236 (P = 0.18) or total rpS6 (P = 0.23). A main effect for trial existed for total rpS6 (P = 0.025). #P < 0.05 difference between groups.
Study 2: satellite cell numbers
The number of Pax7+ cells increased above the pre-exercise values at 24 h (21%; P = 0.023) and 48 h (48%; P = 0.004) after exercise in the active recovery trial (Fig. 8A). By contrast, Pax7+ cell numbers did not increase at any time after the cold water immersion trial (P = 0.16 to 0.79). Pax7+ cell count was greater following exercise at 48 h (33%; d = 1.4; P = 0.013) in the active recovery trial compared with the cold water immersion trial. The number of NCAM+ cells increased above pre-exercise values at all time points following exercise in the active recovery trial (10% to 32%; P = 0.012 to 0.031) (Fig. 8B), whereas it did not change following the cold water immersion trial until 48 h post-exercise (9.5%; P = 0.014). The number NCAM+ cells was significantly higher 24 h after the active recovery trial compared with the cold water immersion trial (90%; d = 1.7; P = 0.024).
Figure 8.
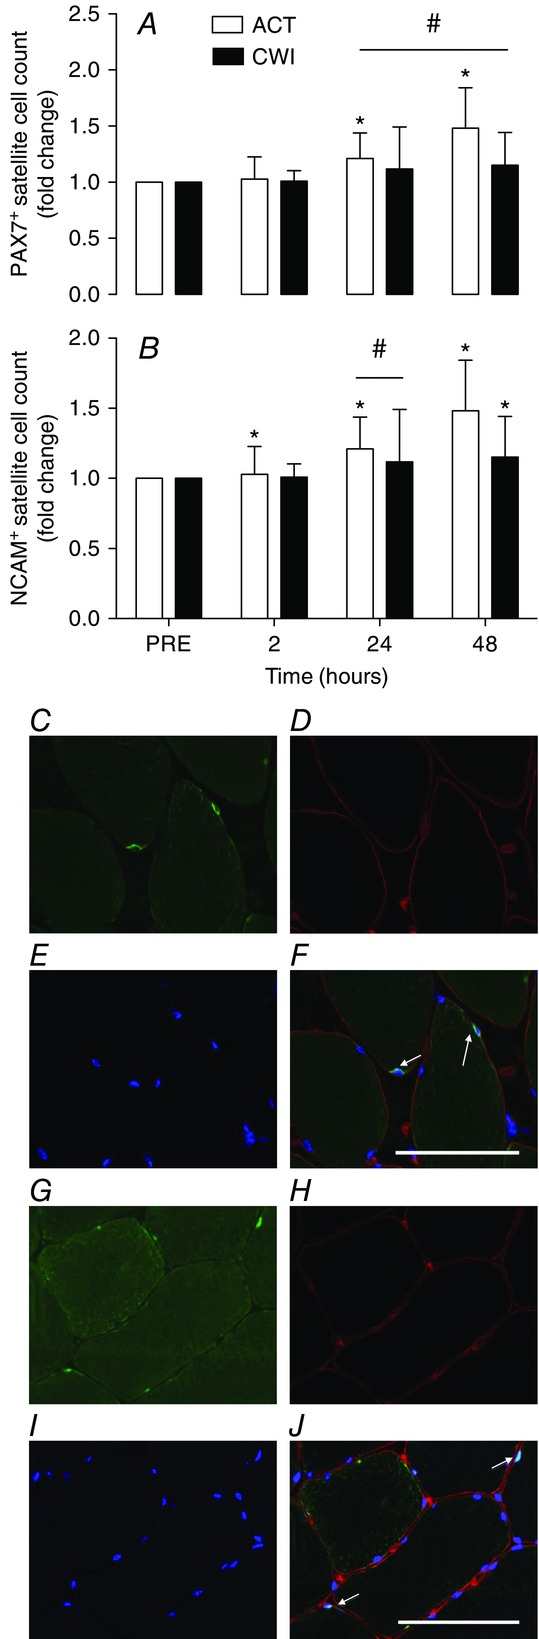
Change in Pax7+ (A) and NCAM+ (B) satellite cell numbers
Main effects existed for Pax7+ cells (time P = 0.008; time × trial P = 0.038) and NCAM+ cells (time P = 0.025; time × trial P = 0.002). *P < 0.05 change from PRE. #P < 0.05 difference between groups. Representative images 2 h post-exercise from the ACT leg (Study 2) showing NCAM or Pax7 (C and G; bright green), laminin (D and H; red), DAPI staining of nuclei (E and I; blue) and merged images (F and J). Satellite cells were identified as nuclei within laminin rings, with overlapping NCAM (F; highlighted by arrows) or Pax7 staining. White arrows indicate NCAM+ or Pax7+ cells. Scale bar = 50 μm.
Discussion
This investigation provides new insights into the effects of cold water immersion on functional, morphological and molecular adaptations in muscle after strength training. The key findings were that cold water immersion (1) substantially attenuated long-term gains in muscle mass and strength, and (2) delayed and/or suppressed the activity of satellite cells and kinases in the mTOR pathway during recovery from strength exercise. We propose that regular deficits in acute hypertrophy signalling in muscle after cold water immersion accumulated over time, which in turn resulted in smaller improvements in strength and hypertrophy. The present findings contribute to an emerging theme that cold water immersion and other strategies (e.g. antioxidant supplements, non-steroidal anti-inflammatory drugs) that are intended to mitigate and improve resilience to physiological stress associated with exercise may actually be counterproductive to muscle adaptation (Peake et al. 2015).
This investigation offers the strongest evidence to date that using cold water immersion on a regular basis may interfere with training adaptations. No previous study has investigated the effect of cold water immersion on muscle hypertrophy after strength training. Our findings partially support the work of Takagi et al. (2011), who found that icing attenuated muscle fibre regeneration and caused greater fibrosis 4 weeks after muscle crush injury in rats. Yamane et al. (2006) investigated changes in muscle endurance capacity and muscle strength after 4 weeks of handgrip training (3× per week) with cold water immersion (20 min at 10 ± 1°C) or passive recovery. The gains in muscle endurance capacity (but not strength) were significantly smaller in the arm that was treated with cold water immersion. The same group have reported similar findings from a follow-up study (Yamane et al. 2015). Fröhlich et al. (2014) evaluated changes in strength after 5 weeks of leg-curl exercise (frequency not specified) with cold water immersion (3 × 4 min at 12 ± 1.5°C) or passive recovery. Improvements in hamstring strength were significantly smaller in the leg that was treated with cold water immersion.
In contrast with the findings from the present study, and these other studies (Yamane et al. 2006, 2015; Frohlich et al. 2014), Burke et al. (2000) reported a greater increase in isometric hip flexor strength after 5 days of isometric training combined with cold water immersion (10 min at 8 ± 1°C) compared with passive recovery after each session. Halson et al. (2014) reported that cold water immersion (15 min at 15°C) after exercise (4 days per week) did not influence changes in cycling power output or time trial performance after 3 weeks of intensified training. However, that study focused more on whether cold water immersion helps to maintain, rather than enhance, training adaptations. In addition, Ihsan et al. (2015) found that regular cold water immersion increased the expression of markers of mitochondrial biogenesis in muscle. In the present study, we addressed some of the limitations of these studies by including a longer training period, training multiple muscle groups, evaluating a wider array of muscle functions, and assessing changes in muscle mass, myofibre cross-sectional area, and myonuclear accretion. The results of the present study therefore provide stronger and more comprehensive evidence for the attenuation of strength training adaptations in response to regular cold water immersion.
To determine the potential mechanisms by which cold water immersion attenuated gains in muscle strength and hypertrophy after 12 weeks of strength training, we conducted a follow-up study involving acute strength exercise (Study 2). Using two distinct satellite cell markers (Pax7 and NCAM), we found that cold water immersion blocked or delayed the normal increase in satellite cell number that occurs after acute strength exercise. The number of Pax7+ cells increased only after exercise in the active recovery trial, and the number of NCAM+ cells increased 2, 24 and 48 h after exercise in the active recovery trial. By contrast, the number of these cells increased only 48 h after exercise in the cold water immersion trial. These findings are consistent with the findings of Takagi et al. (2011), who reported that topical icing following crush injury delayed the increase in Pax7+ satellite cell numbers in regenerating muscle of rats.
Satellite cells play an important role in regulating muscle hypertrophy in response to strength exercise. Petrella et al. (2008) discovered that long-term gains in satellite cells after resistance training in humans were accompanied by greater increases in the numbers of myonuclei per fibre. Bellamy et al. (2014) observed that most individuals (80%) who showed the greatest gains in muscle mass after 16 weeks of resistance training also showed the greatest increases in the number of Pax7+ satellite cells associated with type I and II muscle fibres 24 and 72 h after acute resistance exercise. Further analysis revealed that individuals who gained the most muscle mass also showed long-term increases in the number of satellite cells associated with type II fibres. Conversely, those individuals who gained the least muscle mass showed little or no change in the number of satellite cells associated with type II fibres (Bellamy et al. 2014). We did not differentiate between satellite cell responses in type I versus type II fibres, nor did we assess chronic changes in the number of satellite cells. Nevertheless, based on the findings of these studies, we propose that, by suppressing and/or delaying satellite cell activity in muscle after each training session, cold water immersion diminishes long-term gains in the numbers of myonuclei and muscle mass.
In addition to evaluating satellite cell activity, we also compared acute changes in downstream targets of the mTOR and ERK pathways, including p70S6K, 4E-BP1 and rpS6. p70S6KThr421/Ser424 phosphorylation increased significantly at 2 h and 24 h after exercise in the active recovery trial. By contrast, p70S6KThr421/Ser424 phosphorylation increased only at 2 h after exercise in the cold water immersion trial, and the level of activation was lower compared with the active recovery trial. 4E-BP1 activation increased at 2 h after exercise in both the active recovery and cold water immersion trials and did not differ significantly between the trials. rpS6Ser240/244 phosphorylation did not change significantly after exercise in either trial. Baar & Esser (1999) first identified that p70S6K contributed to muscle hypertrophy after resistance training in rats. Subsequently, Terzis et al. (2008) found that the extent of p70S6K phosphorylation after acute resistance exercise correlated with gains in muscle mass and strength after resistance training in humans. In addition, Koopman et al. (2006) reported that p70S6K phosphorylation after acute resistance exercise occurred mainly in type II muscle fibres. If cold water immersion blunted p70S6K phosphorylation in type II muscle fibres, then this could partly explain our observation that the cross-sectional area of type II fibres did not change after strength training and cold water immersion. Although these putative mechanisms seem plausible, others have presented evidence that acute phosphorylation of p70S6K (and 4E-BP1) after exercise did not correlate with gains in muscle mass after strength training (Phillips et al. 2013). The role of p70S6K and other kinases in the mTOR pathway as regulators of muscle hypertrophy may vary depending on the nature of the strength training protocols. Accordingly, we cannot be certain to what extent differences in the activity of these kinases after active recovery versus cold water immersion influenced long-terms gains in muscle mass and strength.
The physiological and/or biochemical factors responsible for the lower activation of satellite cells and p70S6K after cold water immersion are not immediately obvious. Reductions in muscle blood flow and temperature may be involved. Fujita et al. (2006) reported that muscle protein synthesis correlates with muscle blood flow (r = 0.79, P < 0.0001). Timmerman et al. (2010) found that muscle protein synthesis increases in response to stimulation of muscle blood flow. Cold water immersion reduces blood flow to muscle (Gregson et al. 2011; Mawhinney et al. 2013) and the limbs (Vaile et al. 2010). By reducing muscle blood flow, cold water immersion may reduce the delivery of amino acids to skeletal muscle, and this could suppress signalling pathways that control muscle protein synthesis after exercise.
Cold water immersion also reduces muscle temperature (Gregson et al. 2011, 2013; Mawhinney et al. 2013), and this might influence the expression of genes or the activity of transcription factors that regulate muscle growth. For example, cold shock inhibits myogenin expression in myoblasts and stops them forming myotubes (Shima & Matsuda, 2008). By extension, cold shock could (theoretically) inhibit satellite cells from differentiating and adding to the myonuclear domain. Cold shock also induces the expression of the cell cycle regulatory proteins p53 and p21 in various cell types (Matijasevic et al. 1998; Roobol et al. 2009). These proteins play an important role (both stimulatory and inhibitory) in regulating muscle growth and remodelling (Chen et al. 2002; Fox et al. 2014). Changes in their expression or activity in response to cold may also influence muscle hypertrophy. Cold shock induces the expression of other proteins such as RNA-binding motif protein-3 in muscle cells (Ferry et al. 2011). However, because RNA-binding motif protein-3 promotes cell survival and prevents apoptosis (Ferry et al. 2011), it seems unlikely that changes in this protein can account for our observations of diminished muscle hypertrophy following strength training and cold water immersion. Our finding that ERK1/2 phosphorylation increased after exercise only in the cold water immersion trial (Fig. 7C) probably does not indicate any stimulatory effect or stress response to cold water immersion per se. Rather, it may simply indicate that cold water immersion delayed the exercise-induced activation of ERK1/2 which typically occurs early during recovery.
In conclusion, these two studies offer new and important insights into how cold water immersion during recovery from strength exercise affects chronic training adaptations and some of the molecular mechanisms that underpin such adaptations. Cold water immersion delayed or inhibited satellite cell activity and suppressed the activation of p70S6K after acute strength exercise. These effects may have been compounded over time to diminish the expected increases in muscle mass and strength as a result of training. The results of these studies challenge the notion that cold water immersion improves recovery after exercise. Individuals who use strength training to improve athletic performance, recover from injury or maintain their health should therefore reconsider whether to use cold water immersion as an adjuvant to their training.
Acknowledgments
The authors thank Body Science International Pty Ltd for providing nutritional supplements for these studies, and the subjects for their dedication, time and effort.
Glossary
- DAPI
4′,6-diamidino-2-phenylindole
- ERK
extracellular regulated kinase
- GAPDH
glyceraldehyde 3-phosphate dehydrogenase
- MRI
magnetic resonance imaging
- mTOR
mammalian target of rapamycin
- NCAM
neural cell adhesion molecule
- Pax7
paired box protein 7
- p70S6K
p70S6 kinase
- RFD
rate of force development
- RIPA
radioimmunoprecipitation assay
- RM
repetition maximum
- rpS6
ribosomal protein S6
- Ser
serine
- Thr
threonine
- Tyr
tyrosine
- 4E-BP1
(eukaryotic translation initiation factor) 4E-binding protein1
Additional information
Competing interests
All authors declare no competing interests.
Author contributions
L.A.R., A.S., D.C.S., T.R., J.C. and J.P. conceived and designed the studies. L.A.R., J.F.M., V.C.F. and I.E. collected, assembled and analysed the data. L.A.R., T.R., J.F.M and J.P interpreted the data. L.A.R., T.R., J.F.M. and J.P. drafted the manuscript. All authors helped to revise and approve the final version of the manuscript.
Funding
These studies were funded by research grants from the American College of Sports Medicine (ACSM) Research Foundation and Exercise and Sport Science Australia (ESSA) awarded to L.A.R, J.C. and J.P., and a grant from Queensland University of Technology awarded to J.P. L.A.R. was supported by an International Postgraduate Research Scholarship from The University of Queensland.
References
- Baar K. Esser K. Phosphorylation of p70S6k correlates with increased skeletal muscle mass following resistance exercise. Am J Physiol Cell Physiol. 1999;276:C120–127. doi: 10.1152/ajpcell.1999.276.1.C120. [DOI] [PubMed] [Google Scholar]
- Barnett A. Using recovery modalities between training sessions in elite athletes: does it help? Sports Med. 2006;36:781–796. doi: 10.2165/00007256-200636090-00005. [DOI] [PubMed] [Google Scholar]
- Bellamy LM, Joanisse S, Grubb A, Mitchell CJ, McKay BR, Phillips SM, Baker S. Parise G. The acute satellite cell response and skeletal muscle hypertrophy following resistance training. PLoS One. 2014;9:e109739. doi: 10.1371/journal.pone.0109739. [DOI] [PMC free article] [PubMed] [Google Scholar]
- Burke D, MacNeil S, Holt L, MacKinnon N. Rasmussen R. The effect of hot or cold water immersion on isometric strength training. J Strength Cond Res. 2000;14:21–25. [Google Scholar]
- Carvalho N, Puntel G, Correa P, Gubert P, Amaral G, Morais J, Royes L, da Rocha J. Soares F. Protective effects of therapeutic cold and heat against the oxidative damage induced by a muscle strain injury in rats. J Sports Sci. 2010;28:923–935. doi: 10.1080/02640414.2010.481722. [DOI] [PubMed] [Google Scholar]
- Chen YW, Nader GA, Baar KR, Fedele MJ, Hoffman EP. Esser KA. Response of rat muscle to acute resistance exercise defined by transcriptional and translational profiling. J Physiol. 2002;545:27–41. doi: 10.1113/jphysiol.2002.021220. [DOI] [PMC free article] [PubMed] [Google Scholar]
- Curran-Everett D. Multiple comparisons: Philosophies and illustrations. Am J Physiol Regul Integr Comp Physiol. 2000;279:R1–R8. doi: 10.1152/ajpregu.2000.279.1.R1. [DOI] [PubMed] [Google Scholar]
- Dreyer HC, Fujita S, Cadenas JG, Chinkes DL, Volpi E. Rasmussen BB. Resistance exercise increases AMPK activity and reduces 4E-BP1 phosphorylation and protein synthesis in human skeletal muscle. J Physiol. 2006;576:613–624. doi: 10.1113/jphysiol.2006.113175. [DOI] [PMC free article] [PubMed] [Google Scholar]
- Ferry AL, Vanderklish PW. Dupont-Versteegden EE. Enhanced survival of skeletal muscle myoblasts in response to overexpression of cold shock protein RBM3. Am J Physiol Cell Physiol. 2011;301:C392–402. doi: 10.1152/ajpcell.00098.2011. [DOI] [PMC free article] [PubMed] [Google Scholar]
- Folland JP. Williams AG. The adaptations to strength training: morphological and neurological contributions to increased strength. Sports Med. 2007;37:145–168. doi: 10.2165/00007256-200737020-00004. [DOI] [PubMed] [Google Scholar]
- Fox DK, Ebert SM, Bongers KS, Dyle MC, Bullard SA, Dierdorff JM, Kunkel SD. Adams CM. p53 and ATF4 mediate distinct and additive pathways to skeletal muscle atrophy during limb immobilization. Am J Physiol Endocrinol Metab. 2014;307:E245–261. doi: 10.1152/ajpendo.00010.2014. [DOI] [PMC free article] [PubMed] [Google Scholar]
- Frohlich M, Faude O, Klein M, Pieter A, Emrich E. Meyer T. Strength training adaptations after cold water immersion. J Strength Cond Res. 2014;28:2628–2633. doi: 10.1519/JSC.0000000000000434. [DOI] [PubMed] [Google Scholar]
- Fujita S, Rasmussen BB, Cadenas JG, Grady JJ. Volpi E. Effect of insulin on human skeletal muscle protein synthesis is modulated by insulin-induced changes in muscle blood flow and amino acid availability. Am J Physiol Endocrinol Metab. 2006;291:E745–754. doi: 10.1152/ajpendo.00271.2005. [DOI] [PMC free article] [PubMed] [Google Scholar]
- Gregson W, Allan R, Holden S, Phibbs P, Doran D, Campbell I, Waldron S, Joo CH. Morton J. Postexercise cold water immersion does not attenuate muscle glycogen resynthesis. Med Sci Sports Exerc. 2013;45:1174–1181. doi: 10.1249/MSS.0b013e3182814462. [DOI] [PubMed] [Google Scholar]
- Gregson W, Black MA, Jones H, Milson J, Morton J, Dawson B, Atkinson G. Green DJ. Influence of cold water immersion on limb and cutaneous blood flow at rest. Am J Sports Med. 2011;39:1316–1323. doi: 10.1177/0363546510395497. [DOI] [PubMed] [Google Scholar]
- Halson SL, Bartram J, West N, Stephens J, Argus CK, Driller MW, Sargent C, Lastella M, Hopkins WG. Martin DT. Does hydrotherapy help or hinder adaptation to training in competitive cyclists? Med Sci Sports Exerc. 2014;46:1631–1639. doi: 10.1249/MSS.0000000000000268. [DOI] [PubMed] [Google Scholar]
- Hanssen KE, Kvamme NH, Nilsen TS, Ronnestad B, Ambjornsen IK, Norheim F, Kadi F, Hallen J, Drevon CA. Raastad T. The effect of strength training volume on satellite cells, myogenic regulatory factors, and growth factors. Scand J Med Sci Sports. 2013;23:728–739. doi: 10.1111/j.1600-0838.2012.01452.x. [DOI] [PubMed] [Google Scholar]
- Ihsan M, Markworth JF, Watson G, Choo HC, Govus A, Pham T, Hickey AJ, Cameron-Smith D. Abbiss CR. Regular post-exercise cooling enhances mitochondrial biogenesis through AMPK and p38 MAPK in human skeletal muscle. Am J Physiol Regul Integr Comp Physiol. 2015:in press. doi: 10.1152/ajpregu.00031.2015. doi: 10.1152/ajpregu.00031.2015 ) [DOI] [PubMed] [Google Scholar]
- Ihsan M, Watson G, Choo HC, Lewandowski P, Papazzo A, Cameron-Smith D. Abbiss CR. Postexercise muscle cooling enhances gene expression of PGC-1α. Med Sci Sports Exerc. 2014;46:1900–1907. doi: 10.1249/MSS.0000000000000308. [DOI] [PubMed] [Google Scholar]
- Kimball SR, Jurasinski CV, Lawrence JC., Jr Jefferson LS. Insulin stimulates protein synthesis in skeletal muscle by enhancing the association of eIF-4E and eIF-4G. Am J Physiol Cell Physiol. 1997;272:C754–759. doi: 10.1152/ajpcell.1997.272.2.C754. [DOI] [PubMed] [Google Scholar]
- Koopman R, Zorenc AH, Gransier RJ, Cameron-Smith D. van Loon LJ. Increase in S6K1 phosphorylation in human skeletal muscle following resistance exercise occurs mainly in type II muscle fibers. Am J Physiol Endocrinol Metab. 2006;290:E1245–1252. doi: 10.1152/ajpendo.00530.2005. [DOI] [PubMed] [Google Scholar]
- Lee H, Natsui H, Akimoto T, Yanagi K, Oshshima N. Kono I. Effects of cryotherapy after contusion using real-time intravital microscopy. Med Sci Sports Exerc. 2005;37:1093–1098. doi: 10.1249/01.mss.0000169611.21671.2e. [DOI] [PubMed] [Google Scholar]
- Matijasevic Z, Snyder JE. Ludlum DB. Hypothermia causes a reversible, p53-mediated cell cycle arrest in cultured fibroblasts. Oncol Res. 1998;10:605–610. [PubMed] [Google Scholar]
- Mawhinney C, Jones H, Joo CH, Low DA, Green DJ. Gregson W. Influence of cold-water immersion on limb and cutaneous blood flow after exercise. Med Sci Sports Exerc. 2013;45:2277–2285. doi: 10.1249/MSS.0b013e31829d8e2e. [DOI] [PubMed] [Google Scholar]
- Mitchell CJ, Churchward-Venne TA, Parise G, Bellamy L, Baker SK, Smith K, Atherton PJ. Phillips SM. Acute post-exercise myofibrillar protein synthesis is not correlated with resistance training-induced muscle hypertrophy in young men. PLoS One. 2014;9:e89431. doi: 10.1371/journal.pone.0089431. [DOI] [PMC free article] [PubMed] [Google Scholar]
- Ohnishi N, Yamane M, Uchiyama N, Shirasawa S, Kosaka M, Shiono H. Okada T. Adaptive changes in muscular performance and circulation by resistance training with regular cold water immersion. J Therm Biol. 2004;29:839–483. [Google Scholar]
- Peake JM, Markworth JF, Nosaka K, Raastad T, Wadley GD. Coffey VG. Modulating exercise-induced hormesis: does less equal more? J Appl Physiol. 2015:in press. doi: 10.1152/japplphysiol.01055.2014. doi: 10.1152/japplphysiol.01055.2014 ) [DOI] [PubMed] [Google Scholar]
- Petrella JK, Kim JS, Mayhew DL, Cross JM. Bamman MM. Potent myofiber hypertrophy during resistance training in humans is associated with satellite cell-mediated myonuclear addition: a cluster analysis. J Appl Physiol. 2008;104:1736–1742. doi: 10.1152/japplphysiol.01215.2007. [DOI] [PubMed] [Google Scholar]
- Phillips BE, Williams JP, Gustafsson T, Bouchard C, Rankinen T, Knudsen S, Smith K, Timmons JA. Atherton PJ. Molecular networks of human muscle adaptation to exercise and age. PLoS Genet. 2013;9:e1003389. doi: 10.1371/journal.pgen.1003389. [DOI] [PMC free article] [PubMed] [Google Scholar]
- Puntel GO, Carvalho NR, Amaral GP, Lobato LD, Silveira SO, Daubermann MF, Barbosa NV, Rocha JB. Soares FA. Therapeutic cold: An effective kind to modulate the oxidative damage resulting of a skeletal muscle contusion. Free Radic Res. 2011;45:125–138. doi: 10.3109/10715762.2010.517252. [DOI] [PubMed] [Google Scholar]
- Roobol A, Carden MJ, Newsam RJ. Smales CM. Biochemical insights into the mechanisms central to the response of mammalian cells to cold stress and subsequent rewarming. FEBS J. 2009;276:286–302. doi: 10.1111/j.1742-4658.2008.06781.x. [DOI] [PubMed] [Google Scholar]
- Schneider CA, Rasband WS. Eliceiri KW. NIH Image to ImageJ: 25 years of image analysis. Nat Methods. 2012;9:671–675. doi: 10.1038/nmeth.2089. [DOI] [PMC free article] [PubMed] [Google Scholar]
- Shima A. Matsuda R. The expression of myogenin, but not of MyoD, is temperature-sensitive in mouse skeletal muscle cells. Zoolog Sci. 2008;25:1066–1074. doi: 10.2108/zsj.25.1066. [DOI] [PubMed] [Google Scholar]
- Takagi R, Fujita N, Arkawa T, Kawada S, Ishii N. Mika A. Influence of icing on muscle regeneration after crush injury to skeletal muscles in rats. J Appl Physiol. 2011;110:382–388. doi: 10.1152/japplphysiol.01187.2010. [DOI] [PubMed] [Google Scholar]
- Terzis G, Georgiadis G, Stratakos G, Vogiatzis I, Kavouras S, Manta P, Mascher H. Blomstrand E. Resistance exercise-induced increase in muscle mass correlates with p70S6 kinase phosphorylation in human subjects. Eur J Appl Physiol. 2008;102:145–152. doi: 10.1007/s00421-007-0564-y. [DOI] [PubMed] [Google Scholar]
- Timmerman KL, Lee JL, Fujita S, Dhanani S, Dreyer HC, Fry CS, Drummond MJ, Sheffield-Moore M, Rasmussen BB. Volpi E. Pharmacological vasodilation improves insulin-stimulated muscle protein anabolism but not glucose utilization in older adults. Diabetes. 2010;59:2764–2771. doi: 10.2337/db10-0415. [DOI] [PMC free article] [PubMed] [Google Scholar]
- Vaile J, O’Hagan C, Stefanivic B, Gill N. Askew CD. Effect of cold water immersion on repeated cycling performance and limb blood flow. Br J Sports Med. 2010;45:825–829. doi: 10.1136/bjsm.2009.067272. [DOI] [PubMed] [Google Scholar]
- Vary TC. IGF-I stimulates protein synthesis in skeletal muscle through multiple signaling pathways during sepsis. Am J Physiol Regul Integr Comp Physiol. 2006;290:R313–321. doi: 10.1152/ajpregu.00333.2005. [DOI] [PubMed] [Google Scholar]
- Versey NG, Halson SL. Dawson BT. Water immersion recovery for athletes: effect on exercise performance and practical recommendations. Sports Med. 2013;43:1101–1130. doi: 10.1007/s40279-013-0063-8. [DOI] [PubMed] [Google Scholar]
- Vierdort H. Anatomische, physiologische und physikalische daten und tabellen. Germany: Gustav Fisscher, Jena; 1906. [Google Scholar]
- Yamane M, Ohnishi N. Matsumoto T. Does regular post-exercise cold application attenuate trained muscle adaptation? Int J Sports Med. 2015;36:647–653. doi: 10.1055/s-0034-1398652. [DOI] [PubMed] [Google Scholar]
- Yamane M, Teruya H, Nakano M, Ogai R, Ohnishi N. Kosaka M. Post-exercise leg and forearm flexor muscle cooling in humans attenuates endurance and resistance training effects on muscle performance and on circulatory adaptation. Eur J Appl Physiol. 2006;96:572–580. doi: 10.1007/s00421-005-0095-3. [DOI] [PubMed] [Google Scholar]
- Yushkevich PA, Piven J, Hazlett HC, Smith RG, Ho S, Gee JC. Gerig G. User-guided 3D active contour segmentation of anatomical structures: significantly improved efficiency and reliability. Neuroimage. 2006;31:1116–1128. doi: 10.1016/j.neuroimage.2006.01.015. [DOI] [PubMed] [Google Scholar]