

Abstract
Various missense mutations in the cytoprotective protein DJ-1 cause rare forms of inherited parkinsonism. One mutation, M26I, diminishes DJ-1 protein levels in the cell but does not result in large changes in the three-dimensional structure or thermal stability of the protein. Therefore, the molecular defect that results in loss of M26I DJ-1 protective function is unclear. Using NMR spectroscopy near physiological temperature, we found that the picosecond–nanosecond dynamics of wild-type and M26I DJ-1 are similar. In contrast, elevated amide hydrogen/deuterium exchange rates indicate that M26I DJ-1 is more flexible than the wild-type protein on longer timescales and that hydrophobic regions of M26I DJ-1 are transiently exposed to solvent. Tryptophan fluorescence spectroscopy and thiol crosslinking analyzed by mass spectrometry also demonstrate that M26I DJ-1 samples conformations that differ from the wild-type protein at 37°C. These transiently sampled conformations are unstable and cause M26I DJ-1 to aggregate in vitro at physiological temperature but not at lower temperatures. M26I DJ-1 aggregation is correlated with pathogenicity, as the structurally similar but non-pathogenic M26L mutation does not aggregate at 37°C. The onset of dynamically driven M26I DJ-1 instability at physiological temperature resolves conflicting literature reports about the behavior of this disease-associated mutant and illustrates the pitfalls of characterizing proteins exclusively at room temperature or below, as key aspects of their behavior may not be apparent.
Keywords: protein stability, conformational dynamics, thiol crosslinking, DJ-1, PARK7, Parkinson’s disease
Introduction
Parkinson’s disease results from the progressive death of dopaminergic neurons in the midbrain. While the cause of most cases of Parkinson’s disease is unknown, the study of heritable forms of parkinsonism has helped elucidate the biochemical basis of dopaminergic neurodegeneration. Recessively inherited mutations in DJ-1 (PARK7) can cause parkinsonism.1 Human DJ-1 is a conserved, ubiquitously expressed homodimeric protein that participates in multiple pathways2–8 to protect cells against oxidative stress9–12 and to maintain proper mitochondrial function.13 In addition to parkinsonism, loss of DJ-1-mediated cytoprotection is also implicated in ischemia-reperfusion injury, as occurs in stroke and myocardial infarction.14,15 Despite abundant evidence that DJ-1 participates in multiple cytoprotective pathways, the details of its molecular activity remain incompletely understood.
Several pathogenic missense mutations in DJ-1 decrease protein stability, thereby causing disease.3,16 For example, the L166P, L10P, and P158Δ parkinsonian mutations disrupt the DJ-1 dimer, causing poor folding and proteolytic degradation of the protein.1,17 However, several other disease-associated mutants in DJ-1 are more structurally benign16,18,19 and thus the molecular basis of their pathogenicity is not understood.
M26I is an example of a DJ-1 mutant where the underlying molecular defect that leads to disease is obscure. The steady-state level of M26I DJ-1 is lower than that of the wild-type protein in cell culture3,20,23 and in vivo,21 indicating reduced protein stability in the cellular environment. However, X-ray crystallography, NMR, and biophysical studies indicate that M26I DJ-1 is highly structurally similar to the wild-type protein and both proteins have comparable stability to thermal and chemical denaturation.16,17 A prior study had determined that M26I DJ-1 was unstable at room temperature and did not have a defined thermal unfolding transition,19 although the same group later determined that this instability was an artifact arising from histidine tagging and oxidation of the sample.22 Importantly, untagged or tag-cleaved M26I behaves similarly in all tested respects to wild-type DJ-1 in vitro,16,17 demonstrating that M26I does not result in major changes in DJ-1 ground state stability, structure, or oligomerization. Therefore, it is not clear from prior work why M26I DJ-1 is less stable in cells than is the wild-type protein.
The absence of a structural explanation for the established pathogenicity of M26I DJ-1 suggests that the conformational dynamics of the protein may be changed by the mutation. The dynamical hypothesis for M26I DJ-1 pathogenesis is untested, as no comprehensive study of the dynamics of DJ-1 or any of its pathogenic mutants has been reported to date. Indirect evidence for the dynamical hypothesis for M26I pathogenicity is that recombinant M26I DJ-1 is prone to spontaneous aggregation in vitro that is not observed for the wild-type protein, possibly due to the transient sampling of more aggregation-prone conformations.19,17 The enhanced in vitro aggregation of M26I DJ-1 would likely be manifest as greater turnover and reduced steady-state levels of the protein in vivo. Dynamically driven sampling of aggregation-prone conformations of M26I DJ-1 would provide a rare example of a direct connection between aberrant protein conformational dynamics and disease, although the molecular basis for M26I instability has not been elucidated.
Here, we show that the M26I mutation does not alter the picosecond–nanosecond timescale dynamics of DJ-1 but does increase sampling of unstable conformations on longer timescales as detected using hydrogen/deuterium exchange (HDX) NMR spectroscopy and thiol crosslinking. These transiently sampled conformations of M26I DJ-1 expose the hydrophobic core to solvent. In particular, thiol crosslinking captures a Cys106-Cys106 crosslink in M26I DJ-1 at 37°C that is not observed at lower temperatures or in the wild-type protein. This crosslinked species demonstrates that M26I samples dimeric conformations at 37°C that are markedly different from those occupied by the wild-type protein. The increased sampling of a minor population of unstable conformations at physiological temperature results in pronounced aggregation of M26I DJ-1 at 35–37°C but not at lower temperatures. Our results provide an explanation for why the M26I mutation destabilizes the protein in cells and rationalize prior conflicting studies of recombinant M26I stability conducted at lower temperatures and cellular work conducted at 37°C. These findings also illustrate a common and underappreciated limitation of in vitro experiments performed at room temperature, where the functional consequences of protein conformational heterogeneity may not be fully evident.
Results
M26I and wild-type DJ-1 have similar picosecond–nanosecond dynamics at 35°C
Consistent with previous NMR and X-ray crystallographic results, the solution structures of wild-type and M26I DJ-1 are comparable based on their highly similar two dimensional (2D) 1H–15N heteronuclear single quantum coherence (HSQC) NMR spectra at 35°C (Supporting Information Fig. S1).16,17 This temperature was chosen because we sought to characterize DJ-1 near physiological temperature; however experiments at 37°C resulted in aggregation of M26I DJ-1 (see below). The similar structures but divergent stabilities of wild-type and M26I DJ-1 suggest the hypothesis that the M26I mutation may alter the conformational dynamics of DJ-1.
We characterized the picosecond–nanosecond (ps-ns) time-scale dynamics of DJ-1 using NMR spectroscopy by measuring the R1 and R2 relaxation rates as well as Nuclear Overhauser Effect (NOE) ratios at 500 MHz and 35°C. The R2/R1 and NOE ratios were similar for wild-type and M26I DJ-1 at 35°C (Supporting Information Fig. S2 and Table S1). NOE ratios are bound by 0 and 1, with lower values indicating areas of increased motion in the backbone of a protein.17 The averaged NOE ratios at 35°C for both wild-type (0.78±0.10) and M26I DJ-1 (0.77±0.087) are lower than previously reported values at 27°C (0.9±0.09),17 consistent with greater protein motion at higher temperature.
Lipari-Szabo model free analysis was performed using the measured R1, R2, and NOE ratios, generating generalized order parameters (S2) that describe the extent of motion of each assigned amide N—H pair using a “vector in a cone” description67. S2 is bound by 0 and 1, where lower values indicate areas of increased mobility of the backbone peptide groups.24,25 The S2 values for wild-type and M26I DJ-1 at 35°C are similar (Supporting Information Table S2), with average values of 0.91±0.079 and 0.93±0.054, respectively (Fig. 1, Supporting Information Table S1). We note that these values are high, indicating that DJ-1 is fairly rigid on the ps-ns timescale. These calculated S2 values are robust to changes in the selection of residues used for initial diffusion tensor calculation and different random number seeds, indicating good convergence in the calculations and low sensitivity to initial parameters.
Figure 1.

Wild-type and M26I DJ-1 have similar ps-ns dynamics at 35°C. The general order parameter (S2) for wild-type (WT, black) and M26I DJ-1 (red) at 35°C obtained from FAST ModelFree are plotted per residue. Picosecond-nanosecond (ps-ns) motions for both proteins are nearly identical at 35°C. The regions without a reported value indicate amino acids that could not be analyzed by FAST ModelFree, primarily due to unobserved or overlapping resonances in the NOE spectra. A schematic of the secondary structure of DJ-1 is shown below for reference (rectangles=β-sheet, arrows=α-helix).
The M26I mutation enhances backbone amide H/D exchange near physiological temperature
Slower timescale (minutes to hours) conformational heterogeneity of DJ-1 was investigated using NMR-detected HDX. Because slow conformational fluctuations will increase the solvent accessibility (and hence HDX rate) of backbone amide groups, NMR-detected HDX is a sensitive and site-specific probe of dynamical processes that occur on longer timescales than those characterized using NMR relaxation-based methods.
HDX reveals that the hydrophobic core of M26I DJ-1 is substantially less solvent-protected than that of wild-type DJ-1. In contrast, the surface residues of both proteins have comparable HDX rates, consistent with a high degree of solvent exposure and rapid exchange. HDX rates measured at 35°C were converted to protection factors (log10PF; see Materials and Methods26,27) [Fig. 2(A), Supporting Information Fig. S4 and Table S3] and then mapped onto the crystal structure of dimeric DJ-1 [Fig. 2(B)]. Despite being structurally similar to the wild-type protein, M26I DJ-1 samples conformations that enhance exchange for residues 15–35, 45–55, 110–120, 130–135, 140–190.
Figure 2.
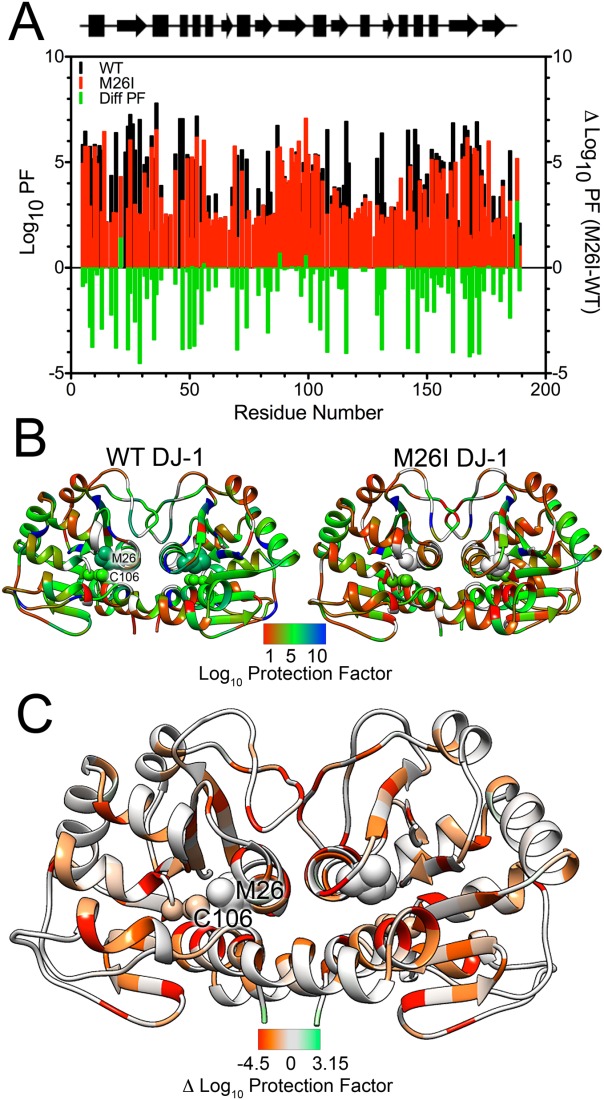
HDX-detected dynamics are globally enhanced in M26I DJ-1 at 35°C. A: Calculated log10 HDX protection factors (Log10PF, left Y-axis) for wild-type (WT, black) and M26I (red) DJ-1. Lower Log10PF values correspond to residues that more rapidly exchange backbone amide hydrogen atoms with solvent deuterons. Difference Log10PF values are shown in the green bars (right Y-axis) and quantify the lower protection (more rapid exchange) of M26I DJ-1 compared to wild-type protein. B: Log10PF values from (A) have been mapped onto the structure of wild-type (WT, left) and M26I (right) DJ-1 dimer. Met26 and Cys106 are shown in sphere rendering and labeled in one monomer. The apparent proximity of these residues is an effect of this view; they are approximately 18 Å apart in each monomer. All residues for which a Log10PF could not be assigned are shown in gray. Red indicates lower protection (faster exchange) with blue indicates greater protection (slower exchange). M26I DJ-1 is more exchange-active than WT DJ-1, particularly in the hydrophobic core of the protein. C: Difference Log10PF (M26I Log10PF – WT Log10PF) mapped on to the dimer of M26I DJ-1. Red indicates areas that more rapidly exchange with solvent in M26I DJ-1 than in wild-type protein and green indicates the converse. Areas that are similar between the two proteins are gray. The enhanced exposure of the hydrophobic core of M26I DJ-1 to solvent is evident.
The elevated H/D exchange in the core of M26I DJ-1 is noteworthy, as it indicates that the mutant protein transiently samples conformations that deviate markedly from the crystal structure. This is highlighted by inspection of difference log10PF, which show that the hydrophobic core of DJ-1 is less protected (and hence more solvent exposed) in M26I DJ-1 [Fig. 2(C)]. Because the hydrophobic core of DJ-1 spans both monomers in the dimer, the elevated exchange in the core of M26I DJ-1 may involve transient dimer opening. However, M26I has been shown to be dimeric using sedimentation equilibrium centrifugation, NMR, X-ray crystallography, and thiol crosslinking (below), indicating that a total dissociation of the dimer is unlikely.16,17,19,20
Tryptophan (Trp) fluorescence spectroscopy at 37°C was used as an additional probe of conformational heterogeneity in M26I DJ-1. The quantum yield of Trp is sensitive to its local environment, and thus Trp can serve as a reporter of site-specific environmental changes resulting from mutation of residue 26. Human DJ-1 contains no Trp residues; therefore we introduced Trp at two locations in the protein (residues Tyr141 and Leu101) that exhibited strongly differing HDX behavior in response to the M26I mutation [Fig. 2(C), Supporting Information Table S3]. These sites were chosen because they natively contain Trp in homologs of DJ-1 (see Materials and Methods) and thus are likely to tolerate mutation to Trp with minimal structural perturbation. Tyr141 is located in a region of DJ-1 with low log10PF and whose HDX exchange rate is insensitive to the M26I mutation (log10PFWT=2.09 vs. log10PFM26I=2.08) (Supporting Information Table S3). Consistent with the HDX results, the fluorescence quantum yield of Y141W is similar in wild-type and M26I DJ-1 (Fig. 3). In contrast, the L101W substitution is located at a position that becomes more mobile as a result of the M26I mutation, exhibiting a HDX log10PF decrease from 4.35 in wild-type to 1.75 in M26I DJ-1 (Supporting Information Table S3). Supporting the HDX results, the normalized molar fluorescence emission of M26I/L101W DJ-1 is ∼20% lower than that of L101W alone, indicating that Trp101 fluorescence in the M26I mutant is partially quenched due to changes in its local environment (Fig. 3). These results cannot be due to large changes in DJ-1 structure resulting from the Trp mutations, as both the Y141W and L101W mutations have only small effects on the thermal stability and secondary structure of DJ-1 (Supporting Information Fig. S5). However, we did not characterize the conformational dynamics of these Trp mutant proteins directly and thus cannot exclude a more subtle dynamical effect resulting from Trp introduction that may contribute to our observations. As an additional caveat, we note that Met26 and Leu101 are separated by ∼14 Å, which is too distant for a direct structural interaction between these two sites of mutation in M26I/L101W DJ-1, but still could be subject to more subtle perturbation that may contribute to Trp fluorescence changes.
Figure 3.
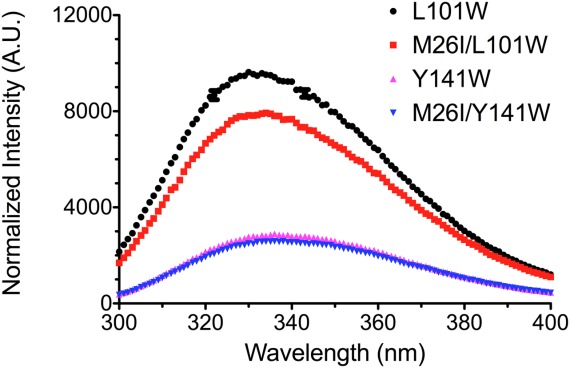
Tryptophan fluorescence emission spectra reveal site-specific differences in M26I DJ-1 solvent exposure. Tryptophan emission spectra for L101W (black circle), M26I/L101W (red square), Y141W (magenta triangle), and M26I/Y141W (blue inverted triangle) obtained at 37°C. The M26I mutation results in quenching of L101W DJ-1 fluorescence, indicating Trp101 is in an altered environment in M26I DJ-1. Leu101 is in a dynamic area of DJ-1 that is sensitive to the M26I substitution in HDX (Log10PF WTL101=4.35, Log10PF M26IL101=1.75.) In contrast, no differences are observed in the spectra for Y141W and M26I/Y141W DJ-1. Tyr141 is in a dynamic region of DJ-1 that is not sensitive to the M26I mutation (Log10PF WTY141=2.09, Log10PF M26IY141=2.08.).
Thiol crosslinking indicates that M26I DJ-1 is more flexible than wild-type DJ-1 at 37°C
We have recently described the use of thiol crosslinking to probe DJ-1 flexibility.28 DJ-1 contains three free thiols per monomer, only one of which (Cys53) is highly solvent accessible [Fig. 4(A)]. Cys53 is ∼3.3 Å from its symmetry mate in the DJ-1 dimer and this pair should be readily crosslinked, while the other cysteines (Cys106 and Cys46) are farther separated. However, conformational fluctuations in DJ-1 can transiently expose the other cysteines and make them available for reaction, increasing the number of crosslinked DJ-1 species that can be observed in sodium dodecyl sulfate-polyacrylamide gel electrophoresis (SDS-PAGE).28 Therefore, thiol crosslinking is a sensitive probe of large-scale conformational flexibility in DJ-1.
Figure 4.

Thiol crosslinking shows that M26I DJ-1 is more dynamic than wild-type DJ-1 at physiological temperature. A: Left: Cysteine crosslinking with BMOE for wild-type (WT), M26I, and an engineered M26L mutant DJ-1 at 22 and 37°C resolved by SDS-PAGE. At 37°C, M26I DJ-1 forms a faster migrating crosslinked dimeric species (indicated) that is absent at 22°C and also not seen for WT DJ-1. This faster-migrating species is present but ∼6-fold less abundant in the M26L mutant that relieves the steric conflict introduced by the M26I mutation. Monomer and dimer DJ-1 bands are indicated. Right: Location of all six cysteine residues in the DJ-1 dimer is shown as a ribbon diagram. B: The MS/MS spectrum of the Cys53-Cys53 BMOE crosslinked peptide in the dominant dimer band (“DJ-1 dimer” in A). The sequence and predicted Y daughter ion series are shown with all detected Y ion species labeled in the MS/MS spectrum. C: The MS/MS spectrum of the Cys106-Cys106 BMOE crosslinked peptide from M26I DJ-1, which is only found in the fast-migrating dimeric species at 37°C (“Fast-migrating DJ-1 dimer” in A). As in (B), the sequence and predicted Y daughter ion series are shown with Y ion peaks labeled.
DJ-1 was crosslinked using the homobifunctional thiol crosslinker bismaleimidoethane (BMOE) both at 21°C and at 37°C. A dominant dimer band at ∼50 kDa is observed in SDS-PAGE of both wild-type and M26I DJ-1 at both temperatures [Fig. 4(A)]. In-gel trypsinization followed by MS of this dominant 50 kDa band identified ions with the expected mass of a Cys53-Cys53 BMOE crosslinked peptide pair in the +4 and +5 charge states. The MS/MS spectrum of this 3423.64 amu species in its +4 state (m/z=856.92) contains a well-defined series of y-type fragment ions [Fig. 4(B)] and demonstrates unambiguously that it is the Cys53-Cys53 crosslinked tryptic peptide.
M26I DJ-1 also exists as a faster-migrating dimeric crosslinked species (∼37 kDa) at 37°C that is much less prominent at 21°C and in wild-type DJ-1 [Fig. 4(A)]. In addition to the Cys53-Cys53 crosslink observed in wild-type DJ-1, MS analysis of the tryptic peptides from the faster migrating dimeric species also identified ions whose masses were consistent with a Cys106-Cys106 BMOE crosslinked peptide pair (4894.62 amu) in the +6 and +7 charge states. MS/MS analysis of the +7 ion shows that it has the y-type daughter ion series expected for the BMOE Cys106-Cys106 crosslinked tryptic peptides [Fig. 4(C)]. While Cys53 is within 3.3 Å of its symmetry mate in the DJ-1 dimer and is easily crosslinked by BMOE, Cys106 is nearly 25 Å from its symmetry mate in the crystal structure of the DJ-1 dimer. This larger Cys106-Cys106 distance in the DJ-1 crystal structure cannot be spanned by BMOE and extends across the hydrophobic core of the protein. Therefore, the presence of the Cys106-Cys106 BMOE crosslink shows that M26I DJ-1 transiently samples dimeric conformations at 37°C that result in exposure of the hydrophobic core and differ greatly from the crystal structure.
In contrast to the BMOE thiol crosslinking result, crosslinking with the amine-reactive disuccinimidyl suberate (DSS) (Supporting Information Fig. S6) shows little difference between wild-type and M26I DJ-1 at room temperature and at 37°C. This is expected, as DSS can crosslink many distinct lysine residues on the surface of the protein and these mobile surface-exposed sites are not expected to be sensitive to changes in the conformational dynamics of M26I DJ-1.
M26I DJ-1 aggregates at physiological temperature
Prior studies reported that M26I DJ-1 is more prone to aggregation in vitro, although a molecular explanation for this aberrant behavior has been elusive. We monitored the aggregation of recombinant M26I in vitro by measuring scattering of 400 nm light as a function of temperature [Fig. 5(A)]. Both wild-type and M26I DJ-1 remained soluble from 15 to 30°C. Aggregation of M26I DJ-1 was apparent at 35°C and exacerbated at 37°C, with a lag phase of ∼20 h [Fig. 5(A)]. In contrast, wild-type DJ-1 did not aggregate detectably at these temperatures [Fig. 5(A)]. The onset of aggregation for M26I DJ-1 at physiological temperature provides an appealing explanation for its reduced stability in cells grown at 37°C3,23 and prior reports of stable recombinant protein, which is typically handled at lower temperatures.16,17
Figure 5.
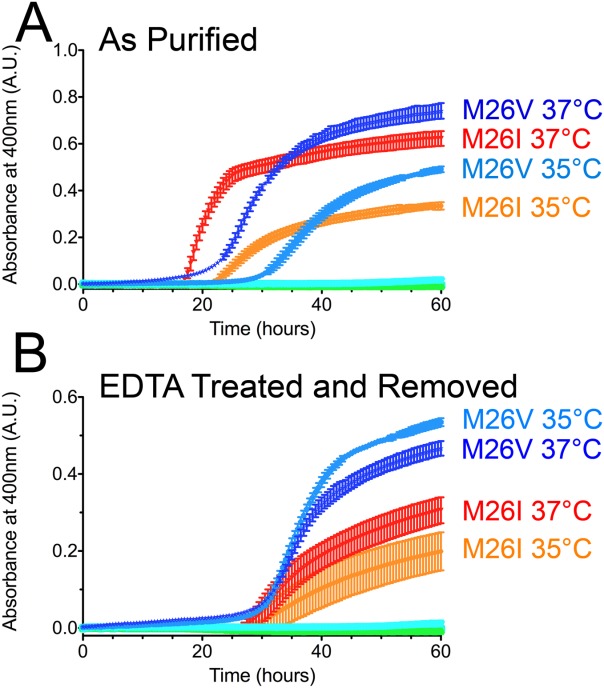
M26I DJ-1 is aggregation-prone at physiological temperature in vitro. A: Aggregation of wild-type (WT), M26I, M26L, and M26V at 30, 35, and 37°C. There is no observable aggregation for wild-type and M26L DJ-1 at any of these temperatures (cyan and green symbols at baseline). In contrast, M26I and M26V DJ-1 aggregate extensively at 35 and 37°C (labeled) but not at 30°C. B: Aggregation was performed as in (A), but the samples were treated with 10 mM EDTA and dialyzed to remove any trace metal contamination from the proteins before the start of the experiment. M26I and M26V DJ-1 still aggregate at 35 and 37°C (labeled), although to a lesser extent than in (A). All samples were measured in triplicate (plotted as avg±SD.).
The exposure of DJ-1 to transition metals such as Ni2+ and Fe3+ has been reported to enhance its instability.29 As all proteins used in this study were purified by Ni2+-NTA chromatography, we tested the influence of trace metal contamination by treating the samples with a large excess of EDTA followed by dialysis. Consistent with the prior report29, the chelation and removal of trace metal diminishes M26I DJ-1 aggregation, although M26I is still unstable and aggregates at 35–37°C [Fig. 5(B)].
The crystal structure of M26I DJ-1 shows that the mutation creates both a small cavity within the hydrophobic core and a steric conflict with the neighboring Ile31.16 The steric clash with Ile31 is the most obvious structural change resulting from the M26I mutation, but it is a relatively minor 0.7 Å displacement. To determine whether the clash at Ile31 in M26I DJ-1 is responsible for the increased flexibility that drives aggregation of the protein, we created both the M26L and M26V mutations (Fig. 6). The M26L substitution eliminates the β-branched sidechain at position 26 and alleviates the clash with Ile31.16 Many close homologues of DJ-1 natively have a Leu at position 26, indicating that this substitution is well-tolerated and preserves DJ-1 function33. M26L DJ-1 does not aggregate at 37°C (Fig. 5) and forms the Cys106-Cys106 BMOE crosslinked species less efficiently than does M26I DJ-1 at 37°C [Fig. 4(A)]. A comparison of the Coomassie-stained band intensities for the faster-migrating dimeric species in M26I and M26L DJ-1 in Figure 4(A) shows that the Cys106-Cys106 crosslinked species is 5.9-fold more abundant in M26I than it is in M26L DJ-1 as determined using integrated band intensities normalized to the intensities of the dominant dimer band in each lane calculated using ImageJ.31
Figure 6.
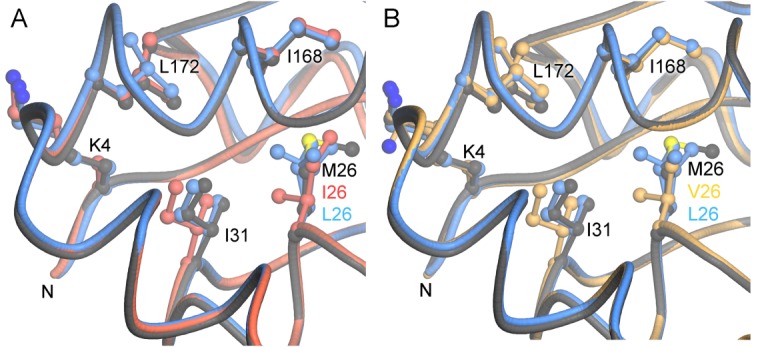
The aggregation-inducing M26I and M26V mutations cause similar steric conflicts with Ile31. A: The local environment of residue 26 is shown for wild-type (dark gray), M26L (blue), and M26I (red) DJ-1. B: A similar superposition to (A), but with M26V (gold). The conflict with Ile31 is the most prominent structural change resulting from mutation of Met26 to Ile (A) or Val (B). The M26L mutation alleviates this steric clash. This steric conflict could communicate changes at the buried residue 26 to the exterior of the protein, particularly the region containing both the N-terminus and C-proximal residues such as Ile168 and Leu172 (labeled). This figure was made with POVScript+.30
The destabilizing effect of β-branched sidechains at residue 26 was confirmed by the extensive aggregation observed for the M26V mutant at 35–37°C (Fig. 5). Like M26I (but unlike M26L), M26V places a hydrophobic β-branched amino acid at residue 26. The crystal structure of M26V DJ-1 shows that the mutation is highly structurally conservative, with a Cα-RMSD of 0.14 Å with M26I DJ-1 (Fig. 6). The most significant structural change is the displacement of Ile31 resulting from a clash with the Cγ1 atom of Val26, similar to that observed in M26I DJ-1 (Fig. 6). This demonstrates that the steric conflict between Ile26 and Ile31 is the initiating molecular defect that ultimately leads to M26I DJ-1 instability.
Discussion
In this study, we found that the structurally conservative parkinsonian M26I DJ-1 mutation transiently samples unstable conformations near physiological temperature. M26I DJ-1 provides an attractive system in which to explore the connection between transient conformational fluctuations and disease, as both X-ray crystallography and NMR spectroscopy indicate that M26I DJ-1 is highly structurally similar to wild-type protein despite being a disease-causing mutation.16,17 Moreover, the thermal stability of M26I DJ-1 has been repeatedly shown to be only ∼5°C lower than wild-type DJ-1.16,17 Therefore, the lower cellular stability of M26I DJ-1 is not due to large changes in its ground state molecular stability. Prior reports indicating that M26I DJ-1 is greatly destabilized relative to the wild-type protein19 have been revisited and revised by the same group,22 who state that histidine tagging and protein oxidation artifactually destabilized M26I DJ-1 in their prior work. In the same report,22 the authors show that M26I DJ-1 is less prone to oxidation at the functionally important Cys106 residue than is the wild-type protein, which is broadly consistent with our finding that M26I DJ-1 samples aberrant conformations that permit Cys106-Cys106 BMOE crosslinking at 37°C.
Considered together, our data suggest a model involving a slow transient opening of the M26I DJ-1 dimer that increases solvent exposure of its hydrophobic core, especially near physiological temperature. While the M26I mutation does not alter fast timescale (ps-ns) DJ-1 backbone dynamics, difference log10PF values for HDX show a more exchange-active core in M26I DJ-1 and greater H/D exchange at the edges of the central β-sheet [Fig. 2(C)], suggesting that the sheet “frays” at its edges. Some prior studies have reported slightly reduced secondary structural content for M26I DJ-1,17,19 which would be consistent with a transient loss of interstrand hydrogen bonds in these regions. Supporting this interpretation, the Trp fluorescence and thiol crosslinking data both suggest that buried regions of the crystal structure become more solvent-exposed in M26I at 37°C. In particular, the appearance of a Cys106-Cys106 BMOE-crosslinked dimer species in M26I DJ-1 at 37°C that is much less abundant at lower temperature, in the wild-type protein, and in the stable M26L variant indicates that increased solvent exposure of buried portions of M26I DJ-1 is a temperature-dependent phenomenon. This Cys106-Cys106 crosslinked species requires that M26I DJ-1 sample conformations that are different from the crystal structure in order to bring two Cys106 residues into crosslinking proximity across the hydrophobic core of dimeric DJ-1, consistent with the observation of enhanced HDX in the central buried β-sheet of M26I DJ-1. In addition, the Cys106-Cys106 crosslink unambiguously establishes that this unstable species is dimeric.
The exposure of hydrophobic areas of DJ-1 near physiological temperature is the likely cause of the enhanced aggregation that we and others have observed in M26I DJ-1. We find that M26I DJ-1 aggregation is only apparent (over a 60 h timescale) at 35–37°C, indicating that M26I is a temperature-sensitive mutant. Importantly, M26I DJ-1 aggregation does not involve thermal denaturation, as the melting temperature for M26I DJ-1 is ∼60°C, compared to ∼65°C for wild-type DJ-1.16,17,19,32 This temperature is well above 37°C and indicates that M26I DJ-1 is not aggregation-prone due to a significant loss of ground-state thermodynamic stability leading to denaturation. Instead, the in vitro behavior of M26I DJ-1 is better explained by a dynamical model, whereby transient excursions from the stable ground state of the protein allow sampling of more aggregation-prone species in solution at physiological temperature. DJ-1 aggregation in vitro would likely manifest as protein degradation in the cell, and thus would account for the reduced level of M26I DJ-1 observed in cells grown at 37°C. Attractively, the onset of dynamically driven instability in M26I DJ-1 at physiological temperature resolves conflicting reports of this mutant’s stability in vitro at room temperature and instability in cells at 37°C.
The sampling of aggregation-prone conformations of M26I DJ-1 is initiated by the steric conflict between Ile26 and Ile3116 causing an ∼0.7 Å displacement of Ile31 in M26I DJ-1. This clash is relieved by the engineered M26L mutant, which abrogates both protein aggregation and Cys106-Cys106 BMOE crosslinking, indicating that the Ile26-Ile31 clash is an important contributor to M26I DJ-1 destabilization.16,33 The damaging effect of placing β-branched amino acids at residue 26 in DJ-1 is confirmed by the M26V mutation, which also clashes with Ile31 and consequently causes enhanced aggregation of the protein. Our data indicate that the minor, local structural change caused by the introduction of a β-branched amino acid at residue 26 causes global changes in DJ-1 slow conformational dynamics that lead to the eventual accumulation of protein aggregates. We also note that trace transition metals in the DJ-1 purified in this work seem to enhance aggregation, consistent with a prior finding.29 This is intriguing, as iron (another transition metal) levels are elevated in parkinsonian nigral tissue34 and might influence DJ-1 stability. The basis of this effect is a direction for future work.
M26I DJ-1 appears to be a case where principally dynamical, rather than structural, changes in a protein can be connected with instability and disease. Other examples where protein dynamics have been connected to pathological dysfunction include the deletion of a single amino acid (F508) in the cystic fibrosis transmembrane conductance regulator (CFTR) protein, which causes areas of inherent disorder and flexibility resulting in disease.35,36 An additional example is copper-zinc superoxide dismutase (Cu-Zn SOD), where mutations associated with heritable forms of amyotrophic lateral sclerosis (ALS) cause changes in protein dynamics.37–39 DJ-1 is an easily handled protein amenable to study using multiple biophysical approaches and thus makes an attractive system in which to further explore the connection between disturbed protein dynamics and disease. Furthermore, as the list of disease-associated proteins with perturbed conformational dynamics grows, we propose that aberrant protein dynamics may be a more common contributor to dysfunction and disease than is currently appreciated.
More generally, our results indicate that routine in vitro characterization of proteins lower than physiological temperature may provide an inaccurate view of their behavior in some instances. This has been well established in the extreme case of X-ray crystallography of cryocooled samples, where proteins are characterized at ∼−170°C. In these cases, significant alterations to the degree and correlation of sidechain disorder, which is involved in functionally relevant protein dynamics, has been described.40 The present study indicates that even the modest ∼15°C difference between room temperature and human physiological temperature is enough to conceal important aspects of protein conformational behavior. As the characterization of protein dynamics becomes more widespread and routine, our results indicate that samples should be studied at their physiologically relevant temperatures wherever possible.
Materials and Methods
Protein expression and purification
Human wild-type and mutant (M26I, M26V, M26L, L101W, Y141W, M26I Y141W) DJ-1 proteins were expressed from pET15b (EMD Millipore, Darmstadt, Germany) constructs41 and purified using Ni2+ affinity chromatography as previously described41 except that all buffers contained freshly added 2.5 mM dithiothreitol (DTT). Uniformly 15N-labeled proteins (wild-type, M26I DJ-1) were expressed as previously described.28
Purified proteins were dialyzed against storage buffer (25 mM HEPES pH 7.5, 100 mM KCl, 2.5 mM DTT) overnight at 4°C and concentrated to 1 mM using an ultrafiltration concentrator with a 10 kDa MWCO regenerated cellulose membrane (EMD Millipore), snap-frozen in small aliquots on liquid nitrogen, and stored at −80°C until needed. All proteins ran as a single band in overloaded Coomassie Blue stained SDS-PAGE gel and had correct intact masses determined using electrospray mass spectroscopy (Redox Biology Center, UNL). All proteins had the hexahistidine tag removed by thrombin cleavage, resulting in a “GSH” vector-derived sequence at the N-terminus. Only DJ-1 that was >95% reduced at Cys106 as determined by mass spectrometry was used.
NMR sample preparation, data collection, and processing
NMR sample preparation
For NMR experiments, purified 15N-labeled DJ-1 samples were dialyzed against 25 mM 2-(4-morpholino)ethanesulfonic acid (MES) pH 6.5, 25 mM NaCl, 2.5 mM DTT and concentrated to 0.9 mM. The 15N labeling efficiency was determined from intact masses using reverse phase liquid chromatography-mass spectrometry (LC-MS) as detailed previously.16,28 Proteins were diluted in water and analyzed using an Agilent 1200 LC system (Agilent Technologies, Santa Clara, CA) and a Q-Trap-4000 MS (AB Sciex, Framingham, MA) at the UNL Redox Biology Center Metabolomics and Proteomics Core Facility. Samples for T1, T2, and NOE measurements were prepared by adding D2O to a final concentration of 10% by addition of 99.9% D2O (Sigma-Aldrich, St. Louis, MO) and the sample was transferred to a 5 mm, high-throughput 7″ standard series NMR tube (Norell, Marion, NC).
Samples for NMR-detected H/D Exchange (HDX) experiments were dialyzed against 10 mM ammonium acetate pH 6.7 and 5 mM DTT at ∼21°C. Samples were flash frozen in liquid nitrogen, lyophilized, and stored at −80°C until needed. HDX was performed by rapidly resuspending the lyophilized protein in 25 mM MES pH 6.1, 25 mM NaCl, 2.5 mM DTT in 100% D2O. Prior to the experiment, the solution pH was adjusted to 6.1 with a 40% solution of NaOD (Sigma-Aldrich) and the pD calculated according to: pDcorrected=pH+0.442 (therefore the final pD of this buffer was 6.5).
T1, T2 relaxation and heteronuclear NOE spectra
All 2D 1H–15N heteronuclear single quantum coherence (HSQC) spectra were collected using a Bruker AVANCE DRX 500 MHz spectrometer equipped with a 5 mm triple resonance cryogenic probe (1H, 13C, and 15N) with a Z-axis gradient (Bruker BioSpin, Billerica, MA) at the University of Nebraska-Lincoln’s Research Instrumentation Facility. 2D 1H–15N HSQC spectra acquired for T1 (Bruker pulse sequence: hsqct1etf3gpsi), T2 (hsqct2etf3gpsi), and NOE (hsqcnoeetf3gpsi) measurements were collected at 35°C. The delays for T1 (0.2696, 0.05392, 0.5392, 0.005392, 0.4044, 1.0784, 0.1348, 0.6740, 0.2696 s) and T2 (0.0176, 0.0352, 0.0528, 0.0704, 0.0880, 0.1056, 0.1231, 0.1408, 0.1584, 0.1760, 0.1936, 0.2112 s) relaxation experiments were randomized to minimize systematic error. All spectra were collected using a total of 2048 and 256 data points and spectral sweep widths of 7309.942 and 2027.164 Hz along the proton and nitrogen dimensions, respectively. Free-induction decays were zero-filled, Fourier transformed, phased, and baseline corrected using NMRPipe43 and analyzed using NMRViewJ.44 Chemical shift assignments for wild-type DJ-1 were retrieved from the Biological Magnetic Resonance Data Bank with accession number BMRB 17507.17 The 35°C spectra are shifted ∼0.16 ppm in the hydrogen dimension compared to the previously collected 27°C spectra,17 as expected with an increase in temperature.
The relaxation times (T1, T2) for each amide resonance were calculated by fitting a decay curve [see Eq. 1] to the intensity of each peak plotted against the associated delay (in ms), where It is the intensity of each peak at the specified delay time t, and I0 is the initial steady-state intensity. The inverse of the relaxation times produced relaxation rates (R1, R2) (converted to s−1).
| 1 |
Interleaved 2D 1H–15N heteronuclear NOE spectra were collected using 2048 and 128 data points along the direct and indirect axis, respectively, with or without 5 s of proton saturation applied with a 5 s relaxation interval. The NOE values were calculated by dividing the peak intensities for resonances in the saturated (Isat) spectrum by the corresponding resonance intensity in the unsaturated (Iunsat) spectrum [see Eq. 3]:
| 3 |
The errors for the NOE ratios in Eq. 3 (σf) were calculated using propagation of error from each heteronuclear NOE measurement according to the following formula:
| 4 |
where σsat and σunsat are the errors associated with the saturated and unsaturated NOE intensities, respectively. σsat and σunsat were estimated using the average background noise for each spectrum. R2/R1 and heteronuclear NOE ratio data used for the generalized order parameter calculation are presented in Supporting Information Figure S3.
The R1, R2 relaxation rates and heteronuclear NOE data were used to calculate the generalized order parameter (S2), internal motion (τe), chemical exchange (Rex), and the overall correlation time (τc) using Lipari-Szabo model free parameters in the FAST ModelFree program (Facile Analysis and Statistical Testing for ModelFree), interfaced with ModelFree 4.20.25,45,46 PDBInertia was used to translate the centers of mass of the wild-type (PDB 1P5F)47 and M26I DJ-1 (PDB 2RK4)16 coordinates to the origin. For each R2/R1 list and PDB file from PDBInertia, the R2R1-Diffusion program was used to predict the axially symmetric diffusion tensor based on the approach by Tjandra et al.48 The NMR spin-relaxation data (R1, R2, NOE) and PDBs obtained from R2R1-Diffusion were then input into the FAST ModelFree software package.25 To ensure that the dynamics analysis was not trapped in a local minimum, the random seed value was changed for each run and the same seed value was never used more than once. Further, each FAST ModelFree run was done in triplicate to verify that the output values were reproducible.
Temperatures for all NMR experiments were calibrated using 100% ethylene glycol as a temperature standard. Briefly, the separation between the OH resonances and the CH2 resonances in ethylene glycol were measured (Δ, ppm) and the sample temperature calculated, according to the following equation: T=(4.637−Δ)/0.009967, where T is the calculated temperature (Kelvin), and Δ is the shift difference (in ppm) between OH and CH2 peaks (Bruker Instruments, Inc. VT-calibration manual). The final temperature of the sample was estimated to be 35°C based on the temperature calibration (see above), chemical shifts of wild-type DJ-1, and protein behavior at elevated temperatures (see aggregation data in Fig. 5).
H/D exchange NMR spectroscopy
For HDX measurements, protonated 15N-labeled proteins were lyophilized and resuspended in 500 µL of 25 mM MES pH 6.5 (pD 6.1, see above), 25 mM NaCl, 2.5 mM DTT in 100% D2O. 2D 1H–15N HSQC spectra (sfhmqcf3gpph) were collected every 10 min for 60 h at 35°C. To ensure lyophilization did not cause irreversible changes in DJ-1, we verified that the 2D 1H–15N HSQC spectra obtained from protein before and after lyophilization and resuspension were identical. Spectra were collected using a total of 2048 and 256 data points with spectral sweep widths of 7309.942 and 3041.362 Hz along the proton and nitrogen dimensions, respectively. The pulse program was edited to use a REBURP shape pulse49 and to include a delay equal to 300 s. This delay occurs before data collection to allow the cryoprobe coil temperature to equilibrate after each acquisition. The 300-s delay was only applied for subsequent acquisitions in the first 60 h of data acquired. Each spectrum had a REBURP pulse duration of 1 ms, receiver gain set to 3k, SP23 set to 24.05 dB, SP24 set to 13.11 dB, PC9 set to 3 ms, thereby making each SoFAST-HSQC’s total acquisition time 5 min 8 s.
HDX rates (kex) were calculated similarly to T1 and T2 relaxation rates (see above). A protection factor (PF) was calculated by dividing an estimated intrinsic rate (kint) for each residue by the measured rate (kex) for that residue,26,27,50,51 i.e. PF=kint/kex. The PFs presented here are the log10(kint/kex) referred to as log10PF.52,53 Due to rapid exchange, kex values for several residues for wild-type DJ-1 (47 for the monomer) and M26I DJ-1 (85 for the monomer) had to be estimated as described below. For residues that were observed in a T1 HSQC but were not present in the first HDX HSQC, the rate constant for exchange was estimated to be ten times greater than the collection time for the HDX HSQC (e.g., kex=1/1.4 min−1 for an HSQC spectrum obtained after 14 min of HDX); this affected 85 residues for M26I and 44 residues for wild-type DJ-1. A similar estimate was made for the kex of all residues that were present in the first HDX spectrum but then exchanged before a second spectrum could be collected, which affected three residues for wild-type DJ-1. Additionally, six residues in M26I and 12 residues in wild-type DJ-1 did not exchange with D2O over the 60 h experiment and thus their kex could not be determined.
DJ-1 aggregation as a function of temperature
DJ-1 purified using Ni2+-NTA chromatography [referred to as “As Purified” in Fig. 5(A)] has been reported to be more susceptible to aggregation than samples that were not exposed to transition metals.29 Consequently, purified DJ-1 was supplemented with 10 mM EDTA, dialyzed overnight against storage buffer containing 1 mM EDTA, then dialyzed again against storage buffer alone [referred to as “EDTA treated and Removed” in Fig. 5(B)] prior to the experiment. Aggregation of DJ-1 was monitored by measuring the optical density of the sample at 400 nm every 30 min over 60 h with a BioTek Synergy 2 multi-mode microplate reader (BioTek Instruments, Inc., Winooski, VT). Sample temperature was controlled with Gen5 software and data were collected at 30, 35, and 37°C. Wild-type, M26I, M26L, and M26V DJ-1 were diluted to 100 μM in degassed storage buffer and placed in a 96-well plate (Costar 3595). About 50 µL of light mineral oil (Thermo Fisher Scientific, Pittsburgh, PA) was layered over each 180 µL sample to prevent evaporation and the 96-well plate was sealed with optically clear polystyrene seals (VWR International, Radnor, PA). The samples were allowed to equilibrate for 10 min prior to the start of the assay.
Fluorimetry of DJ-1 tryptophan mutants
Human DJ-1 lacks Trp, making it necessary to introduce this residue by site-directed mutagenesis. To identify minimally disruptive locations for the introduction of a Trp residue into DJ-1, sequence alignments of various DJ-1 homologs that contain Trp residues were used. Proteins in this alignment were 40–46% identical to human DJ-1, improving the likelihood that the identified locations for Trp substitution would be structurally well-tolerated. Leu101 and Tyr141 were chosen as candidate sites for mutation that lie within regions of DJ-1 with markedly different responses to the M26I mutation in HDX. Site-directed mutagenesis was used to generate the L101W and Y141W mutations, which were verified by DNA sequencing. Hexahistidine-tagged recombinant proteins were expressed using pET15b in BL21(DE3) E. coli and purified as previously described.16,41 Due to solubility problems, cells expressing M26I/L101W DJ-1 were induced with 0.2 mM isopropyl β-d−1-thiogalactopyranoside (IPTG; Thermo Fisher Scientific) followed by incubation at 20°C overnight with shaking. Additionally, chloramphenicol (Thermo Fisher Scientific) was added to a final concentration of 100 μg/mL 2 h before cells were harvested to enhance the recovery of soluble proteins.54,55
Intrinsic tryptophan fluorescence emission spectra were collected at 37°C using a Cary Eclipse fluorescence spectrophotometer (Varian) with excitation at 280 nm, emission spectra measured from 300 to 400 nm, and excitation and emission slit widths set to 5 nm. A recirculating thermostatic water bath (Varian) was used to control sample temperature. DJ-1 samples were diluted to 500 μM in storage buffer, the cuvette was capped, and the solution was allowed to equilibrate at the measurement temperature for 5 min. After correction for background scattering using a buffer control, the fluorescence spectra of the samples were measured. All fluorescence intensities were normalized to the concentration of protein in the cuvette determined using A280. Extinction coefficients at 280 nm were calculated based on the mutant DJ-1 amino acid sequences using ExPASY.56
Chemical Crosslinking of DJ-1
DSS (Thermo Fisher Scientific) was divided into 2 mg aliquots in a Coy anaerobic chamber (Coy Lab Products, Grass Lake, MI) with plastic spatulas. All plastic material was equilibrated in this environment for at least two weeks prior to use in order to minimize metal or oxygen contamination prior to the experiment, which can reduce DSS crosslinking efficiency. DSS aliquots were then stored in a desiccator at 4°C until ready to use.
Wild-type and M26I DJ-1 were diluted to 100 μM and subsequently dialyzed against storage buffer lacking DTT. Each protein was divided into two 200 μL aliquots, where one aliquot was incubated at room temperature (∼22°C) and the other at 37°C. The samples incubated at their respective temperatures for ∼2 h prior to the initiation of crosslinking by addition of 100 mM DSS dissolved in DMSO to final concentrations of 0, 2, 3, 4, or 5 mM. DMSO alone was added as a negative vehicle control. After 30 min, the reaction was quenched with the addition of Tris-HCl, pH 7.5 to a final concentration of 38 mM and incubated for an additional 15 min. All samples were then mixed with SDS-loading dye, heated to 95°C for 5 min and analyzed using SDS-PAGE with a 12% gel stained with colloidal Coomassie blue dye (Thermo Fisher Scientific).
For the BMOE crosslinking experiments, wild-type, M26I, and M26L DJ-1 were diluted to 100 μM and subsequently dialyzed against PBS pH 7.4 (137 mM NaCl, 2.7 mM KCl, 10 mM Na2HPO4, 1.8 mM KH2PO4, 5 mM EDTA). Each protein was incubated either at room temperature (∼22°C) or at 37°C. At selected time points, a small aliquot of the protein was removed and crosslinked with BMOE (Thermo-Fisher Scientific) at a final crosslinker concentration of 0, 0.1, or 0.5 mM. DMSO was used as a negative vehicle control. After 45 min, crosslinking was quenched with the addition of 20 mM DTT and then incubated for an additional 15 min. Samples were mixed with SDS-loading dye, heated to 95°C for 5 min and analyzed using SDS-PAGE with a 12% gel stained with colloidal Coomassie blue dye (Thermo Fisher Scientific).
Mass spectrometry analysis of thiol crosslinked DJ-1
Coomassie-stained BMOE-crosslinked samples were excised from the gel using a clean razor blade. The samples were digested with trypsin and analyzed using a Waters Synapt G2-S mass spectrometer equipped with a NanoAcquity HPLC system. The tryptic digests were separated on a Waters HSS T3 column (1.8 um particle size 75 μm × 150 mm) with a flow rate of 500 nL/min and a gradient of 5% to 50% acetonitrile in H2O with 0.1% formic acid for 50 min. The mass acquisition range was from 50 to 2000 Da, and spectra were obtained in the mass resolution mode (R=20,000) at a rate of 1/s.
MS/MS experiments were conducted using collisional dissociation with Argon. The data were acquired and processed using Waters MassLynx 4.1 software.
Thermal stability measurement and Far-UV circular dichroism spectroscopy
The melting temperatures (Tm) of DJ-1 proteins were determined using differential scanning fluorimetry (Thermofluor) as previously described.28,57 The secondary structural contents of the proteins were determined using far-UV circular dichroism (CD) spectroscopy following a previously reported protocol28 with minor modifications. Far-UV CD spectra were measured for 13 μM proteins in 10 mM potassium phosphate pH 7.2, 2.5 mM DTT using a Jasco J-815 CD Spectrometer (Jasco, Inc., Easton, MD) and 0.1 cm path length quartz cuvettes. Sample temperature was controlled with a Julabo AWC100 (Julabo USA, Inc., Allentown, PA) recirculating water cooler and maintained at either 25 or 37°C. Protein concentration in the cuvette was determined from the measured absorption at 205 nm using Scopes’ method58 and used to calculate the mean residue molar ellipticity according to the formula below28:
| 5 |
where Θ(λ) is the mean residue molar ellipticity as a function of wavelength (deg cm2 dmol−1 residue−1), θobs(λ) is the measured ellipticity as a function of wavelength (mdeg), n is the number of residues in the protein, c is the concentration of the protein (M), and l is the path length of the cuvette (cm).
Crystal Growth, Data Collection and Processing, and Structure Determination for M26V DJ-1
M26V DJ-1 was crystallized using sitting drop vapor equilibration by mixing 2.4 µL of protein at 1.3 mM (MW= 20,140 g/mol) and 1.8 µL of reservoir solution (100 mM Tris-HCl pH 9.0, 200 mM sodium acetate trihydrate, 25% PEG 4000, and 3 mM DTT. Bipyramidal crystals of M26V DJ-1 in space group P3121 appeared in 2–4 days at room temperature. The crystals were cryoprotected by serial transfer through the reservoir solution supplemented with increasing amounts of ethylene glycol to a final concentration of 25% (vol/vol). The cryoprotected crystals were removed from the cryoprotectant in nylon loops and mounted in the nitrogen cryostream for data collection.
X-ray diffraction data were collected to 1.45 Å resolution from a single crystal at 110 K at the University of Nebraska-Lincoln Macromolecular Structural Core Facility using a MicroMax-007 copper rotating anode source (Rigaku) operating at 40 kV and 20 mA with Osmic Blue confocal optics and a Raxis IV++ detector (Rigaku). In situ annealing59 was performed by blocking the cold nitrogen stream for ∼3 s, which reduces mosaicity and improves data scaling statistics. All data were indexed, scaled, and merged using HKL200060 with final data statistics detailed in Table1. The resolution of the data (1.45 Å) was limited by the geometry of the diffractometer, preventing the collection of strong data at higher resolution. This results in a dataset with an <I>/<σ(I)> of 5 and CC1/2 of 0.966 in the highest resolution bin (Table1), both larger than the preferred values.
Table 1.
Data Collection and Refinement Statistics for M26V DJ-1
| Data collection | |
|---|---|
| Sample | M26V DJ-1 |
| X-ray source | Rotating Cu Anode |
| X-ray wavelength (Å) | 1.54 |
| Space group | P3121 |
| Cell dimensions a, b, c (Å) | 75.04, 75.04, 75.27 |
| α, β, γ (degrees) | 90, 90, 120 |
| Resolution (Å)a | 65–1.45 (1.50–1.45) |
| Rmergeb | 0.062 (0.523) |
| <I>/<σ(I)> | 56.6 (5.0) |
| CC1/2 | 0.999 (0.966) |
| Completeness (%) | 99.7 (97.0) |
| Redundancy | 20.4 (18.2) |
| Refinement | |
| Program | Refmac5 |
| Resolution (Å) | 65–1.45 |
| No. of reflections | 43,711 |
| Rworkc | 0.110 (0.340) |
| Rfreed | 0.132 (0.376) |
| Ralle | 0.111 |
| No. of protein residues | 189 |
| No. of water atoms | 276 |
| No. of heteroatoms (ligand: EDO, ACT) | 20 |
| Beq factors (Å2) | |
| Protein | 18.3 |
| Water | 39.5 |
| Heteroatoms | 30.6 |
| r.m.s. deviations | |
| Bond lengths (Å) | 0.016 |
| Bond angles (degrees) | 1.79 |
| Ramachandran favored, allowed, forbidden (%) | 99.0; 0.5; 0.5 |
Values in parentheses are for the highest resolution shell (1.50–1.45 Å).
Rmerge is calculated according to Eq. (5).
| 6 |
where i is the ith observation of a reflection with index h, k, l, and angle brackets indicate the average over all i observations.
Rwork is calculated according to Eq. (6).
| 7 |
where is the calculated structure factor amplitude with index h, k, l, and
 is the observed structure factor amplitude with index h, k, l.
Rfree is calculated as Rwork, where the values are taken from a test set comprising 5% of the data that were excluded from the refinement.
Rall is calculated as Rwork, where the include all measured data (including the Rfree test set).
Phases for M26V DJ-1 were determined by molecular replacement using the structure of human DJ-1 (PDB: 1P5F, 99% sequence identity47) as a search model in Phaser61 in the CCP4 suite.62 Manual adjustments to the initial model were made by inspection of 2mFO−DFC and mFO−DFC electron density maps in COOT.63 The resulting model was refined in Refmac564 against a maximum likelihood amplitude-based target function with geometric and anisotropic atomic displacement parameter (ADP) restraints and including riding hydrogen atoms. A randomly selected test set comprising 5% of the reflections was used for the calculation of the Rfree65 value. The stereochemical, side chain rotameric, and packing quality of the final model was validated using COOT63 and the MolProbity server.66 All residues except Cys106 were in favored or allowed regions of the Ramachandran plot and Pro66 is a cis-peptide. Cys106 is a legitimate Ramachandran outlier, as is commonly observed in DJ-1 crystal structures. Final data and model statistics are provided in Table1.
Accession numbers
Coordinates and structure factors have been deposited in the Protein Data Bank with accession number 4S0Z
Acknowledgments
Authors thank Drs. Nandakumar Madayiputhiya, Javier Seravalli, and Kevin Van Cott of the Redox Biology Center and University of Nebraska Mass Spectrometry Core Facilities for mass spectrometry analysis, Drs. Martha Morton and Joseph Dumais of the Chemistry Research Instrumentation Facility at UNL for assistance with data collection and suggestions, Bradley Worley for assistance with data processing, and Dr. Jiantao Guo for useful suggestions.
Glossary
- 2D
two-dimensional
- amu
atomic mass unit
- BMOE
bismaleimidoethane
- HDX
Hydrogen/Deuterium Exchange
- LC-MS/MS
liquid chromatography-mass spectrometry/mass spectrometry
- log10PF
log base 10 Protection Factor
- NMR
nuclear magnetic resonance
- NOE
Nuclear Overhauser Effect
- S2
Generalized Order Parameter
- WT
wild-type.
Supporting Information
Additional Supporting Information may be found in the online version of this article.
Supporting Information Table 1.
Supporting Information Table 2.
Supporting Information
References
- Bonifati V, Rizzu P, van Baren MJ, Schaap O, Breedveld GJ, Krieger E, Dekker MC, Squitieri F, Ibanez P, Joosse M, van Dongen JW, Vanacore N, van Swieten JC, Brice A, Meco G, van Duijn CM, Oostra BA, Heutink P. Mutations in the DJ-1 gene associated with autosomal recessive early-onset parkinsonism. Science. 2003;299:256–259. doi: 10.1126/science.1077209. [DOI] [PubMed] [Google Scholar]
- Greenamyre JT, Hastings TG. Biomedicine. Parkinson’s—divergent causes, convergent mechanisms. Science. 2004;304:1120–1122. doi: 10.1126/science.1098966. [DOI] [PubMed] [Google Scholar]
- Waak J, Weber SS, Gorner K, Schall C, Ichijo H, Stehle T, Kahle PJ. Oxidizable residues mediating protein stability and cytoprotective interaction of DJ-1 with apoptosis signal-regulating kinase 1. J Biol Chem. 2009;284:14245–14257. doi: 10.1074/jbc.M806902200. [DOI] [PMC free article] [PubMed] [Google Scholar]
- Jin J, Li GJ, Davis J, Zhu D, Wang Y, Pan C, Zhang J. Identification of novel proteins associated with both alpha-synuclein and DJ-1. Mol Cell Proteomics. 2007;6:845–859. doi: 10.1074/mcp.M600182-MCP200. [DOI] [PubMed] [Google Scholar]
- Clements CM, McNally RS, Conti BJ, Mak TW, Ting JP. DJ-1, a cancer- and Parkinson’s disease-associated protein, stabilizes the antioxidant transcriptional master regulator Nrf2. Proc Natl Acad Sci USA. 2006;103:15091–15096. doi: 10.1073/pnas.0607260103. [DOI] [PMC free article] [PubMed] [Google Scholar]
- Zhou W, Freed CR. DJ-1 up-regulates glutathione synthesis during oxidative stress and inhibits A53T alpha-synuclein toxicity. J Biol Chem. 2005;280:43150–43158. doi: 10.1074/jbc.M507124200. [DOI] [PubMed] [Google Scholar]
- Kim RH, Peters M, Jang Y, Shi W, Pintilie M, Fletcher GC, DeLuca C, Liepa J, Zhou L, Snow B, Binari RC, Manoukian AS, Bray MR, Liu FF, Tsao MS, Mak TW. DJ-1, a novel regulator of the tumor suppressor PTEN. Cancer Cell. 2005;7:263–273. doi: 10.1016/j.ccr.2005.02.010. [DOI] [PubMed] [Google Scholar]
- Tang B, Xiong H, Sun P, Zhang Y, Wang D, Hu Z, Zhu Z, Ma H, Pan Q, Xia JH, Xia K, Zhang Z. Association of PINK1 and DJ-1 confers digenic inheritance of early-onset Parkinson’s disease. Hum Mol Genet. 2006;15:1816–1825. doi: 10.1093/hmg/ddl104. [DOI] [PubMed] [Google Scholar]
- Canet-Aviles RM, Wilson MA, Miller DW, Ahmad R, McLendon C, Bandyopadhyay S, Baptista MJ, Ringe D, Petsko GA, Cookson MR. The Parkinson’s disease protein DJ-1 is neuroprotective due to cysteine-sulfinic acid-driven mitochondrial localization. Proc Natl Acad Sci USA. 2004;101:9103–9108. doi: 10.1073/pnas.0402959101. [DOI] [PMC free article] [PubMed] [Google Scholar]
- Choi J, Sullards MC, Olzmann JA, Rees HD, Weintraub ST, Bostwick DE, Gearing M, Levey AI, Chin LS, Li L. Oxidative damage of DJ-1 is linked to sporadic Parkinson and Alzheimer diseases. J Biol Chem. 2006;281:10816–10824. doi: 10.1074/jbc.M509079200. [DOI] [PMC free article] [PubMed] [Google Scholar]
- Meulener MC, Xu K, Thomson L, Ischiropoulos H, Bonini NM. Mutational analysis of DJ-1 in Drosophila implicates functional inactivation by oxidative damage and aging. Proc Natl Acad Sci USA. 2006;103:12517–12522. doi: 10.1073/pnas.0601891103. [DOI] [PMC free article] [PubMed] [Google Scholar]
- Mitsumoto A, Nakagawa Y. DJ-1 is an indicator for endogenous reactive oxygen species elicited by endotoxin. Free Radic Res. 2001;35:885–893. doi: 10.1080/10715760100301381. [DOI] [PubMed] [Google Scholar]
- Blackinton J, Lakshminarasimhan M, Thomas KJ, Ahmad R, Greggio E, Raza AS, Cookson MR, Wilson MA. Formation of a stabilized cysteine sulfinic acid is critical for the mitochondrial function of the parkinsonism protein DJ-1. J Biol Chem. 2009;284:6476–6485. doi: 10.1074/jbc.M806599200. [DOI] [PMC free article] [PubMed] [Google Scholar]
- Aleyasin H, Rousseaux MW, Phillips M, Kim RH, Bland RJ, Callaghan S, Slack RS, During MJ, Mak TW, Park DS. The Parkinson’s disease gene DJ-1 is also a key regulator of stroke-induced damage. Proc Natl Acad Sci USA. 2007;104:18748–18753. doi: 10.1073/pnas.0709379104. [DOI] [PMC free article] [PubMed] [Google Scholar]
- Xu J, Zhong N, Wang H, Elias JE, Kim CY, Woldman I, Pifl C, Gygi SP, Geula C, Yankner BA. The Parkinson’s disease-associated DJ-1 protein is a transcriptional co-activator that protects against neuronal apoptosis. Hum Mol Genet. 2005;14:1231–1241. doi: 10.1093/hmg/ddi134. [DOI] [PubMed] [Google Scholar]
- Lakshminarasimhan M, Maldonado MT, Zhou W, Fink AL, Wilson MA. Structural impact of three Parkinsonism-associated missense mutations on human DJ-1. Biochemistry. 2008;47:1381–1392. doi: 10.1021/bi701189c. [DOI] [PMC free article] [PubMed] [Google Scholar]
- Malgieri G, Eliezer D. Structural effects of Parkinson’s disease linked DJ-1 mutations. Protein Sci. 2008;17:855–868. doi: 10.1110/ps.073411608. [DOI] [PMC free article] [PubMed] [Google Scholar]
- Gorner K, Holtorf E, Odoy S, Nuscher B, Yamamoto A, Regula JT, Beyer K, Haass C, Kahle PJ. Differential effects of Parkinson’s disease-associated mutations on stability and folding of DJ-1. J Biol Chem. 2004;279:6943–6951. doi: 10.1074/jbc.M309204200. [DOI] [PubMed] [Google Scholar]
- Hulleman JD, Mirzaei H, Guigard E, Taylor KL, Ray SS, Kay CM, Regnier FE, Rochet JC. Destabilization of DJ-1 by familial substitution and oxidative modifications: implications for Parkinson’s disease. Biochemistry. 2007;46:5776–5789. doi: 10.1021/bi7001778. [DOI] [PubMed] [Google Scholar]
- Blackinton J, Ahmad R, Miller DW, van der Brug MP, Canet-Aviles RM, Hague SM, Kaleem M, Cookson MR. Effects of DJ-1 mutations and polymorphisms on protein stability and subcellular localization. Brain Res Mol Brain Res. 2005;134:76–83. doi: 10.1016/j.molbrainres.2004.09.004. [DOI] [PubMed] [Google Scholar]
- Abou-Sleiman PM, Healy DG, Quinn N, Lees AJ, Wood NW. The role of pathogenic DJ-1 mutations in Parkinson’s disease. Ann Neurol. 2003;54:283–286. doi: 10.1002/ana.10675. [DOI] [PubMed] [Google Scholar]
- Madian AG, Hindupur J, Hulleman JD, Diaz-Maldonado N, Mishra VR, Guigard E, Kay CM, Rochet JC, Regnier FE. Effect of single amino acid substitution on oxidative modifications of the Parkinson’s disease-related protein, DJ-1. Mol Cell Proteomics. 2012;11 doi: 10.1074/mcp.M111.010892. [DOI] [PMC free article] [PubMed] [Google Scholar]
- Repici M, Straatman KR, Balduccio N, Enguita FJ, Outeiro TF, Giorgini F. Parkinson’s disease-associated mutations in DJ-1 modulate its dimerization in living cells. J Mol Med. 2013;91:599–611. doi: 10.1007/s00109-012-0976-y. [DOI] [PMC free article] [PubMed] [Google Scholar]
- Ishima R, Torchia DA. Protein dynamics from NMR. Nature Struct Biol. 2000;7:740–743. doi: 10.1038/78963. [DOI] [PubMed] [Google Scholar]
- Cole R, Loria JP. FAST-Modelfree: a program for rapid automated analysis of solution NMR spin-relaxation data. J Biomol NMR. 2003;26:203–213. doi: 10.1023/a:1023808801134. [DOI] [PubMed] [Google Scholar]
- Bai Y, Milne JS, Mayne L, Englander SW. Primary structure effects on peptide group hydrogen exchange. Proteins. 1993;17:75–86. doi: 10.1002/prot.340170110. [DOI] [PMC free article] [PubMed] [Google Scholar]
- Connelly GP, Bai Y, Jeng MF, Englander SW. Isotope effects in peptide group hydrogen exchange. Proteins. 1993;17:87–92. doi: 10.1002/prot.340170111. [DOI] [PubMed] [Google Scholar]
- Prahlad J, Hauser DN, Milkovic NM, Cookson MR, Wilson MA. Use of cysteine-reactive cross-linkers to probe conformational flexibility of human DJ-1 demonstrates that Glu18 mutations are dimers. J Neurochem. 2014;130:839–853. doi: 10.1111/jnc.12763. [DOI] [PMC free article] [PubMed] [Google Scholar]
- Hulleman JD. 2007. Regulation of DJ-1 structure and function: implications for Parkinson’s Disease. Ph.D. Thesis, Medicinal Chemistry and Molecular Pharmacology, Purdue University, West Lafayette.
- Fenn TD, Ringe D, Petsko GA. POVScript+: a program for model and data visualization using persistence of vision ray-tracing. J Appl Cryst. 2003;36:944–947. [Google Scholar]
- Schneider CA, Rasband WS, Eliceiri KW. NIH Image to ImageJ: 25 years of image analysis. Nat Methods. 2012;9:671–675. doi: 10.1038/nmeth.2089. [DOI] [PMC free article] [PubMed] [Google Scholar]
- Logan T, Clark L, Ray SS. Engineered disulfide bonds restore chaperone-like function of DJ-1 mutants linked to familial Parkinson’s disease. Biochemistry. 2010;49:5624–5633. doi: 10.1021/bi902164h. [DOI] [PMC free article] [PubMed] [Google Scholar]
- Lin J, Prahlad J, Wilson MA. Conservation of oxidative protein stabilization in an insect homologue of parkinsonism-associated protein DJ-1. Biochemistry. 2012;51:3799–3807. doi: 10.1021/bi3003296. [DOI] [PMC free article] [PubMed] [Google Scholar]
- Dexter DT, Carayon A, Javoy-Agid F, Agid Y, Wells FR, Daniel SE, Lees AJ, Jenner P, Marsden CD. Alterations in the levels of iron, ferritin and other trace metals in Parkinson’s disease and other neurodegenerative diseases affecting the basal ganglia. Brain. 1991;114:1953–1975. doi: 10.1093/brain/114.4.1953. [DOI] [PubMed] [Google Scholar]
- Kanelis V, Hudson RP, Thibodeau PH, Thomas PJ, Forman-Kay JD. NMR evidence for differential phosphorylation-dependent interactions in WT and DeltaF508 CFTR. EMBO J. 2010;29:263–277. doi: 10.1038/emboj.2009.329. [DOI] [PMC free article] [PubMed] [Google Scholar]
- Lewis HA, Wang C, Zhao X, Hamuro Y, Conners K, Kearins MC, Lu F, Sauder JM, Molnar KS, Coales SJ, Maloney PC, Guggino WB, Wetmore DR, Weber PC, Hunt JF. Structure and dynamics of NBD1 from CFTR characterized using crystallography and hydrogen/deuterium exchange mass spectrometry. J Mol Biol. 2010;396:406–430. doi: 10.1016/j.jmb.2009.11.051. [DOI] [PubMed] [Google Scholar]
- Museth AK, Brorsson AC, Lundqvist M, Tibell LA, Jonsson BH. The ALS-associated mutation G93A in human copper-zinc superoxide dismutase selectively destabilizes the remote metal binding region. Biochemistry. 2009;48:8817–8829. doi: 10.1021/bi900703v. [DOI] [PubMed] [Google Scholar]
- Hennig J, Andresen C, Museth AK, Lundstrom P, Tibell LAE, Jonsson BH. Local destabilization of the metal-binding region in human copper-zinc superoxide dismutase by remote mutations is a possible determinant for progression of ALS. Biochemistry. 2014;54:323–333. doi: 10.1021/bi500606j. [DOI] [PubMed] [Google Scholar]
- Pratt AJ, Shin DS, Merz GE, Rambo RP, Lancaster WA, Dyer KN, Borbat PP, Poole FL, 2nd Adams MW, Freed JH, Crane BR, Tainer JA. Getzoff ED. Aggregation propensities of superoxide dismutase G93 hotspot mutants mirror ALS clinical phenotypes. Proc Natl Acad Sci USA. 2014;111:E4568–E4576. doi: 10.1073/pnas.1308531111. [DOI] [PMC free article] [PubMed] [Google Scholar]
- Fraser JS, Clarkson MW, Degnan SC, Erion R, Kern D, Alber T. Hidden alternative structures of proline isomerase essential for catalysis. Nature. 2009;462:669–673. doi: 10.1038/nature08615. [DOI] [PMC free article] [PubMed] [Google Scholar]
- Lakshminarasimhan M, Madzelan P, Nan R, Milkovic NM, Wilson MA. Evolution of new enzymatic function by structural modulation of cysteine reactivity in Pseudomonas fluorescens isocyanide hydratase. J Biol Chem. 2010;285:29651–29661. doi: 10.1074/jbc.M110.147934. [DOI] [PMC free article] [PubMed] [Google Scholar]
- Glasoe PK, Long FA. Use of glass electrodes to measure acidities in deuterium oxide. J Phys Chem. 1960;64:188–190. [Google Scholar]
- Delaglio F, Grzesiek S, Vuister GW, Zhu G, Pfeifer J, Bax A. NMRPipe: a multidimensional spectral processing system based on UNIX pipes. J Biomol NMR. 1995;6:277–293. doi: 10.1007/BF00197809. [DOI] [PubMed] [Google Scholar]
- Johnson B, Blevins R. NMRView: a computer program for the visualization and analysis of NMR data. J Biomol NMR. 1994;4:603–614. doi: 10.1007/BF00404272. [DOI] [PubMed] [Google Scholar]
- Mandel AM, Akke M, Palmer AG., 3rd Backbone dynamics of Escherichia coli ribonuclease HI: correlations with structure and function in an active enzyme. J Mol Biol. 1995;246:144–163. doi: 10.1006/jmbi.1994.0073. [DOI] [PubMed] [Google Scholar]
- Palmer A, Rance M, PE W. Intramolecular motions of a zinc finger DNA-binding domain from Xfin characterized by proton-detected natural abundance carbon-13 heteronuclear NMR spectroscopy. J Am Chem Soc. 1991;113:4371–4380. [Google Scholar]
- Wilson MA, Collins JL, Hod Y, Ringe D, Petsko GA. The 1.1 Å resolution crystal structure of DJ-1, the protein mutated in autosomal recessive early onset Parkinson’s disease. Proc Natl Acad Sci USA. 2003;100:9256–9261. doi: 10.1073/pnas.1133288100. [DOI] [PMC free article] [PubMed] [Google Scholar]
- Tjandra N, Feller SE, Pastor RW, Bax A. Rotational diffusion anisotropy of human ubiquitin from 15N NMR relaxation. J Am Chem Soc. 1995;117:12562–12566. [Google Scholar]
- Schanda P, Kupce E, Brutscher B. SOFAST-HMQC experiments for recording two-dimensional heteronuclear correlation spectra of proteins within a few seconds. J Biomol NMR. 2005;33:199–211. doi: 10.1007/s10858-005-4425-x. [DOI] [PubMed] [Google Scholar]
- Andersson FI, Werrell EF, McMorran L, Crone WJ, Das C, Hsu ST, Jackson SE. The effect of Parkinson’s-disease-associated mutations on the deubiquitinating enzyme UCH-L1. J Mol Biol. 2011;407:261–272. doi: 10.1016/j.jmb.2010.12.029. [DOI] [PubMed] [Google Scholar]
- Mori S, van Zijl PC, Shortle D. Measurement of water-amide proton exchange rates in the denatured state of staphylococcal nuclease by a magnetization transfer technique. Proteins. 1997;28:325–332. [PubMed] [Google Scholar]
- Skinner JJ, Lim WK, Bedard S, Black BE, Englander SW. Protein hydrogen exchange: testing current models. Protein Sci. 2012;21:987–995. doi: 10.1002/pro.2082. [DOI] [PMC free article] [PubMed] [Google Scholar]
- JJ Skinner, WK Lim, S Bedard, BE Black, SW Englander. Protein dynamics viewed by hydrogen exchange. Protein Sci. 2012;21:996–1005. doi: 10.1002/pro.2081. [DOI] [PMC free article] [PubMed] [Google Scholar]
- Carrio MM, Villaverde A. Protein aggregation as bacterial inclusion bodies is reversible. FEBS Lett. 2001;489:29–33. doi: 10.1016/s0014-5793(01)02073-7. [DOI] [PubMed] [Google Scholar]
- Carrio MM, Villaverde A. Construction and deconstruction of bacterial inclusion bodies. J Biotechnol. 2002;96:3–12. doi: 10.1016/s0168-1656(02)00032-9. [DOI] [PubMed] [Google Scholar]
- Artimo P, Jonnalagedda M, Arnold K, Baratin D, Csardi G, de Castro E, Duvaud S, Flegel V, Fortier A, Gasteiger E, Grosdidier A, Hernandez C, Ioannidis V, Kuznetsov D, Liechti R, Moretti S, Mostaguir K, Redaschi N, Rossier G, Xenarios I, Stockinger H. ExPASy: SIB bioinformatics resource portal. Nucleic Acids Res. 2012;40:W597–W603. doi: 10.1093/nar/gks400. [DOI] [PMC free article] [PubMed] [Google Scholar]
- Pantoliano MW, Petrella EC, Kwasnoski JD, Lobanov VS, Myslik J, Graf E, Carver T, Asel E, Springer BA, Lane P, Salemme FR. High-density miniaturized thermal shift assays as a general strategy for drug discovery. J Biomol Screen. 2001;6:429–440. doi: 10.1177/108705710100600609. [DOI] [PubMed] [Google Scholar]
- Scopes RK. Measurement of protein by spectrophotometry at 205 nm. Anal Biochem. 1974;59:277–282. doi: 10.1016/0003-2697(74)90034-7. [DOI] [PubMed] [Google Scholar]
- Yeh JI, Hol WG. A flash-annealing technique to improve diffraction limits and lower mosaicity in crystals of glycerol kinase. Acta Cryst. 1998;D54:479–480. doi: 10.1107/s0907444998004697. [DOI] [PubMed] [Google Scholar]
- Otwinowski Z, Minor W. Processing of X-ray diffraction data collected in oscillation mode. Methods Enzymol. 1997;276:307–326. doi: 10.1016/S0076-6879(97)76066-X. [DOI] [PubMed] [Google Scholar]
- McCoy AJ, Grosse-Kunstleve RW, Adams PD, Winn MD, Storoni LC, Read RJ. Phaser crystallographic software. J Appl Cryst. 2007;40:658–674. doi: 10.1107/S0021889807021206. [DOI] [PMC free article] [PubMed] [Google Scholar]
- Collaborative Computational Project No. 4. The CCP4 suite: programs for protein crystallography. Acta Cryst D. 1994;50:760–763. doi: 10.1107/S0907444994003112. [DOI] [PubMed] [Google Scholar]
- Emsley P, Cowtan K. Coot: model-building tools for molecular graphics. Acta Cryst D. 2004;60:2126–2132. doi: 10.1107/S0907444904019158. [DOI] [PubMed] [Google Scholar]
- Murshudov GN, Vagin AA, Dodson EJ. Refinement of macromolecular structures by the maximum-likelihood method. Acta Cryst D. 1997;53:240–255. doi: 10.1107/S0907444996012255. [DOI] [PubMed] [Google Scholar]
- Brunger AT. Free R value: a novel statistical quantity for assessing the accuracy of crystal structures. Nature. 1992;355:472–475. doi: 10.1038/355472a0. [DOI] [PubMed] [Google Scholar]
- Davis IW, Leaver-Fay A, Chen VB, Block JN, Kapral GJ, Wang X, Murray LW, Arendall WB, III, Snoeyink J, Richardson JS. Richardson DC. MolProbity: all-atom contacts and structure validation for proteins and nucleic acids. Nucleic Acids Res. 2007;35:W375–W383. doi: 10.1093/nar/gkm216. [DOI] [PMC free article] [PubMed] [Google Scholar]
- G Lipari, A Szabo. Model-free approach to the interpretation of nuclear magnetic-resonance relaxation in macromolecules I. Theory and range of validity. J Am Chem Soc. 1982;104:4546–4559. [Google Scholar]
Associated Data
This section collects any data citations, data availability statements, or supplementary materials included in this article.
Supplementary Materials
Supporting Information Table 1.
Supporting Information Table 2.
Supporting Information