

Abstract
Aims
Angiotensin receptor blockers (ARBs) are renoprotective and targeted to blood pressure. However, ARBs have multiple other (off-target) effects which may affect renal outcome. It is unknown whether on-target and off-target effects are congruent within individuals. If not, this variation in short term effects may have important implications for the prediction of individual long term renal outcomes. Our aim was to assess intra-individual variability in multiple parameters in response to ARBs in type 2 diabetes.
Methods
Changes in systolic blood pressure (SBP), albuminuria, potassium, haemoglobin, cholesterol and uric acid after 6 months of losartan treatment were assessed in the RENAAL database. Improvement in predictive performance of renal outcomes (ESRD or doubling serum creatinine) for each individual using ARB-induced changes in all risk markers was assessed by the relative integrative discrimination index (RIDI).
Results
SBP response showed high variability (mean –5.7 mmHg, 5th to 95th percentile –36.5 to +24.0 mmHg) between individuals. Changes in off-target parameters also showed high variability between individuals. No congruency was observed between responses to losartan in multiple parameters within individuals. Using individual responses in all risk markers significantly improved renal risk prediction (RIDI 30.4%, P < 0.01) compared with using only SBP changes. Results were successfully replicated in two independent trials with irbesartan, IDNT and IRMA-2.
Conclusions
In this post hoc analysis we showed that ARBs have multiple off-target effects which vary between and within individuals. Combining all ARB-induced responses beyond SBP provides a more accurate prediction of who will benefit from ARB therapy. Prospective trials are required to validate these findings.
Keywords: angiotensin receptor blockers, personalized medicine, renal disease, type 2 diabetes
What is Already Known about this Subject
Renin angiotensin aldosterone system intervention is targeted towards blood pressure and confers renoprotection in patients with type 2 diabetes.
There is a large individual variability in blood pressure response to RAAS intervention.
RAAS intervention not only influences blood pressure, but also other renal risk markers.
What this Study Adds
This study shows that the response in multiple risk markers to RAAS intervention (ARB therapy) shows a large variability between and within individual patients.
Taking all ARB-induced responses beyond blood pressure into account provides a more accurate prediction of who will benefit from ARB therapy.
Introduction
Intervention in the renin-angiotensin-aldosterone system (RAAS) is a mainstay of renoprotective therapy in diabetic (and non-diabetic) renal disease 1–3. Although intervention in the RAAS affords renoprotection on a group level, large individual variability in renoprotective effects exists which is mirrored by large individual variability in response in blood pressure, the primary target of angiotensin receptor blockers (ARBs). The response in blood pressure serves as a proxy or surrogate for the long term effect on cardiovascular and renal outcomes. However, blood pressure is not the only risk marker that is influenced by intervention in the RAAS. Intervention in the RAAS has a broad spectrum of effects on other renal risk markers including decreasing albuminuria, haemoglobin, uric acid, cholesterol and increasing potassium 4–8. Changes in these renal risk markers have implications for patients’ clinical prognosis. Accordingly, intervention in the RAAS-induced changes in all these risk markers could influence the ultimate effect of RAAS blockade on renal outcomes, either positively or negatively.
It has been assumed that the between-patient variability in blood pressure in response to RAAS blockade is paralleled by a similar between-patient variability in other risk markers. If true, measuring multiple risk markers within an individual would not be meaningful as the blood pressure response represents the variability in response to other markers as well. However, several studies show that in a proportion of patients a reduction in blood pressure is not accompanied by a reduction in albuminuria or vice versa 9–11. It is unknown, however, whether the response to ARBs in multiple risk markers are paralleled or dissociated from the antihypertensive response within a patient, and whether this explains the inaccuracy of predicting long term renal protection by just looking at the target parameter blood pressure.
We questioned whether a composite of multiple short term risk marker changes, including on-target and off-target changes, would lead to a more accurate prediction of long term renal protection. We thus investigated the variability in response to multiple risk markers within an individual and assessed the congruency in response to multiple risk markers within an individual. Secondly, we examined whether inclusion of changes in multiple risk markers of each individual improves prediction of renal outcome. Data of already finished large ARB intervention trials in type 2 diabetic patients with elevated albuminuria (RENAAL, IDNT and IRMA-2) were used for this analysis.
Methods
Data sources and patient population
We used the individual patient data from the RENAAL, IDNT and IRMA-2 trials. The detailed design, rationale and study outcome for these trials have been previously published 12–14. All trials investigated the efficacy of an ARB (losartan in RENAAL and irbesartan in IDNT and IRMA-2) on renal outcomes in subjects with type 2 diabetes and nephropathy. Inclusion criteria for the RENAAL and IDNT trials were similar aside from a few minor differences. Patients with type 2 diabetes, hypertension and age between 30–70 years were eligible for these trials. In RENAAL and IDNT, serum creatinine concentrations ranged between 1.0 mg dl–1 and 3.0 mg dl–1 and all subjects had proteinuria, defined as 24 h urinary protein excretion of >900 mg in the IDNT trial whereas for RENAAL a urinary albumin: creatinine ratio (UACR) of >300 mg g–1 or a 24 h urinary protein excretion >500mg day–1 was required. In the IRMA-2 trial, eligible patients had type 2 diabetes and microalbuminuria, defined as urinary albumin excretion between 20 and 200 µg min–1 and serum creatinine no more than 1.5 mg dl–1 in males or 1.1 mg dl–1 in females. Exclusion criteria for all three trials were type 1 diabetes or non-diabetic renal disease.
Patients randomized to active study treatment received losartan 100 mg day–1 in RENAAL, irbesartan 300 mg day–1 in IDNT and irbesartan 150 mg day–1 or 300 mg day–1 in IRMA-2 to achieve a blood pressure target of at least 135/85 mmHg. If the blood pressure target was not achieved the dose of other antihypertensive drugs was increased or additional antihypertensive agents (but not those that intervene in the RAAS) were added to achieve the target blood pressure.
The primary endpoint in RENAAL and IDNT used for this analysis was the time to a sustained doubling of baseline serum creatinine or end stage renal disease. In IDNT, a sustained serum creatinine ≥ 6.0 mg dl–1 was used as an additional component in the primary endpoint. All outcomes were adjudicated by an independent blinded endpoint committee using rigorous outcome definitions. Clinical renal endpoints were not recorded in the IRMA-2 trial. All patients signed informed consent before enrolment, and the local Institutional Review Board of each participating centre approved the RENAAL, IDNT and IRMA-2 trials.
Responses in risk markers
This post hoc analysis focuses on the response to multiple markers including systolic blood pressure (SBP), albuminuria, serum potassium, haemoglobin, total cholesterol and uric acid. These markers were selected since prior studies have shown that intervention in the RAAS can affect these risk marker levels when compared with placebo 4–8. Uric acid was not included in the analysis for the IDNT and IRMA-2 trials, as it was previously shown that irbesartan does not affect this risk marker 15. All blood pressure measurements in all trials were taken after a period of at least 5 min in sitting position. Three consecutive blood pressure measurements were recorded in the same arm. The mean value of the three systolic and diastolic blood pressure readings was calculated for each study visit. In a subset of patients in the IRMA-2 trial, 24 h ambulatory blood pressure monitoring was also performed. Other risk markers (albuminuria, potassium, haemoglobin, cholesterol, uric acid) were measured in a central laboratory in each trial. Albuminuria was measured in first morning void urine collections in RENAAL and IRMA-2 for measurement of the albumin to creatinine ratio. In IDNT, 24 h urine collections were performed for measurement of the albumin: creatinine ratio. Throughout this manuscript albumin: creatinine ratio is designated as albuminuria.
Response to each parameter was defined as the change between the month 6 and baseline value. Responders were defined as patients with a risk marker change in the hypothesized direction. Hence, a 6 month decrease was used to define responders for SBP, albuminuria, haemoglobin, total cholesterol and uric acid and a 6 month increase was used to define serum potassium responders. Albuminuria response at month 6 for each patient was calculated as (1 – log ratio of month 6 to baseline albuminuria) multiplied by 100%. On the basis of previous analyses, the month 6 value was chosen because most parameters were measured at month 6, the treatment effects were considered fully present and few events occurred during the first 6 months 12,13.
Integration of responses in multiple risk markers
The effect on all risk markers was combined to calculate an integrated risk marker effect of ARB treatment. To this end, we used a previously described and validated algorithm referred to as the multiple parameter risk efficacy (PRE) score 15,16. In short, a multivariable Cox proportional hazards model was used to estimate the coefficients and hazard ratios associated with each risk marker for the first recorded renal event. The regression coefficients for each risk marker were then taken and used as weights for the risk algorithm. The risk algorithm was applied to the risk markers observed in the RENAAL and IDNT trial at baseline and month 6 in order to calculate 3 year renal risk at both time points. The percentage difference in risk between the two time points represents the individual PRE score 15,17.
Statistical analysis
Changes in risk marker levels between baseline and month 6 were reported as mean with 5th to 95th percentile. Variables that were non-normally distributed were log-transformed and reported as geometric mean change. Treatment response was calculated by subtracting month 6 measurements from baseline values. Patients with a reduction at month 6 from baseline in either SBP, albuminuria, haemoglobin, cholesterol, uric acid or increase in potassium were classified as responders for the respective risk marker. For each risk marker we created a responder population. This resulted in six responder populations. Radar plots were subsequently constructed to determine whether responses in one of the six markers were congruent with responses in other markers. The mean response in all risk markers in the overall population was plotted in each radar plot together with the responses in the responder population. We created radar plots for each of the six responder populations. The number of responders in each risk marker were counted and compared by the Chi square test with a post hoc Bonferroni correction for multiple testing. Correlations between risk markers in individual patients were calculated with Pearson correlations. Mean response for risk marker changes in each responder group were compared with the mean response in the total population by t-test or Wilcoxon signed rank test with a post hoc Bonferroni correction for multiple testing, where appropriate.
We subsequently assessed whether changes in single risk markers or multiple risk markers improved renal risk prediction. These analyses were conducted in the RENAAL and IDNT trials since in the IRMA-2 trial no clinical endpoints were recorded. We used responses in SBP, albuminuria and individual PRE scores, that represent the integration of 6 month responses in multiple risk markers, in Cox regression analysis. Cox models were adjusted for baseline values of age, gender, eGFR, albuminuria and haemoglobin to take into account differences between patients in renal risk at baseline. We adjusted for these risk markers as they were previously shown to predict independently renal risk 18. The improvement in predictive performance was assessed by C statistic and relative integrated discrimination improvement (RIDI). The RIDI measures the percentage of increased discrimination when comparing prediction models 19. A P value of <0.05 was selected as statistically significant. Statistical analysis was conducted with R version 3.0.1 (R Foundation for Statistical Computing, Vienna, Austria).
Results
Baseline characteristics
A total of 531 (71%) of patients assigned to ARB treatment had complete risk marker measurements at baseline and month 6. Baseline characteristics of these patients are presented in Table1. The included population did not differ from the overall losartan assigned population (Supplementary Table S1).
Table 1.
Baseline characteristics of the included patients. In mean (SD) unless otherwise indicated. ACR is calculated as median + interquartile range. Baseline measurements for uric acid were not available in the IRMA-2 trial
| RENAAL (n = 531) | IDNT (n = 376) | IRMA-2 (n = 255) | |
|---|---|---|---|
| Age (years) | 60.0 (7.1) | 59.1 (7.1) | 57.9 (7.9) |
| Males, n (%) | 328 (62) | 250 (66) | 171 (67) |
| Weight (kg) | 82.4 (21.2) | 88.8 (18.1) | 85.2 (14.5) |
| Race, n (%) | |||
| White | 241 (45) | 284 (76) | 253 (99) |
| Black | 87 (16) | 45 (12) | 0 (0) |
| Hispanic | 102 (19) | 17 (4) | 0 (0) |
| Asian | 97 (18) | 12 (3) | 0 (0) |
| Other | 4 (1) | 18 (5) | 2 (1) |
| SBP (mmHg) | 151.5 (18.7) | 159.0 (19.0) | 153.6 (14.0) |
| ACR (mg g–1) | 1155 (535–2500) | 1420 (802–2773) | 55 (34–96) |
| K (mEq l–1) | 4.59 (0.48) | 4.65 (0.53) | 4.75 (0.52) |
| Hb (g dl–1) | 12.6 (1.8) | 13.0 (2.0) | 14.4 (1.2) |
| Cholesterol (mg dl–1) | 224.9 (54.4) | 225.8 (51.4) | 224.2 (50.0) |
| Uric acid (mg dl–1) | 6.73 (1.76) | 6.78 (1.81) | NA |
| HbA1c (%/mmol/mol) | 8.44 (1.56) | 7.97 (1.67) | 7.18 (1.73) |
| eGFR (ml min–1 1.73 m–2) | 40.0 (11.8) | 47.4 (16.7) | 72.3 (14.3) |
SBP, systolic blood pressure; ACR, albumin: creatinine ratio (albuminuria); K, serum potassium; Hb, hemoglobin
Between-patient variability in response to losartan
A large variability in responses between individuals in systolic blood pressure (mean [5th to 95th percentile]: –5.7 mmHg [–36.5 to +24.0]), albuminuria (–31% [–78 to +121]), serum potassium (0.22 mEq l–1 [–0.55 to +1.00]), haemoglobin, (–0.6g dl–1 [–2.5 to +1.35]), total cholesterol (–10.1 mg dl–1 [–89.5 to +59.0]) and uric acid (0.02 mg dl–1 [–2.05 to +2.10]) was observed (Figure1).
Figure 1.
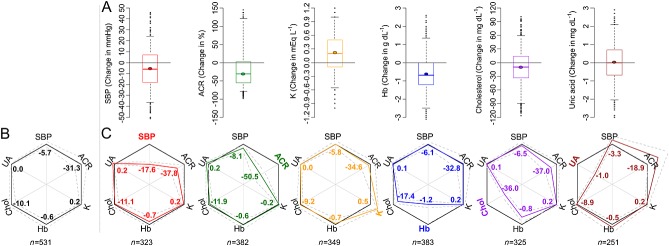
Discordance between ARB-induced responses in multiple parameters within individual patients. A) Overview of the variation in risk marker response in the total population (inter-individual variability). The thick short line in the boxplots indicates the median and the dot the mean change. Box and whiskers represent interquartile range and 5th to 95th percentile, respectively. B) Radar plot showing the overall response (bold black outer line with numbers indicating mean values) for each risk marker in RENAAL. Dashed grey lines indicate 95% confidence interval. C) Radar plots showing discordance of the different responses within individuals. For example, the red lines and numbers indicate the risk marker responses in blood pressure responders. The black outer line represents the response in the overall population as explained in B. The overlap between each of the responder populations (colored line) vs. the overall population (black line) indicates that responses within an individual are discordant. N underneath radar plots indicate number of responders in each figure. SBP, systolic blood pressure; ACR, albuminuria; K, potassium; Hb, haemoglobin; chol, cholesterol; UA, uric acid
Within-patient variability in multiple markers in response to losartan
To determine whether responses in systolic blood pressure were paralleled by responses in other risk markers within an individual we assessed responses in all risk markers in the overall population and subsequently in subjects with a reduction in systolic blood pressure. The radar plot in Figure1 shows that the magnitude of responses in all risk markers was similar in the overall population and in the subgroup of patients with a reduction in systolic blood pressure, suggesting that responses are discordant. When responder populations were defined by responses in off-target parameters, the magnitude of responses in the remaining parameters were similar to the overall population (Figure1), except for the albuminuria response in uric acid responders.
The number and proportion of patients with a response to losartan in each risk marker are shown in Table2. In the overall population a response in SBP was observed in 61% of subjects, albuminuria in 72%, potassium in 66%, haemoglobin in 72%, cholesterol in 61% and uric acid in 47%. These percentages were not statistically different in sub-group populations defined by a response in SBP or other off-target biomarkers (Table2).
Table 2.
Proportion of patients with response in overall population and various ‘responder’ populations
| Response in | Total population (n = 531) | SBP responders (n = 323) | ACR responders (n = 382) | K responders (n = 349) | Hb responders (n = 383) | Cholesterol responders (n = 325) | Uric acid responders (n = 251) |
|---|---|---|---|---|---|---|---|
| SBP | 323 (61) | 323 (100) | 256 (67) | 208 (60) | 237 (61.9) | 202 (62) | 134 (53) |
| ACR | 382 (72) | 256 (79) | 382 (100) | 262 (75) | 280 (73.1) | 241 (74) | 157 (63) |
| K | 349 (66) | 208 (64) | 262 (69) | 349 (100) | 255 (67) | 217 (67) | 159 (63) |
| Hb | 383 (72) | 237 (73) | 280 (73) | 255 (73) | 383 (100) | 259 (80) | 176 (70) |
| Cholesterol | 325 (61) | 202 (63) | 241 (63) | 217 (62) | 259 (68) | 325 (100) | 150 (60) |
| Uric acid | 251 (47) | 134 (42) | 157 (41) | 159 (46) | 176 (46) | 150 (46) | 251 (100) |
Number of patients (%) with a response to each risk marker. Results are displayed for the total population, and for subsets of responders per risk marker. Chi square tests with a post hoc Bonferroni correction revealed no statistically significant differences.
The correlation between responses in individual risk markers within an individual is shown in Table3. There was no correlation between responses in different parameters within an individual with the highest correlation observed between haemoglobin and cholesterol (r = 0.30).
Table 3.
Pearson correlation coefficients between responses to individual risk markers in individual patients
| SBP | ACR | K | Hb | Cholesterol | Uric acid | |
|---|---|---|---|---|---|---|
| SBP | 1 | 0.12 | –0.02 | 0.07 | 0.02 | –0.17 |
| ACR | 0.12 | 1 | –0.04 | –0.01 | 0.10 | –0.18 |
| K | –0.02 | –0.04 | 1 | –0.07 | 0.03 | –0.03 |
| Hb | 0.07 | –0.01 | –0.07 | 1 | 0.30 | –0.13 |
| Cholesterol | 0.02 | 0.10 | 0.03 | 0.30 | 1 | –0.05 |
| Uric acid | –0.17 | –0.18 | –0.03 | –0.13 | –0.05 | 1 |
Prediction of renal outcome
During a median follow-up of 2.6 years, 151 (28.4%) patients treated with losartan reached a composite event of doubling of serum creatinine or ESRD. Changes in multiple biomarkers for each individual were integrated and represented by the PRE score. PRE scores of individual patients were associated with renal outcome independent of baseline renal risk markers (HR 3.18 (95% confidence interval (CI) 2.32, 4.37, P < 0.01) per unit increment in PRE score.
Relative to using changes in SBP to monitor the efficacy of losartan, using the PRE score significantly improved renal risk prediction (RIDI 30.4%, P < 0.01; Table4). The C statistic of the PRE score for the renal outcome was 0.840, significantly higher (P < 0.01) than using changes in SBP alone (C statistic 0.796).
Table 4.
RIDI and C statistic for the predictive performance of using change in albuminuria or PRE score in a risk prediction model (corrected for baseline age, gender, eGFR, albuminuria and haemoglobin), compared with using SBP. Results are shown for RENAAL and IDNT since clinical renal outcomes were not collected in IRMA-2
| RIDI | C statistic | |
|---|---|---|
| RENAAL | ||
| SBP change | ref | 0.796 (ref) |
| Albuminuria change | 19.2% (P = 0.03) | 0.825 (P = 0.01) |
| PRE score | 30.4% (P < 0.01) | 0.840 (P < 0.01) |
| IDNT | ||
| SBP change | ref | 0.800 (ref) |
| Albuminuria change | 23.3% (P = 0.04) | 0.815 (P = 0.19) |
| PRE score | 30.5% (P = 0.02) | 0.825 (P = 0.10) |
Validation
In order to validate the results, we assessed the variation in response to multiple risk markers to ARBs in two other datasets from completed clinical trials.
First, in the IDNT trial, in which patients were treated with the ARB irbesartan, we observed similar response patterns when compared with RENAAL (Supplementary Figure S1, Table S2 and Table S3). As in RENAAL, a response in systolic blood pressure with irbesartan was not associated with other risk markers within individual patients. Additionally, we observed no correlations between responses within patients in different parameters suggesting that responses in multiple parameters within a patient are discordant. Using the PRE score improved renal risk prediction by 30.5% (P = 0.02 compared with using only SBP, Table4), with a C statistic of 0.825.
Secondly, we validated our results in the IRMA-2 trial in which patients with microalbuminuria were treated with irbesartan (Supplementary Figure S2, Table S4 and Table S5). Results were again similar as in RENAAL with a lack of congruency between changes in multiple risk markers within individuals. In a subset of patients in the IRMA-2 trial systolic blood pressure was measured by 24 h ambulatory blood pressure monitoring. Again, we observed no correlations in response, similar to the overall population (Supplementary Figure S3, Table S6).
Discussion
This study shows that the individual variability in renoprotection of intervention in the RAAS is not only determined by response variation of the target parameter blood pressure, but also by the variation of multiple off-target effects. Since variations in on-target and off-target effects were discordant within individual patients, a composite response score that takes changes in all risk markers into account is needed to optimize the predictive power of treatment-induced short term risk marker changes for long term renal outcomes. These results were replicated in two independent datasets.
The variation in response to RAASi has been an area of research interest for several decades 20,21. A large variability in the renal response to RAAS intervention has been observed ranging from no effect to a complete arrest of renal function decline 22,23. A meta analysis concluded from trial level data that the degree of blood pressure lowering is associated with the degree of renal protection 24. It is therefore logical that antihypertensive drugs are titrated to target blood pressure, expecting that this is an accurate indicator of kidney protection. However, ARBs have been shown to affect other renal risk markers than blood pressure, and changes in these risk markers also affect the ultimate renal outcome. In addition to the variable effects of ARBs on multiple risk markers between patients, we also showed that the response in multiple risk markers within individual patients is highly variable. Earlier studies with intervention in the RAAS have already revealed a discordance between blood pressure and albuminuria response to ARBs within individual patients, with both risk markers being independently associated with renal outcome 9–11. Previous studies also showed that the dose–response for blood pressure is different from the dose–response for albuminuria, confirming that responses to ARBs in these parameters are discordant 25–27. Our study builds upon these previous studies and shows for the first time that blood pressure response is also not congruent with responses to other risk markers. Importantly, none of the other (off-target) risk markers revealed a correlation in response with other risk markers. Therefore, monitoring blood pressure in the case of ARB therapy is not sufficient to predict the ultimate renal outcome.
What are the potential implications for clinical practice? Blood pressure control is beyond doubt critical to achieve long term renoprotection. Clinical practice guidelines therefore recommend to measure blood pressure regularly after the start of antihypertensive medication to monitor the effectiveness of the instituted therapy. However, only measuring blood pressure does not capture the potential response to other markers. Because changes in other risk markers are also associated with long term renal outcome, either contributing or offsetting the effect predicted by blood pressure response alone, our results suggest that it is necessary to monitor the effect on all known risk markers and integrate these effects to be able to predict accurately the ultimate treatment effect of ARBs in individual patients. This could also imply that further dose increase needs to be explored even if the SBP for an individual patient is controlled. The maximal effect on SBP does not necessarily equal the maximal renoprotective effect.
We have developed an individual risk alghorithm that incorporates drug responses in multiple parameters. In previous studies we showed that this alghorithm can be used to predict the effect of ARBs on a population level. In this study we showed that it also accurately predicts the ARB response on an individual level. Our results imply that long term renoprotection is still possible in the absence of a blood pressure response as long as the composite of the response to other risk markers is favourable for renoprotection. Vice versa, long term renal damage can occur even if blood pressure is decreased, but changes in other risk markers sum up to a degree of damage that exceeds the renoprotection induced by blood pressure reduction.
The underlying biological mechanisms that govern variation in response within individuals are not yet elucidated but several possible explanations exist. Firstly, there is the possibility of differences in systemic vs. renal tissue-specific RAAS activity. In this respect it has been shown that the blood pressure response depends to a large extent on extra-renal RAAS inhibition whereas it may be possible that the response in other risk markers, such as albuminuria, haemoglobin, potassium, depends on intra-renal RAAS inhibition 28. Secondly, the susceptibility of an individual in terms of sodium/potassium balance, albuminuria or blood pressure changes following changes in RAAS activity may be different as a result of differences in genetic make-up, dietary consumption or their combination 29,30. For example, genetic differences in CYP2C9, the enzyme metabolizing the pro-drug losartan to its active metabolite, may result in variation in drug exposure between individuals 31. Thirdly, as patients with diabetes and nephropathy use multiple drugs and concomitant drug use was present in the analyzed clinical trials, drug–drug interaction leading to different responses cannot be excluded. Patients may also respond differently to drugs due to differences in comorbidities, such as renal artery stenosis. Finally, it is possible that the lack of correlation in responses is due to measurement error. However, all risk markers were measured in central laboratories using strict guidelines and criteria and blood pressure was measured according to standardized protocol guidelines. Additionally, the finding that even 24 h blood pressure response did not produce correlations with responses to other markers in a subset of the IRMA-2 trial makes the possibility of misclassification less likely.
We showed that adding ARB-induced changes to a renal risk model markedly improved renal risk prediction. Much research is focused on developing new biomarker-based models for predicting diabetic disease progression and renal outcomes with generally modest additional value 32–34. In this respect it is noteworthy that prediction of renal endpoints markedly improved by considering response to ARBs in readily available clinical parameters. Thus, using the multiple PRE score is a pragmatic, cheap and effective tool to improve renal risk prediction.
Our study has limitations. First, the trials included in this study were designed to assess the effects of ARBs on renal disease progression and were not designed to investigate the variability in response. The results of this study are therefore only hypothesis generating. Prospective studies are required to confirm our findings and are currently ongoing (IMPROVE study; Dutch trial register NTR 4439). Although blood pressure was measured according predefined protocol guidelines, 24 h blood pressure monitoring results were only available in a small subset of patients. In addition, changes in other risk markers were based on changes between two pre-determined time points without a confirmatory measurement. We can therefore not exclude that part of the ’response’ variability is due to random day-to-day variability and/or measurement variability. Second, the predictions of the PRE score are based on the assumption that the drug effect at 6months persists over time. It may be possible, however, that during prolonged follow-up risk markers of some patients may regress to baseline values. This may have led to an underestimation of the predictive performance of the PRE score.
In conclusion, our study shows that ARBs have variable effects on multiple risk markers (between-patient variability) and these effects vary within patients. An individual risk model that takes variability in treatment response to all known risk markers into account provides a more accurate prediction of who will benefit from ARB therapy than using blood pressure or any other single marker alone. This suggests that in clinical practice all relevant risk markers should be monitored and integrated to appreciate fully the ARB treatment effect on renal outcomes. Further studies are required to prospectively validate these findings.
Competing Interests
All authors have completed the Unified Competing Interest form at http://www.icmje.org/coi_disclosure.pdf (available on request from the corresponding author) and declare HLH is a consultant (honoraria to institution) for AbbVie, Astellas, Johnson & Johnson, Reata and Vitae, DdZ is a consultant (honoraria to institution) for AbbVie, Astellas, AstraZeneca, Chemocentryx, J&J, Hemocue, Novartis, Reata, Takeda and Vitae, PR is a consultant or has given lectures (honoraria to institution) for AbbVie, Astellas, Astra Zeneca, BMS, Bayer, Boehringer Ingelheim, Johnson & Johnson, MSD, Reata, Sanofi Aventis and NovoNordisk and HHP and BS have no financial relationships with any organizations that might have an interest in the submitted work.
The clinical trials we used for our post-hoc analysis each have approximately 150 individual trial centres, each with an IRB that has approved the study. This means that for the three trials included in our study, hundreds of IRBs were involved. Therefore we are unable to provide all the names of the IRBs involved in the trials used for this study. However, each of the trials used has been properly referenced in the manuscript with respect to design and outcome.
The RENAAL trial was funded by Merck & Co. The IDNT and IRMA-2 trials were sponsored by Bristol Myer Squibb Institute for Medical Research and Sanofi-Synthelabo.
This work was performed as part of the Escher project (project nr. T6-503) within the framework of the Dutch Top Institute Pharma. We would like to thank Skander Mulder from the University of Groningen, Groningen, the Netherlands for his help with creating the radar plots. H.J. Lambers Heerspink is supported by a VENI-Grant from the Netherlands Organization for Scientific Research. BS is the guarantor of this work and, as such, had full access to all the data in the study and takes responsibility for the integrity of the data and the accuracy of the data analysis. Author contributions: BS and HJLH analyzed the data and wrote the manuscript. DdZ, HHP, PR and HJLH collected the data, contributed to the design of the study and reviewed the manuscript.
Supporting Information
Figure S1 Discordance between ARB-induced responses in multiple parameters within individual patients. Variation in risk marker response and responder populations in IDNT, similar to Figure
Figure S2 Discordance between ARB-induced responses in multiple parameters within individual patients. Variation in risk marker response and responder populations in IRMA-2, similar to Figure
Figure S3 Discordance between ARB-induced responses in multiple parameters within individual patients. Variation in SBP response for total and responder population in IRMA-2 subset with 24h SBP measurements
Table S1 Comparison of all patients randomized to losartan versus complete case subset derived from the RENAAL study
Table S2 Proportion of patients with response in overall population and responder populations in IDNT
Table S3 Pearson’s correlation coefficients between responses in individual risk markers in individual patients for IDNT
Table S4 Proportion of patients with response in overall population and responder populations in IRMA-2
Table S5 Pearson’ss correlation coefficients between responses in individual risk markers in individual patients for IRMA-2
Table S6 Proportion of patients with response in overall population and responder populations, and Pearson correlation coefficients between SBP and other responses in IRMA-2 patients with 24h SBP measurements
Supporting info item
Supporting info item
Supporting info item
Supporting info item
References
- Volpe M, Cosentino F, Tocci G, Palano F, Paneni F. Antihypertensive therapy in diabetes: The legacy effect and RAAS blockade. Curr Hypertens Rep. 2011;13:318–24. doi: 10.1007/s11906-011-0205-z. [DOI] [PubMed] [Google Scholar]
- Steckelings UM, Rompe F, Kaschina E, Unger T. The evolving story of the RAAS in hypertension, diabetes and CV disease ? moving from macrovascular to microvascular targets. Fundam Clin Pharmacol. 2009;23:693–703. doi: 10.1111/j.1472-8206.2009.00780.x. [DOI] [PubMed] [Google Scholar]
- Heerspink HJ, de Zeeuw D. The kidney in type II diabetes therapy. Rev Diabet Stud. 2011;8:392–402. doi: 10.1900/RDS.2011.8.392. [DOI] [PMC free article] [PubMed] [Google Scholar]
- Smink PA, Bakker SJL, Laverman GD, Berl T, Cooper ME, de Zeeuw D, Lambers Heerspink HJ. An initial reduction in serum uric acid during angiotensin receptor blocker treatment is associated with cardiovascular protection: A post-hoc analysis of the RENAAL and IDNT trials. J Hypertens. 2012;30:1022–8. doi: 10.1097/HJH.0b013e32835200f9. [DOI] [PubMed] [Google Scholar]
- Miao Y, Dobre D, Lambers Heerspink HJ, Brenner BM, Cooper ME, Parving H, Shahinfar S, Grobbee D, Zeeuw D. Increased serum potassium affects renal outcomes: A post hoc analysis of the reduction of endpoints in NIDDM with the angiotensin II antagonist losartan (RENAAL) trial. Diabetologia. 2011;54:44–50. doi: 10.1007/s00125-010-1922-6. [DOI] [PMC free article] [PubMed] [Google Scholar]
- Mohanram A, Zhang Z, Shahinfar S, Lyle PA, Toto RD. The effect of losartan on hemoglobin concentration and renal outcome in diabetic nephropathy of type 2 diabetes. Kidney Int. 2007;73:630–6. doi: 10.1038/sj.ki.5002746. [DOI] [PubMed] [Google Scholar]
- de Zeeuw D, Remuzzi G, Parving H, Keane WF, Zhang Z, Shahinfar S, Snapinn S, Cooper ME, Mitch WE, Brenner BM. Proteinuria, a target for renoprotection in patients with type 2 diabetic nephropathy: Lessons from RENAAL. Kidney Int. 2004;65:2309–20. doi: 10.1111/j.1523-1755.2004.00653.x. [DOI] [PubMed] [Google Scholar]
- Tershakovec AM, Keane WF, Zhang Z, Lyle PA, Appel GB, McGill JB, Parving H, Cooper ME, Shahinfar S, Brenner BM. Effect of LDL cholesterol and treatment with losartan on end-stage renal disease in the RENAAL study. Diabetes Care. 2008;31:445–7. doi: 10.2337/dc07-0196. [DOI] [PubMed] [Google Scholar]
- Holtkamp FA, de Zeeuw D, de Graeff PA, Laverman GD, Berl T, Remuzzi G, Packham D, Lewis JB, Parving H, Lambers Heerspink HJ. Albuminuria and blood pressure, independent targets for cardioprotective therapy in patients with diabetes and nephropathy: A post hoc analysis of the combined RENAAL and IDNT trials. Eur Heart J. 2011;32:1493–9. doi: 10.1093/eurheartj/ehr017. [DOI] [PubMed] [Google Scholar]
- Eijkelkamp WBA, Zhang Z, Remuzzi G, Parving H, Cooper ME, Keane WF, Shahinfar S, Gleim GW, Weir MR, Brenner BM, de Zeeuw D. Albuminuria is a target for renoprotective therapy independent from blood pressure in patients with type 2 diabetic nephropathy: Post hoc analysis from the reduction of endpoints in NIDDM with the angiotensin II antagonist losartan (RENAAL) trial. JASN. 2007;18:1540–6. doi: 10.1681/ASN.2006050445. [DOI] [PubMed] [Google Scholar]
- Laverman GD, Andersen S, Rossing P, Navis G, de Zeeuw D, Parving H. Renoprotection with and without blood pressure reduction. Kidney Int. 2005;67:S54–9. doi: 10.1111/j.1523-1755.2005.09414.x. [DOI] [PubMed] [Google Scholar]
- Brenner BM, Cooper ME, de Zeeuw D, Keane WF, Mitch WE, Parving H, Remuzzi G, Snapinn SM, Zhang Z, Shahinfar S. Effects of losartan on renal and cardiovascular outcomes in patients with type 2 diabetes and nephropathy. N Engl J Med. 2001;345:861–9. doi: 10.1056/NEJMoa011161. [DOI] [PubMed] [Google Scholar]
- Lewis EJ, Hunsicker LG, Clarke WR, Berl T, Pohl MA, Lewis JB, Ritz E, Atkins RC, Rohde R, Raz I. Renoprotective effect of the angiotensin-receptor antagonist irbesartan in patients with nephropathy due to type 2 diabetes. N Engl J Med. 2001;345:851–60. doi: 10.1056/NEJMoa011303. [DOI] [PubMed] [Google Scholar]
- Parving H, Lehnert H, Bröchner-Mortensen J, Gomis R, Andersen S, Arner P. The effect of irbesartan on the development of diabetic nephropathy in patients with type 2 diabetes. N Engl J Med. 2001;345:870–8. doi: 10.1056/NEJMoa011489. [DOI] [PubMed] [Google Scholar]
- Smink PA, Miao Y, Eijkemans MJC, Bakker SJL, Raz I, Parving H, Hoekman J, Grobbee DE, de Zeeuw D, Lambers Heerspink HJ. The importance of short-term off-target effects in estimating the long-term renal and cardiovascular protection of angiotensin receptor blockers. Clin Pharmacol Ther. 2014;95:208–15. doi: 10.1038/clpt.2013.191. [DOI] [PubMed] [Google Scholar]
- Smink P, Hoekman J, Grobbee D, Eijkemans M, Parving HH, Persson F, Ibsen H, Lindholm L, Wachtell K, de Zeeuw D, Heerspink HL. A prediction of the renal and cardiovascular efficacy of aliskiren in ALTITUDE using short-term changes in multiple risk markers. Eur J Prev Cardiol. 2014;21:434–41. doi: 10.1177/2047487313481754. [DOI] [PubMed] [Google Scholar]
- Heerspink HJL, Grobbee DE, de Zeeuw D. A novel approach for establishing cardiovascular drug efficacy. Nat Rev Drug Discov. 2014;13:942. doi: 10.1038/nrd4090-c2. [DOI] [PubMed] [Google Scholar]
- Keane WF, Brenner BM, De Zeeuw D, Grunfeld J, Mcgill J, Mitch WE, Ribeiro AB, Shahinfar S, Simpson RL, Snapinn SM, Toto R. The risk of developing end-stage renal disease in patients with type 2 diabetes and nephropathy: The RENAAL study. Kidney Int. 2003;63:1499–507. doi: 10.1046/j.1523-1755.2003.00885.x. [DOI] [PubMed] [Google Scholar]
- Pencina MJ, D’Agostino RB, D’Agostino RB, Vasan RS. Evaluating the added predictive ability of a new marker: From area under the ROC curve to reclassification and beyond. Stat Med. 2008;27:157–72. doi: 10.1002/sim.2929. [DOI] [PubMed] [Google Scholar]
- Heeg JE, de Jong PE, van der Hem GK, de Zeeuw D. Efficacy and variability of the antiproteinuric effect of ACE inhibition by lisinopril. Kidney Int. 1989;36:272–9. doi: 10.1038/ki.1989.190. [DOI] [PubMed] [Google Scholar]
- Fornage M, Amos CI, Kardia S, Sing CF, Turner ST, Boerwinkle E. Variation in the region of the angiotensin-converting enzyme gene influences interindividual differences in blood pressure levels in young white males. Circulation. 1998;97:1773–9. doi: 10.1161/01.cir.97.18.1773. [DOI] [PubMed] [Google Scholar]
- Rossing P, Hommel E, Smidt UM, Parving HH. Reduction in albuminuria predicts a beneficial effect on diminishing the progression of human diabetic nephropathy during antihypertensive treatment. Diabetologia. 1994;37:511–6. doi: 10.1007/s001250050140. [DOI] [PubMed] [Google Scholar]
- Bos H, Andersen S, Rossing P, de Zeeuw D, Parving H, de Jong PE, Navis G. Role of patient factors in therapy resistance to antiproteinuric intervention in nondiabetic and diabetic nephropathy. Kidney Int. 2000;57:S32–7. [PubMed] [Google Scholar]
- Bakris GL, Williams M, Dworkin L, Elliott WJ, Epstein M, Toto R, Tuttle K, Douglas J, Hsueh W, Sowers J. Preserving renal function in adults with hypertension and diabetes: A consensus approach. AJKD. 2000;36:646–61. doi: 10.1053/ajkd.2000.16225. [DOI] [PubMed] [Google Scholar]
- Burgess E, Muirhead N, de Cotret PR, Chiu A, Pichette V, Tobe S. the SMART (Supra Maximal Atacand Renal Trial) Investigators. Supramaximal dose of candesartan in proteinuric renal disease. JASN. 2009;20:893–900. doi: 10.1681/ASN.2008040416. [DOI] [PMC free article] [PubMed] [Google Scholar]
- Rossing K, Schjoedt KJ, Jensen BR, Boomsma F, Parving H. Enhanced renoprotective effects of ultrahigh doses of irbesartan in patients with type 2 diabetes and microalbuminuria. Kidney Int. 2005;68:1190–8. doi: 10.1111/j.1523-1755.2005.00511.x. [DOI] [PubMed] [Google Scholar]
- Hollenberg NK, Parving H, Viberti G, Remuzzi G, Ritter S, Zelenkofske S, Kandra A, Daley WL, Rocha R. Albuminuria response to very high-dose valsartan in type 2 diabetes mellitus. J Hypertens. 2007;25:1921–6. doi: 10.1097/HJH.0b013e328277596e. [DOI] [PubMed] [Google Scholar]
- Crowley SD, Gurley SB, Oliverio MI, Pazmino AK, Griffiths R, Flannery PJ, Spurney RF, Kim H, Smithies O, Le TH, Coffman TM. Distinct roles for the kidney and systemic tissues in blood pressure regulation by the renin-angiotensin system. J Clin Invest. 2005;115:1092–9. doi: 10.1172/JCI200523378. [DOI] [PMC free article] [PubMed] [Google Scholar]
- Vogt L, Waanders F, Boomsma F, de Zeeuw D, Navis G. Effects of dietary sodium and hydrochlorothiazide on the antiproteinuric efficacy of losartan. J Am Soc Nephrol. 2008;19:999–1007. doi: 10.1681/ASN.2007060693. [DOI] [PMC free article] [PubMed] [Google Scholar]
- Lely AT, Heerspink HJL, Zuurman M, Visser FW, Kocks MJA, Boomsma F, Navis G. Response to angiotensin-converting enzyme inhibition is selectively blunted by high sodium in angiotensin-converting enzyme DD genotype: Evidence for gene-environment interaction in healthy volunteers. J Hypertens. 2010;28:2414–21. doi: 10.1097/HJH.0b013e32833eaf34. [DOI] [PubMed] [Google Scholar]
- Yasar Ü, Forslund-Bergengren C, Tybring G, Dorado P, LLerena A, Sjöqvist F, Eliasson E, Dahl M. Pharmacokinetics of losartan and its metabolite E-3174 in relation to the CYP2C9 genotype. Clin Pharmacol Ther. 2002;71:89–98. doi: 10.1067/mcp.2002.121216. [DOI] [PubMed] [Google Scholar]
- Schena FP. Biomarkers and personalized therapy in chronic kidney diseases. Expert Opin Investig Drugs. 2014;23:1051–4. doi: 10.1517/13543784.2014.922953. [DOI] [PubMed] [Google Scholar]
- Kolberg JA, Jørgensen T, Gerwien RW, Hamren S, McKenna MP, Moler E, Rowe MW, Urdea MS, Xu XM, Hansen T, Pedersen O, Borch-Johnsen K. Development of a type 2 diabetes risk model from a panel of serum biomarkers from the Inter99 cohort. Diabetes Care. 2009;32:1207–12. doi: 10.2337/dc08-1935. [DOI] [PMC free article] [PubMed] [Google Scholar]
- Wu H, Yu Z, Qi Q, Li H, Sun Q, Lin X. Joint analysis of multiple biomarkers for identifying type 2 diabetes in middle-aged and older chinese: A cross-sectional study. BMJ Open. 2011;1 doi: 10.1136/bmjopen-2011-000191. : e000191. [DOI] [PMC free article] [PubMed] [Google Scholar]
Associated Data
This section collects any data citations, data availability statements, or supplementary materials included in this article.
Supplementary Materials
Supporting info item
Supporting info item
Supporting info item
Supporting info item