

Abstract
Aims
The aim was to investigate the QT effect of a single dose combination regimen of piperaquine phosphate (PQP) and a novel aromatic trioxolane, OZ439, for malaria treatment.
Methods
Exposure–response (ER) analysis was performed on data from a placebo-controlled, single dose, study with OZ439 and PQP. Fifty-nine healthy subjects aged 18 to 55 years received OZ439 alone or placebo in a first period, followed by OZ439 plus PQP or matching placebos in period 2. OZ439 and PQP doses ranged from 100–800 mg and 160–1440 mg, respectively. Twelve-lead ECG tracings and PK samples were collected serially pre- and post-dosing.
Results
A significant relation between plasma concentrations and placebo-corrected change from baseline QTcF (ΔΔQTcF) was demonstrated for piperaquine, but not for OZ439, with a mean slope of 0.047 ms per ng ml−1 (90% CI 0.038, 0.057). Using an ER model that accounts for plasma concentrations of both piperaquine and OZ439, a largest mean QTcF effect of 14 ms (90% CI 10, 18 ms) and 18 ms (90% CI 14, 22 ms) was predicted at expected plasma concentrations of a single dose 800 mg OZ439 combined with PQP 960 mg (188 ng ml−1) and 1440 mg (281 ng ml−1), respectively, administered in the fasted state.
Conclusions
Piperaquine prolongs the QTc interval in a concentration-dependent way. A single dose regimen combining 800 mg OZ439 with 960 mg or 1440 mg PQP is expected to result in lower peak piperaquine plasma concentrations compared with available 3 day PQP-artemisinin combinations and can therefore be predicted to cause less QTc prolongation.
Keywords: exposure–response, malaria, OZ439, piperaquine, QT, QTc
What is Already Known about this Subject
Piperaquine selectively blocks the cardiac IKr current (hERG).
Piperaquine and other drugs from the 4-aminoquinoline class cause QT prolongation at therapeutic plasma concentrations.
Available 3 day treatment regimens with an artemisinin + piperaquine result in accumulation of piperaquine plasma concentrationss and cause peak QTc prolongation of around 30 ms.
What this Study Adds
Exposure response analysis on data from healthy subjects dosed with a novel aromatic trioxolane, OZ439 and piperaquine, quantified the relationship between piperaquine and OZ439 plasma concentrations and QTcF prolongation.
A single dose regimen with OZ439 + piperaquine is expected to produce lower piperaquine concentrations and less QTc prolongation than 3 day therapies.
Introduction
According to the World Malaria Report 2013 1, there were 104 malaria-endemic countries and territories in 2013, of which 97 had on-going malaria transmission. There were an estimated 207 million cases of malaria (range 135–287 million) and 627 000 deaths (range 473 000–789 000) in 2012. Plasmodium falciparum malaria infection in non-immune patients is a progressive disease, being considered a medical emergency 2,3 and effective treatment is urgently required to reduce the infecting parasite biomass as rapidly as possible, to clear infection, to prevent complications and to minimize the risk of a fatal outcome 3. The current standard of care for acute uncomplicated malaria is an artemisinin combination therapy (ACT). This comprises a combination of an artemisinin class compound, all of which have a short duration of action, and a partner antimalarial drug, which possesses a longer half-life, the authorized exemplar in the US being artemether-lumefantrine (AL) and in Europe AL and dihydroartemisinin-piperaquine (DHA-PQP). The rationale underlying such combinations is rapid reduction in parasitaemia, protection against recrudescence and minimization of the risk of resistance developing against either constituent antimalarial. A concern of global public health importance is the emergence of artemisinin resistance 4, which indicates a pressing need for the development of new antimalarials 5. All currently deployed ACTs require 3 day regimens, with consequent risk of non-adherence.
OZ439 is a novel aromatic trioxolane compound under development as part of a combination therapy for the cure of acute uncomplicated malaria. Aromatic trioxolanes are related to artemisinins in that their chemical structures contain the endoperoxide pharmacophore that leads to the rapid reduction in parasitaemia seen with these agents, but otherwise are structurally quite distinct. OZ439 demonstrates a rapid onset of effect and a single 800 mg dose results in OZ439 plasma concentrations above the estimated minimum parasiticidal concentration for over 7 days on average (data on file, Medicines for Malaria Venture; MMV), and hence may confer efficacy following a single dose (as part of a combination treatment). The drug has demonstrated acute clinical efficacy on parasitaemia following single dose treatment in a proof of concept study in malaria patients in Thailand, and in vitro studies suggest OZ439 retains activity against P. falciparum strains exhibiting decreased sensitivity to the artemisinins (data on file, MMV). The drug is under development for use in combination with a partner molecule, with a rationale similar to that of existing ACTs. The goal is to develop a single dose regimen with an OZ439 + partner molecule combination, which would likely improve adherence and thus increase clinical effectiveness and reduce the risk of resistance emergence. The widespread occurrence of resistance by the malaria parasite to a range of currently deployed antimalarials and the need for a partner drug with a long half-life however limits the availability of candidate partner molecules for OZ439. Currently, the combination of OZ439 with piperaquine phosphate (PQP) is under evaluation in a phase 2b study in patients with uncomplicated malaria (clinicalTrials.gov NCT02083380).
A clearly identified safety concern with PQP and other members of the 4-aminoquinoline drug class is the potential to cause QTc prolongation at therapeutic doses 6,7 and for example, QT prolongation is described in the European Summary of Product Characteristics for Eurartesim®, a DHA-PQP combination 8. The molecular mechanism for QT prolongation with piperaquine is selective inhibition of the cardiac delayed rectifier current, IKr (also referred to as the hERG channel). Compared with chloroquine, which has effects on several cardiac ion channels [IKr (Kv11.1), INa, (Nav1.1), ICa (Cav 1.2)] and therefore can impair ventricular conduction as well as causing increased automaticity 9, piperaquine is a less potent and more selective inhibitor of IKr 10. Piperaquine blocks IKr with an IC50 of approximately 0.10 µm (data on-file, MMV) but has no effect on the sodium current (INa) at therapeutic plasma concentrations 10. Based on 99% protein binding and a mean Cmax of approximately 500 ng ml−1 (1 µm) after 3 days of 960 mg (corresponding to approximately 19 mg kg−1 day−1 in a 50 kg adult) once daily dosing in the fasted state, this gives a ∼15-fold safety margin IC50/free therapeutic plasma concentration. Piperaquine does not inhibit expression of the IKr channel (i.e. does not affect hERG protein trafficking in cells), INa currents or IKs current at concentrations up to 3 µm 10. In the rabbit heart ventricular wedge preparation 11, piperaquine increased the action potential duration in a concentration-related manner at 0.1–3 µm but the ’pro-arrhythmic (TdP) score’ signal, observed only at the highest dose tested, was lower (1.8) than for chloroquine (5.2) and dofetilide (10) in the same assay 10,11. OZ439 has a very low risk of causing QT prolongation in humans at therapeutic concentrations based on its low potency IKr inhibition, with an IC50 of approximately 22 µm and above 10 µm for two main metabolites and no effect on QTc interval duration in conscious dogs with exposures of OZ439 up to 1335 ng ml−1 (Data on file, MMV). The average Cmax after a single dose of 800 mg OZ439 is about 1400 ng ml−1 (3 µm), corresponding to 0.120 µm free concentration (96% protein binding), which results in a 180-fold safety margin, well above the < 30-fold margin often used as a cutoff for drugs that cause clinically relevant QT prolongation 12.
For the piperaquine combination available in Europe, Eurartesim® (DHA + PQP) it is recommended that the drug is given only with precaution to patients with risk factors for pro-arrhythmias and is avoided in patients on other drugs that may cause QTc prolongation 8. Based on this safety concern, it is critical to evaluate the extent to which QTc prolongation can be expected in novel PQP combinations, especially through changes in dose, dosing regimen (e.g. single high dose vs. multiple dose) or through pharmacokinetic and pharmacodynamic interactions between the two constituents. With the objective of improving our understanding of the level of QT prolongation with PQP combined with OZ439, we performed exposure–response (ER) analysis of ECG data from a single dose study in healthy subjects administered OZ439 alone and in combination with PQP. A model that accounted for plasma concentrations of both constituents was fitted to the data 13. The ER model was then used to predict QT effects of novel single dose regimens of OZ439 + PQP which are anticipated to be clinically effective.
Methods
Sixty healthy male and female subjects between the ages of 18 and 55 years were enrolled into a randomized, placebo controlled, double blind, two period, parallel group, dose escalation study with the objective to provide initial human safety and pharmacokinetic data for the co-administration of OZ439 with PQP (clinicalTrials.gov NCT01660022). Five sequential groups were studied with 12 subjects per group, randomized to OZ439 (n = 8) or placebo (n = 4). Subjects underwent two treatment periods with 7 days washout in-between. In the first period, OZ439 or placebo alone was administered and in the second, OZ439 in combination with PQP or matching placebos. Subjects who were randomized to placebo in period 1 also received placebo in period 2. Study drugs were administered in the fasted state with 200 ml full fat cow’s milk to enhance the absorption of OZ439. OZ439 was administered as powder in bottle for oral suspension (PIB) and piperaquine as PQP tablets. Studied groups and doses are shown in Table1.
Table 1.
Studied groups and doses
| Group | Period 1 | Period 2 | |
|---|---|---|---|
| 1 | OZ439 100 mg | OZ439 100 mg + 160 mg PQP | |
| 2 | OZ439 100 mg | OZ439 100 mg + 480 mg PQP | |
| 3 | OZ439 100 mg | 7 days washout | OZ439 100 mg + 1440 mg PQP |
| 4 | OZ439 300 mg | OZ439 300 mg + 1440 mg PQP | |
| 5 | OZ439 800 mg | OZ439 800 mg + 1440 mg PQP |
PQP, piperaquine phosphate.
The study were reviewed and approved by an independent Ethics Committee (EC; Comitato Etico Cantonale, Canton Ticino, Switzerland; Reference n. CE2561). All study subjects were provided with written and oral information about the study and gave their written consent to participate.
ECG assessment and analysis of heart rate and QTcF by time point
Continuous 12-lead ECGs were recorded on day −1 (the day before dosing) for baseline assessment and on day 1 in each treatment period. PK blood draws and ECGs were recorded at the following time points in both treatment periods: pre-dosing and 2, 4, 6, 8, 12, 16 and 24 h post-dosing and at corresponding clock times on day −1 of period 1. Twelve-lead ECGs were extracted in triplicates from a continuous recording and intervals were measured at a central ECG laboratory. Additional safety ECGs were recorded on other time points, but were not included in this analysis.
For each ECG parameter (heart rate and QTcF) and each treatment period, time-matched changes from baseline (ΔHR and ΔQTcF) under active treatment were contrasted with the matching placebo time-matched changes from baseline through an analysis of variance (anova) model for repeated measurements. The mean ΔQTcF on placebo by time point was subtracted from each subject’s ΔQTcF at the time points to derive the placebo-corrected ΔQTcF (ΔΔQTcF). The anova included terms for dose level, time point and their interaction. The residual matrix was structured to take into account the repeated nature of the data. The resulting mean difference to baseline and two-sided 90% confidence intervals (CIs) were displayed by time and dose group separately for each period.
Pharmacokinetic analyses
The concentrations of OZ439, its metabolites and piperaquine (free base) in plasma were measured using validated liquid chromatography-tandem mass spectrometry (LC-MS/MS) methods at Swiss BioQuant, Reinach, Switzerland. The lower limit of quantification (LLOQ) was 1.00 ng ml−1 for all analytes. For piperaquine the inter-batch precision was between 3.7% and 5.8% whereas the inter-batch accuracy was in the range from 94.5% to 99.5% of nominal concentration. For OZ439 the inter-batch precision was between 5.2% and 8.3% whereas the inter-batch accuracy was in the range from 100.0% to 100.7% of nominal concentration. The peak plasma concentration (Cmax) and the time thereof (tmax) were read directly from the plasma concentration data separately for each period. From the individual peak plasma concentrations, geometric means and geometric coefficients of variation were calculated by treatment group and period.
Exposure response analysis of QTc effect
Observed plasma concentrations of OZ439 and piperaquine were directly linked to the QT observations by nominal time points. The time differences between the matched ECG and blood samples were to be less than 5 min (up to 6 h post-dose) or less than 10 min (between 6 and 24 h post-dose). Concentrations below the limit of quantification (BLQ) were set to half the LLOQ, except after placebo when the concentrations were set to zero. The methodology for ER analysis of the QT effect followed the recent development which has evolved from the IQ-CSRC prospective study, designed and analyzed in collaboration with the FDA 14,15, with modifications due to use of combination therapy 13. Time-averaged QTcF from all time-points on day −1 in period 1 were used as baseline. The QT interval was corrected for heart rate changes using Fridericia’s correction (QTc = QT • RR–0.33) 16 using QT and RR values for each time point. A linear mixed effects model was fitted to all post-dose data with:
the change from baseline QTcF (ΔQTcF) as dependent variable;
the concentrations of OZ439 (OZ) and piperaquine (PQ) as predictive covariates as well as an interaction term between the two;
time (TP) as a factor. Note that time-points in the two periods were considered separate, so that this resulted in a factor with 16 levels;
treatment (monotherapy, combination or placebo) as factor (treat;
baseline as covariate (bl;
a random intercept per subject.
For subject i in period j at time k having received treatment treatij this model reads:
ΔQTcFijk = b1 OZijk + b2 PQijk + b3 OZijk PQijk + b4 bli + a1(treatij) + a2(TPjk) + ηi + εijk with unknown effects a1 and a2 and coefficients b1 … b4 and normally distributed random subject effect ηi and error term εijk.
In this model, subjects under OZ monotherapy were included with concentration of piperaquine set to 0, while subjects having received placebo were included with both concentrations set to 0.
The above model assumed that for both drugs the concentration–effect relationship does not show hysteresis and is linear. In addition to the usual validation of model fit, these two aspects were therefore specifically addressed. If the largest mean ΔΔQTcF within a period was more than 5 ms and the difference between the time point of its occurrence and the plasma concentration mean tmax was more than 1 h and statistically significant, as tested using a one-sided, one-sample Wilcoxon test at the 1% significance level, hysteresis was considered to be present. These criteria were applied to data from OZ439 alone in period 1 and to data from period 2 using piperaquine concentration data. To assess the appropriateness of a linear model, normal QQ plots for the residuals and a plot of residuals vs. each of the concentrations were produced. The standard plot of normalized residuals vs. fitted values was also presented.
Scatter plots of ΔQTcF against plasma concentrations of OZ439 and of piperaquine were produced and a line and two-sided 90% confidence region for the partial regression on the respective drug concentration as used in a combination therapy were generated. Data displayed in these plots also show the influence of time and of the other drug, and therefore this regression line does not necessarily go through the centre of the scatter plot.
The QT effect (ΔΔQTcF) was predicted from this model for several scenarios, including those derived from the study itself:
at the geometric mean Cmax of OZ439 across the subjects receiving 800 mg of the drug, based on the period 1 data (‘Effect of OZ439 only’);
at the geometric mean Cmax of piperaquine in the three groups that received 1440 mg of the drug (in period 2), with the concentration of OZ439 set to 0 (‘Effect of PQP only’);
at the geometric mean Cmax of piperaquine and the geometric mean of the concentrations of OZ439 at tmax of piperaquine in subjects that received 800 mg of OZ439 and 1440 mg of the PQP (‘Combined effect’).
In addition, QTcF predictions were made for the projected mean Cmax values for the anticipated clinically effective single dose regimens in patients. The dose combinations currently being evaluated in malaria patients were selected based on predicted efficacy as well as safety and tolerability. The efficacy predictions suggest that two different safe and well tolerated combinations may achieve the target clinical efficacy of over 95% cure rate at day 28, a single dose treatment of 800 mg OZ439 (α-tocopherol derived formulation resulting in similar exposure to that achieved when administered with milk) plus either 960 or 1440 mg PQP in the fasted state. The efficacy predictions were based on preliminary population PK/PD analyses of the effect on parasitaemia in healthy subjects (Human Malaria Challenge Model) as well as patients (for OZ439) for each of the individual drugs alone (data on file, MMV). The predicted mean Cmax values in patients were based on in-house data for OZ439 and a published population PK model for PQP 17.
Two-sided 90% confidence intervals were calculated for these predictions based on the standard errors of the estimates of the model parameters.
Results
Pharmacokinetics
The PK/QT analysis set comprised 56 male subjects with a mean (SD) age between 32.1 (8.4) years and 41.7 (7.1) years across dose groups and with a body mass index between 22.9 (2.2) and 25.9 (2.4) kg m−2. There were eight subjects in group 1 and three (100 mg OZ439 + PQP 160 mg and 100 mg OZ439 + 1440 PQP mg), seven subjects in group 2 and four (100 mg OZ439 + 480 PQP mg and 300 mg OZ439 + 1440 PQP mg), six subjects group 5 (800 mg OZ439 + 1440 PQP mg) and 17 subjects in the pooled placebo group. One subject in each of groups 2, 4 and 5 contributed only to period 1 data. One subject in group 5 vomited after drug intake in period 2 and therefore had lower plasma concentrations. This subject was excluded from the PK analysis and from the analysis of mean ΔΔQTcF, but included in the estimation of the ER model (although excluded for the estimation of the geometric mean Cmax).
The mean plasma concentration–time profiles for the various treatment combinations of OZ439 and piperaquine are shown in Figure1. The range of observed OZ439 and piperaquine concentrations available for the ER analysis were 1.07 to 2610 ng ml−1 and 1.7 to 799 ng ml−1, respectively. The geometric mean Cmax for OZ439 ranged from 138 to 199 ng ml−1 in subjects dosed with 100 mg. It reached 578 and 778 ng ml−1 after administration of 300 mg and 1478 and 1654 ng ml−1 after 800 mg, without and with PQP, respectively (Figure1A). A modest effect of piperaquine on the OZ439 exposures was observed, with 1440 mg PQP increasing the AUC(0,∞) and Cmax < 1.7 fold for the 100 mg OZ439 dose. However, for the 300 and 800 mg OZ439 dose, the effect was 1.3 fold or less.
Figure 1.
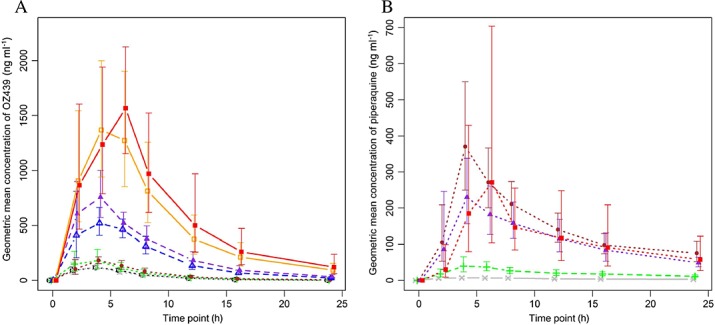
OZ439 (A) and piperaquine plasma concentration (B) vs. time profiles after single doses of OZ439 and co-administration of PQP and OZ439. Geometric means with 95% confidence intervals based on a log-normal distribution are given. A)  800 mg OZ439 + 1440 mg PQP,
  800 mg OZ439,
  300 mg OZ439 + 1440 mg PQP,
  300 mg OZ439,
  100 mg OZ439 + 1440 mg PQP,
  100 mg OZ439 + 480 mg PQP,
  100 mg OZ439 + 160 mg PQP,
  100 mg OZ439. B)
  800 mg OZ439 + 1440 mg PQP,
  300 mg OZ439 + 1440 mg PQP,
  100 mg OZ439 + 1440 mg PQP,
  100 mg OZ439 + 480 mg PQP,
  800 mg OZ439 + 160 mg PQP
Piperaquine geometric mean Cmax was 8.6 ng ml−1 (CV% 35.7) after administration of 160 mg PQP, 46.6 ng ml−1 (44.3) after 480 mg PQP and between 271 ng ml−1 (30.9) and 393 ng ml−1 (43.8) after 1440 mg PQP (Figure1B). The median tmax of both OZ439 and piperaquine was 4 h in most groups. Although the study did not include a PQP alone arm, no systematic effect of increasing OZ439 doses on the piperaquine exposures was observed.
Effects on heart rate and cardiac repolarization (the QTc interval)
Effects on heart rate by time point were generally small. The largest ΔΔHR on OZ439 alone was 3.0 beats min−1 6 h post-dosing and −1.8 beats min−1 at 24 h and −7.3 beats min−1 at 16 h in the 100 mg, 300 mg and 800 mg groups, respectively. In the highest OZ439 group (800 mg), a mean ΔHR of 4.9 beats min−1 (90% CI 1.2, 8.6) was also observed 4 h post-dosing. On treatment with OZ439 with PQP, the largest mean ΔΔHR was 5.7 beats min−1 at 16 h in the 100 mg OZ439 + 160 mg PQP group, 1.6 beats min−1 at 6 h in the 100 mg OZ439 + 480 mg PQP group, and varied between −7.4 beats min−1 and 6.5 beats min−1 in the groups combining 1480 mg PQP with 100 mg, 300 mg and 800 mg OZ439. The overall largest mean ΔΔHR was observed in the 800 mg OZ439 + 1480 mg PQP group at 2 h (6.5 beats min−1) and 4 h (5.0 beats min−1) post-dosing. The size of the heart rate effect and the pattern across treatments and doses do not suggest a clinically relevant effect on heart rate of OZ439 or the combination of OZ439 and PQP.
In period 1, during which OZ439 was given without concomitant PQP, doses of 100 mg and 300 mg had no clear effect on the placebo-adjusted, change from baseline QTcF (ΔΔQTcF; Figure2A). After dosing with 800 mg OZ439, the largest mean ΔΔQTcF of 8.5 ms was observed 6 h post-dosing. When OZ439 was given in combination with increasing doses of PQP in period 2, QTcF prolongation was observed that seemed to be related to the PQP dose. The largest mean ΔΔQTcF by time point in subjects receiving 1440 mg PQP was seen between 6 and 8 h after dosing and reached 15.9 ms, 21.3 ms and 26.4 ms in the three groups (Figure2B). The QT effect in subjects receiving lower doses of PQP was smaller with a largest mean ΔΔQTcF of 7.6 ms at 12 h in the group dosed with 160 mg PQP and 5.7 ms at 24 h in subject who received 480 mg PQP.
Figure 2.
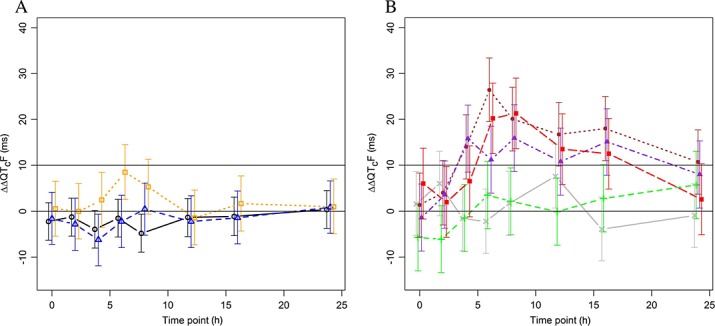
Placebo-adjusted, change from time matched baseline QTcF (ΔΔQTcF; mean ± 90%CI). Results are based on an analysis of variance model for repeated measurements with terms for dose level, time point and their interaction. A) Period 1 (OZ439 only). Number of subjects: 24, eight and seven subjects in the 100 mg, 300 mg and 800 mg groups, respectively.  800 mg OZ439,
  300 mg OZ439,
  100 mg OZ439. B) Period 2 (OZ439 + PQP). Number of subjects: eight subjects in 100 mg OZ439 + 160 mg PQP and 100 mg OZ439 + 1440 mg PQP, seven subjects in 100 mg OZ439 + 480 mg PQP and 300 mg OZ439 + 1440 mg PQP and six subjects in 800 mg OZ439 + 1440 mg PQP groups.
  800 mg OZ439 + 1440 mg PQP,
  300 mg OZ439 +1440 mg PQP,
  100 mg OZ439 +1440 mg PQP,
  100 mg OZ439 + 480 mg PQP,
  100 mg OZ439 + 160 mg PQP
A linear ER model was kept since the QQ plots for the residuals, the plot of residuals vs. each of the concentrations and the standard plot of normalized residuals vs. fitted values did not indicate substantial deviations from linearity. Although there were differences between tmax at 4 h for both drugs and the maximum effect seen at 6 h for the 800 mg OZ439 group in period 1 and 8 h for the pooled treatment groups of piperaquine, the formal Wilcoxon test was not significant at the pre-specified level. Therefore, a linear model without hysteresis and without interaction term between the concentrations of OZ439 and piperaquine was identified as primary. As the interaction term between concentrations of OZ439 and piperaquine was not significant, it was dropped from the primary model. Key parameters of this model are given in Table2. The slope of the ER relationship for OZ439 was not significant (Figure3A), whereas there was a significant concentration dependent prolongation of QTcF directly related to plasma concentrations of piperaquine with an estimated slope of 0.047 ms per ng ml−1 (90% CI 0.038, 0.057; Figure3B). The offset of combination therapy vs. placebo treatment was not significant.
Table 2.
Exposure–response analysis: Key parameters for the primary model
| Contrast | Estimate | 90% CI | |
|---|---|---|---|
| Lower | Upper | ||
| Slope OZ439 (ms per ng ml−1) | 0.00216 | −0.00021 | 0.00453 |
| Slope piperaquine (ms per ng ml−1) | 0.04747 | 0.03839 | 0.05654 |
| Offset combination therapy vs. placebo (ms) | 1.9 | −1.0 | 4.8 |
Estimates are based on a model without interaction between the drugs.
Figure 3.
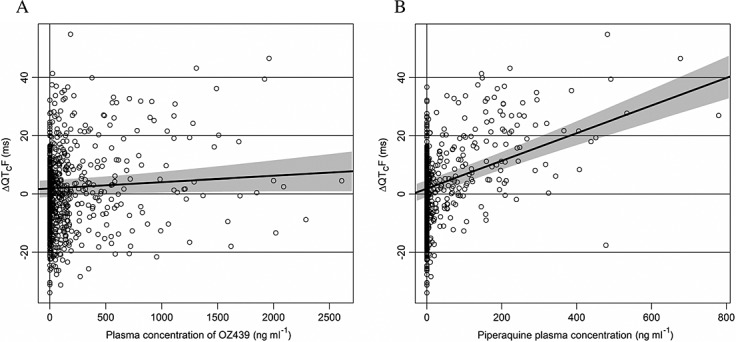
Scatter plot of change from average baseline QTcF (ΔQTcF) vs. concentration of OZ439 (A) and piperaquine (B). The black lines are the predicted effect with ER analysis on ΔΔQTcF with 90% confidence intervals. These regression lines are derived from the primary model setting the effect of time and of the other drug (piperaquine for (A) and OZ for (B)) to zero. Therefore this regression lines do not necessarily go through the centre of the respective scatter plot
The model predicted QT effects of monotherapy and combinations of OZ439 and PQP for treatments in this study are given in Table3. Although neither the offset nor the slope for OZ439 was statistically significant, the predicted QT effect at the mean Cmax seen in period 1 in the 800 mg group (1498 ng ml−1, six subjects) was significant with a mean effect of 5.1 ms (90% CI 0.8, 9.4).
Exposure–response analysis: Observed plasma Cmax levels and predicted effects on ΔQTcF for various dosing regimens
| Treatment | Drug concentrations Mean (ng ml−1) | QTcF prediction (ms) | |||
|---|---|---|---|---|---|
| OZ439 | Piperaquine | Estimate | 90% confidence interval | ||
| Lower | Upper | ||||
| Predicted QT effect at observed Cmax* in current study | |||||
| OZ439 800 mg only (period 1) | 1478 | 0 | 5.1 | 0.8 | 9.4 |
| PQP 1440 mg only | 0 | 337 | 17.9 | 14.2 | 21.6 |
| OZ439 800 mg as PIB + 1440 mg PQP (period 2) | 1504‡ | 356 | 22.1 | 17.7 | 26.4 |
| Predicted QT effect at Cmax† values for the anticipated clinically effective single dose regimens in patients | |||||
| Single dose PQP 960 mg | 0 | 188 | 10.8 | 7.9 | 13.8 |
| Single dose PQP 1440 mg | 0 | 281 | 15.2 | 11.9 | 18.6 |
| Single dose OZ439 800 mg + 960 mg PQP | 1423 | 188 | 13.9 | 10.0 | 17.8 |
| Single dose OZ439 800 mg + 1440 mg PQP | 1423 | 281 | 18.3 | 14.3 | 22.3 |
geometric mean.
predicted median value.
observed mean plasma concentration of OZ439 at tmax of piperaquine.
Table3 also gives the model predicted QT effect of the single dose regimens being tested in clinical trials, 800 mg OZ439 concomitantly with either 960 mg or 1440 mg PQP. For a single dose of 960 and 1440 mg PQP the projected mean Cmax values were 188 and 281 ng ml−1, respectively. For the 800 mg OZ439 the projected mean Cmax was 1423 ng ml−1. In reality, the Cmax values of the two drugs will not be reached at the same time and the predictions taking into account the Cmax of both drugs therefore represent a worst case scenario. Using the ER model that accounts for plasma concentrations of both piperaquine and OZ439 and projected peak plasma concentrations of both drugs, a mean placebo-corrected ΔQTcF of 14 ms (90% CI 10, 18 ms) and 18 ms (90% CI 14, 22 ms) can be predicted for the anticipated clinically effective single dose combinations of 960 mg and 1440 mg PQP with 800 mg OZ439, respectively.
Discussion
Piperaquine in combination with DHA is approved in the EU and in other countries. One tablet contains 320 mg PQP and 40 mg DHA. In Europe, Eurartesim® (DHA-PQP) is indicated for the treatment of uncomplicated falciparum malaria in adults, children and infants 6 months and over and weighing 5 kg or more 8,18. The recommended dose is weight-adjusted with three tablets daily (960 mg PQP) for an adult 36 to75 kg body weight and four tablets daily (1280 mg PQP) for an adult > 75 kg for 3 days. There is a substantial accumulation of piperaquine on multiple dosing with an up to three-fold increase of Cmax from day 1 to day 3. There is also a food effect and dosing with meals or milk increases both AUC and Cmax concentrations and administration in the fasted state is recommended 18. In addition, piperaquine is a substrate for CYP3A4 and if dosed with a potent 3A4 inhibitor, the plasma concentrations may increase several-fold.
The QTc prolonging property of piperaquine is described and well quantified from studies with DHA-PQP 8,18,19. In a thorough QT study, the QT effect of DHA-PQP was evaluated in healthy subjects and compared with the effect of artemether/lumefantrine. DHA-PQP was dosed weight-adjusted (three or four tablets) for 3 days with either a high fat/low calorie meal (group 1, 64 subjects), a high fat/high calorie meal (group 4, 40 subjects) or in the fasted state (group 5, 40 subjects) 18. On day 3, piperaquine peak plasma concentrations were higher in subjects dosed with food with mean Cmax approximately 1200 ng ml−1 in group 4 and approximately 800 ng ml−1 in group 1 as compared with ∼400 ng ml−1 in the fasted state (group 5). DHA-PQP caused QTc prolongation. On day 3, the largest by time point observed mean placebo-adjusted ΔQTcF was 45 ms, 36 ms and 21 ms in groups 4, 5 and 1, respectively. In the two pivotal trials with DHA + PQP, ECGs were recorded before the third dose on day 2, i.e. did not capture the effect at peak plasma concentrations, and the mean ΔQTcF (not placebo-corrected) was somewhat lower: 22.9 ms (90% CI 21.3, 24.6; n = 752) and 23.6 ms (90% CI 22.1, 25.2; n = 1013) and somewhat higher than in patients on artemether-lumefantrine (17.3 ms, 90% CI 15.1, 19.5; n = 501) or on mefloquine + artesunate (14.7 ms, 90% CI 12.2, 17.1; n = 370) 18. However, in two more recent and yet unpublished observational/phase IV patient studies (INESS and WANECAM), ECGs were recorded at baseline and at the projected piperaquine tmax and the effect was larger: ΔQTcF of approximately 30 ms (data on file, MMV). A substantially larger effect than in the pivotal trials was also observed in a recently published, prematurely halted clinical trial in Cambodia in which a mean placebo-adjusted ΔQTcF of 46 ms was seen at peak plasma concentrations after 2 days of dosing with DHA-PQP 180/1440 mg 20.
These findings were confirmed and further quantified in this study in healthy subjects, in which a statistically significant relationship between piperaquine plasma concentration and placebo-adjusted ΔQTcF was demonstrated with a slope of 0.047 ms per ng ml−1 (90% CI 0.038, 0.057), i.e. approximately 5 ms for every 100 ng ml−1 of increase in piperaquine plasma concentration. With this as a background, it seems prudent to develop any new ACTs with piperaquine in a way that avoids very high plasma concentrations, while maintaining anti-malarial efficacy. The single dose combinations of OZ439-PQP, which are currently evaluated in malaria patients (800 mg OZ439 with 640 mg, 960 mg or 1440 PQP) were selected based on predicted efficacy as well as safety and tolerability. A single 800 mg dose of OZ439 results in plasma concentrations above the estimated minimum parasiticidal concentration for over 7 days on average, compared with an estimated time above minimum parasiticidal concentration of approximately 1 day for the three dose DHA regimen of DHA-PQP. Preliminary PK/PD analyses suggest that a single dose treatment with 800 mg OZ439 and 960 or 1440 mg PQP will result in a profound decline in parasitaemia and may achieve the target clinical efficacy of over 95% cure rate at day 28. Using a published population PK model 17, median peak piperaquine plasma concentrations with this new single dose combination administered in the fasted state can be estimated to 188 ng ml−1 with 960 mg PQP and 281 ng ml−1 with 1440 mg PQP, i.e. substantially lower than after 3 days of dosing with PQP 960 mg (∼400 ng ml−1). With the ER model that accounts for plasma concentrations of both PQP and OZ439, a largest mean placebo-corrected ΔQTcF of 14 ms (90% CI 10, 18 ms) and 18 ms (90% CI 14, 22 ms) can be predicted at these plasma concentrations, and it seems likely that the QT effect will be lower than the observed mean peak effect of > 30 ms after 3 days of treatment with DHA-PQP. It can therefore be concluded that patients treated with the single dose combination of OZ439-PQP will be at lower risk of developing pronounced QT prolongation than patients treated with DHA-PQP. Obviously, these predictions, both on efficacy and the level of QTc prolongation, must be confirmed in clinical trials, which are on-going and incorporate serial ECG monitoring. In this context, it is also worth pointing out that pro-arrhythmias with DHA-PQP seem extremely rare 19, an observation that was confirmed in a recent Cochrane report, which evaluated the effectiveness and safety of DHA-PQP compared with other WHO recommended ACT in the treatment of uncomplicated Plasmodium falciparum malaria in 27 trials conducted in a total of 16 382 adults and children 21. In malaria-infected patients, a contributing factor that could result in a reduced liability for pro-arrhythmic events is the elevated heart rate associated with fever, which is uniformly observed before initiation of treatment in malaria patients. As an example, the mean reduction of heart rate from baseline to day 3 in the INESS and WANECAM studies ranged between 17 and 27 beats min−1 across treatments (data on file, MMV). This means that the peak plasma concentration of piperaquine after a single dose of OZ439-PQP will occur before fever subsides and while heart rates in most patients are elevated. As the majority of drug-induced events of torsades de pointes are triggered by preceding bradycardia 22–24, an elevated heart rate due to fever at the time of maximal QTc prolongation may in fact serve as a protection against cardiac arrhythmias. Even so, it is obviously of great importance to identify risk factors in patients and, as an example, avoid or delay dosing of patients with suspected electrolyte disturbances due to prolonged diarrhoea, or on concomitant medication with drugs that possess a QT effect.
Small clinical pharmacology studies are not powered to evaluate a potential QT effect by time point, as required by the ICH E14 for definitive QT assessment 25,26. To exclude a QTc effect exceeding 10 ms at each post-dosing time point, a substantially larger study is needed. We have therefore focused on ER analysis of the QT effect, which provides a better estimation of potential QT effects in small studies 27,28. There are also limitations with this approach. In ER analysis with more than one analyte the effect of either drug cannot easily be differentiated from that of the other if the time course of plasma concentrations is similar. In the analysis, this issue seems manageable, since data on OZ439 monotherapy were also available and included in the model in addition to data on placebo. Moreover, the three doses of PQP combined with the lowest dose of OZ439 investigated in this study strengthen the analysis and should safeguard against confounding of the effects of the two drugs.
In conclusion, a single dose regimen combining 800 mg OZ439 with 960 mg or 1440 mg PQP is expected to result in lower peak piperaquine plasma concentrations compared with the available 3 day PQP-artemisinin combinations and can be predicted to cause less QTc prolongation.
Competing Interests
All authors have completed the Unified Competing Interest form at www.icmje.org/coi_disclosure.pdf (available on request from the corresponding author) and declare FM and SD had no support from any organization for the submitted work. BD, GF, BT and ST report personal fees from Medicines for Malaria Venture during the conduct of the study. PS is currently a member of the External Scientific Advisory Board for Medicines for Malaria. BT reports personal fees from Medicines for Malaria Venture outside the submitted work.
References
- World Health Organization. 2013. Geneva, Switzerland WHO World malaria report.
- Argiun PM, Tan KR. Malaria. In: Brunette GW, editor. Travelers Health. Atlanta, GA, USA: Center for Disease Control and Prevention; 2014. [Google Scholar]
- Breslin TM, Ionmhain UN, Bergin C, Gallagher D, Collins N, Kinsella N, McMahon G. Malarial cases presenting to a European urban Emergency Department. Eur J Emerg Med. 2013;20:115–9. doi: 10.1097/MEJ.0b013e328352d335. [DOI] [PubMed] [Google Scholar]
- Witkowski B, Khim N, Chim P, Kim S, Ke S, Kloeung N, Chy S, Duong S, Leang R, Ringwald P, Dondorp AM, Tripura R, Benoit-Vical F, Berry A, Gorgette O, Ariey F, Barale JC, Mercereau-Puijalon O, Menard D. Reduced artemisinin susceptibility of Plasmodium falciparum ring stages in western Cambodia. Antimicrob Agents Chemother. 2013;57:914–23. doi: 10.1128/AAC.01868-12. [DOI] [PMC free article] [PubMed] [Google Scholar]
- Dondorp AM, Ringwald P. Artemisinin resistance is a clear and present danger. Trends Parasitol. 2013;29:359–60. doi: 10.1016/j.pt.2013.05.005. [DOI] [PubMed] [Google Scholar]
- Mzayek F, Deng H, Mather FJ, Wasilevich EC, Liu H, Hadi CM, Chansolme DH, Murphy HA, Melek BH, Tenaglia AN, Mushatt DM, Dreisbach AW, Lertora JJ, Krogstad DJ. Randomized dose-ranging controlled trial of AQ-13, a candidate antimalarial, and chloroquine in healthy volunteers. PLoS Clin Trials. 2007;2 doi: 10.1371/journal.pctr.0020006. : e6. [DOI] [PMC free article] [PubMed] [Google Scholar]
- White NJ. Cardiotoxicity of antimalarial drugs. Lancet Infect Dis. 2007;7:549–58. doi: 10.1016/S1473-3099(07)70187-1. [DOI] [PubMed] [Google Scholar]
- Eurartesim. 2011. EU Summary of Product Characteristics [Online].. Available at http://www.ema.europa.eu/docs/en_GB/document_library/EPAR_-_Product_Information/human/001199/WC500118113.pdf (last accessed 8 June 2015)
- Sanchez-Chapula JA, Salinas-Stefanon E, Torres-Jacome J, Benavides-Haro DE, Navarro-Polanco RA. Blockade of currents by the antimalarial drug chloroquine in feline ventricular myocytes. J Pharmacol Exp Ther. 2001;297:437–45. [PubMed] [Google Scholar]
- Borsini F, Crumb W, Pace S, Ubben D, Wible B, Yan GX, Funck-Brentano C. In vitro cardiovascular effects of dihydroartemisin-piperaquine combination compared with other antimalarials. Antimicrob Agents Chemother. 2012;56:3261–70. doi: 10.1128/AAC.05688-11. [DOI] [PMC free article] [PubMed] [Google Scholar]
- Liu T, Brown BS, Wu Y, Antzelevitch C, Kowey PR, Yan GX. Blinded validation of the isolated arterially perfused rabbit ventricular wedge in preclinical assessment of drug-induced proarrhythmias. Heart Rhythm. 2006;3:948–56. doi: 10.1016/j.hrthm.2006.04.021. [DOI] [PMC free article] [PubMed] [Google Scholar]
- Redfern WS, Carlsson L, Davis AS, Lynch WG, MacKenzie I, Palethorpe S, Siegl PK, Strang I, Sullivan AT, Wallis R, Camm AJ, Hammond TG. Relationships between preclinical cardiac electrophysiology, clinical QT interval prolongation and torsade de pointes for a broad range of drugs: evidence for a provisional safety margin in drug development. Cardiovasc Res. 2003;58:32–45. doi: 10.1016/s0008-6363(02)00846-5. [DOI] [PubMed] [Google Scholar]
- Zhu H, Wang Y, Gobburu JV, Garnett CE. Considerations for clinical trial design and data analyses of thorough QT studies using drug-drug interaction. J Clin Pharmacol. 2010;50:1106–11. doi: 10.1177/0091270009358710. [DOI] [PubMed] [Google Scholar]
- Darpo B, Sarapa N, Garnett C, Benson C, Dota C, Ferber G, Jarugula V, Johannesen L, Keirns J, Krudys K, Ortemann-Renon C, Riley S, Rogers-Subramaniam D, Stockbridge N. The IQ-CSRC prospective clinical Phase 1 study: "Can early QT assessment using exposure response analysis replace the thorough QT study?". Ann Noninvasive Electrocardiol. 2014;19:70–81. doi: 10.1111/anec.12128. [DOI] [PMC free article] [PubMed] [Google Scholar]
- Darpo B, Benson C, Dota C, Ferber G, Garnett CE, Green CL, Jarugula V, Johannesen L, Keirns J, Krudys K, Liu K, Ortemann-Renon C, Riley S, Sarapa N, Smith B, Stolz R, Zhou M, Stockbridge N. Results from the IQ-CSRC prospective study support replacement of the thorough QT study by QT assessment in the early clinical phase. Clin Pharmacol Ther. 2015;97:326–35. doi: 10.1002/cpt.60. . DOI: 10.1002/cpt.60. [DOI] [PubMed] [Google Scholar]
- Fridericia LS. Die Systolendauer im Elektrokardiogramm bei normalen Menchen und bei Herzkranken. Acta Med Scand. 1920;53:469–86. [Google Scholar]
- Tarning J, Rijken MJ, McGready R, Phyo AP, Hanpithakpong W, Day NP, White NJ, Nosten F, Lindegardh N. Population pharmacokinetics of dihydroartemisinin and piperaquine in pregnant and nonpregnant women with uncomplicated malaria. Antimicrob Agents Chemother. 2012;56:1997–2007. doi: 10.1128/AAC.05756-11. [DOI] [PMC free article] [PubMed] [Google Scholar]
- Eurartesim. 2011. Assessment report EMA/739355/2011. Committee for Medicinal Products for Human Use (CHMP) [Online].. Available at http://www.ema.europa.eu/docs/en_GB/document_library/EPAR_-_Public_assessment_report/human/001199/WC500118116.pdf (last accessed 8 June 2015)
- Keating GM. Dihydroartemisinin/Piperaquine: a review of its use in the treatment of uncomplicated Plasmodium falciparum malaria. Drugs. 2012;72:937–61. doi: 10.2165/11203910-000000000-00000. [DOI] [PubMed] [Google Scholar]
- Manning J, Vanachayangkul P, Lon C, Spring M, So M, Sea D, Se Y, Somethy S, Phann ST, Chann S, Sriwichai S, Buathong N, Kuntawunginn W, Mitprasat M, Siripokasupkul R, Teja-Isavadharm P, Soh E, Timmermans A, Lanteri C, Kaewkungwal J, Auayporn M, Tang D, Chour CM, Prom S, Haigney M, Cantilena L, Saunders D. Randomized, double-blind, placebo-controlled clinical trial of a two-day regimen of dihydroartemisinin-piperaquine for malaria prevention halted for concern over prolonged corrected QT interval. Antimicrob Agents Chemother. 2014;58:6056–67. doi: 10.1128/AAC.02667-14. [DOI] [PMC free article] [PubMed] [Google Scholar]
- Zani B, Gathu M, Donegan S, Olliaro PL, Sinclair D. Dihydroartemisinin-piperaquine for treating uncomplicated Plasmodium falciparum malaria. Cochrane Database Syst Rev. 2014 doi: 10.1002/14651858.CD010927. ; CD010927. DOI: 10.1002/14651858.CD010927. [DOI] [PMC free article] [PubMed] [Google Scholar]
- Bednar MM, Harrigan EP, Ruskin JN. Torsades de pointes associated with nonantiarrhythmic drugs and observations on gender and QTc. Am J Cardiol. 2002;89:1316–9. doi: 10.1016/s0002-9149(02)02337-8. [DOI] [PubMed] [Google Scholar]
- Da CA, Chalvidan T, Belounas A, Messier M, Viallet M, Mansour H, Lamaison D, Djiane P, Isaaz K. Predictive factors of ventricular fibrillation triggered by pause-dependent torsades de pointes associated with acquired long QT interval: role of QT dispersion and left ventricular function. J Cardiovasc Electrophysiol. 2000;11:990–7. doi: 10.1111/j.1540-8167.2000.tb00171.x. [DOI] [PubMed] [Google Scholar]
- Darpo B. Spectrum of drugs prolonging the QT interval and the incidence of torsades de pointes. Eur Heart J. 2001;3:70–80. [Google Scholar]
- ICH E14 Questions & Answers. 2014. [Online].. Available at http://www.ich.org/fileadmin/Public_Web_Site/ICH_Products/Guidelines/Efficacy/E14/E14_QAs_R2_Step4.pdf (last accessed 8 June 2015)
- ICH Harmonized Tripartite Guideline E14. 2005. The Clinical Evaluation of QT/QTc Interval Prolongation and Proarrhythmic Potential for Non-Antiarrhythmic Drugs [Online].. Available at http://www.ich.org/fileadmin/Public_Web_Site/ICH_Products/Guidelines/Efficacy/E14/E14_Guideline.pdf (last accessed 8 June 2015)
- Darpo B, Garnett C. Early QT assessment - how can our confidence in the data be improved? Br J Clin Pharmacol. 2012;76:642–8. doi: 10.1111/bcp.12068. [DOI] [PMC free article] [PubMed] [Google Scholar]
- Ferber G, Zhou M, Darpo B. Detection of QTc Effects in small studies - Implications for replacing the thorough QT study. Ann Noninvasive Electrocardiol. 2014 doi: 10.1111/anec.12227. ; Nov 4. DOI: 10.1111/anec.12227. [Epub ahead of print] [DOI] [PMC free article] [PubMed] [Google Scholar]