

Abstract
We describe the moving wire interface attached to the 1-MV AMS system at LLNL’s Center for Accelerator Mass Spectrometry for the analysis of nonvolatile liquid samples as either discrete drops or from the direct output of biochemical separatory instrumentation, such as high-performance liquid chromatography. Discrete samples containing at least a few 10s of nanograms of carbon and as little as 50 zmol 14C can be measured with a 3–5% precision in a few minutes. The dynamic range of our system spans approximately 3 orders in magnitude. Sample to sample memory is minimized by the use of fresh targets for each discrete sample or by minimizing the amount of carbon present in a peak generated by an HPLC containing a significant amount of 14C. Liquid Sample AMS provides a new technology to expand our biomedical AMS program by enabling the capability to measure low-level biochemicals in extremely small samples that would otherwise be inaccessible.
Keywords: accelerator mass spectrometry, CO2, HPLC interfaces, 14C
INTRODUCTION
Currently, most biochemical samples for 14C-AMS analysis at LLNL are converted to graphite through a multistep, time-consuming and labor-intensive process [1]. This procedure necessitates significant human handling, reduces sensitivity and suffers from long turnaround times. A solution to these limitations is to combust and directly analyze the samples as CO2, thus eliminating the need to reduce the samples to graphite. We have developed an on-line combustion interface, coupled to our CO2 gas-accepting ion source attached to our 1-MV BioAMS spectrometer, to enable the direct analysis of nonvolatile carbonaceous samples [2, 3]. Our interface is based on the moving wire technique and allows for both the analysis of discrete small samples, as well as for continuous flow applications to directly measure the output of a coupled high-performance liquid chromatography (HPLC) instrument in real time [4].
DESCRIPTION
Our moving wire interface is based on the designs that have been developed for use with stable-isotope IRMS systems and provides for the direct analysis of nonvolatile components from either discrete microliter-sized droplets or from the continuous output of an HPLC [5–8]. Fig. 1 shows a photo of our moving wire interface. Liquid samples, either as discrete drops from a pipet or as a coherent jet from the output of the HPLC are deposited onto a moving nickel wire. The wire is then pulled through a drying oven to remove the solvent before entering a high-temperature combustion reactor where the carbon content of the sample is oxidized to CO2. A helium gas stream is used to carry the combustion products to the spectrometer for carbon isotope analysis. Our AMS data acquisition system is configured to sum, over 1 second intervals, the charge from 12C−, collected in an off-axis Faraday cup, and the number of 14C ions, collected in a solid state detector.
Fig. 1.

Photo of our moving wire interface. Items in the photo are labeled as follows: (1) nickel wire; (2) cleaning, (3) drying, and (4) combustion ovens; (5) sample-depositing emitter tip from a (6) HPLC; (7) control panel; and (8) an AMS gas-accepting ion source.
The direct coupling of an HPLC to the interface requires that fluid placed on the moving wire remain at a fixed position on the wire to maintain chromatographic resolution. If allowed to mix and combine, the weight of sufficient fluid in a single droplet could also cause it to fall from the wire or prevent its complete evaporation. These issues are especially pronounced in fluids that bind weakly to the wire relative to their density, such as methanol or acetonitrile (common HPLC mobile phases). By introducing indentations to the wire at regular intervals, these issues can be mitigated [3]. The increased surface area at an indent creates a trap, which collects fluid into a droplet. A computer-controlled solenoid is used to drive a wedge with a frequency that is driven by the speed of the wire. Typically, each indentation is approximately 2 mm long with a depth about halfway into the thickness of the wire (which is 0.25 mm) and is spaced at intervals of every 6 mm along the length of the wire.
The drying oven is held at a temperature that depends on solvent or buffer volatility and is between 90°C and 120°C to evaporate the liquid solvent or buffer. A continuous flow of pre-heated helium is injected at the center of the drying oven and collected at either end by pulling it through a condenser with an air-sampling pump. Helium increases the oven’s drying capacity over atmospheric air because of its high thermal conductivity. Complete collection of the drying gas prevents the escape of semi-volatile biological or isotopically enriched material into the room.
The complete oxidation of the dried sample is accomplished by combusting the sample at •750°C in a 97.6%:2.4% He:O2 atmosphere. We have found this O2 concentration to be sufficient to enable complete oxidation of the dried material while minimizing the decrease in 12C− ion yield that is observed as additional O2 is added. With its larger electron affinity, the excess oxygen effectively competes with carbon for electrons in the negative ion source. In addition, O2 is more rapidly gettered by the titanium and thus may also be inhibiting the gettering of CO2 [9], which is a necessary step in the ionization process. A length of CuO wire, from 15 cm × 0.4 mm o.d. copper wire, which has been oxidized in place, in the oven, also aids in the combustion. The inner diameter of the combustion oven is 0.8 mm and is kept small to minimize the sweep volume and time and thus limit peak broadening.
The combustion oven requires openings at each end to allow the wire to pass through. To prevent the escape of gaseous combustion products through these openings, we employ a method similar to that described earlier [10]. The carrier gas mixture, with a total flow of 10.25 ml/min, is injected through ports near both the wire entrance and exit. Pressures are balanced by connecting the leading and lagging ports with 0.5 mm i.d. tubing. By equalizing pressure at the ports, there should be no net flow between them. In this way, the gaseous combustion products are directed to the exit capillary. Restrictions between the ports and openings, combined with the positive pressure from the carrier gas, prevent atmosphere from entering the oven. A third restriction between the exit capillary and lagging port prevents the dilution of the combustion products.
Finally, a fused silica capillary with 180 μm inner diameter × 5.3 m length was used to transport combustion products to the ion source; space limitations within the laboratory restricted our ability to use a shorter capillary. The i.d. of the capillary was chosen such that an acceptable vacuum pressure in the AMS ion source while flowing in gas was maintained, which, in our system is any pressure below 2×10⁻⁶ Torr. This was achieved by the use of extensive vacuum pumping in the ion source region. On the ion source body, we use a 300 l/s turbomolecular pump; a 520 l/s turbomolecular pump is attached to the NEC ion source valve body and two additional 700 l/s turbomolecular pumps are positioned just downstream of the ion source region.
The larger the inner diameter, the faster the gas flow which also increases the amount of helium which must then be sufficiently removed to limit ion yield losses to neutral ion scattering. However, a larger inner diameter will narrow the peak shape of the CO2 pulse, greatly improving the signal to noise of the measured carbon ions. This is illustrated in Fig. 2. Both curves represent the measured 12C− ion current after a 1 μl drop of an aqueous glucose solution containing 500 ng carbon was deposited and combusted, with the products transported to the AMS ion source in a 5.3 meter long by either 180 μm i.d. (black curve) or 150 μm i.d. (dashed curve) fused silica capillary. We estimate that the gas flow to the ion source is 700 μl/min and 350 μl/min for the 180 μm i.d. and 150 μm i.d. capillary, respectively. With the larger gas flow in the larger i.d. capillary, the CO2 pulse is narrower and has a larger peak height relative to the background 12C− signal.
Fig. 2.

Measured 12C− ion traces from 1 μl aqueous glucose samples containing 500 ng carbon transported to the ion source via either a 180 μm i.d. (solid line) or 150 μm i.d. (dashed line) × 5.3m long fused silica capillary. The measured peak parameters are also presented as full width at half maximum (FWHM), the time to go from baseline to peak (Risetime), and the ratio of integrated 12C signal with respect to background (S/N).
The observed difference in peak shape between the two capillaries is most likely due to differences in the sweep time in the combustion oven and transit time to the ion source. For the 180 μm i.d. capillary, we calculate an approximate 6 second sweep time in the combustion oven with a 17 second transit time while it is approximately 12 and 27 seconds, respectively, when using the 150 μm i.d. capillary. The narrower peak shape helps to preserve the time resolution of the HPLC separation and affords more reliable quantitation as peaks containing very small amounts of carbon are introduced to the ion source. A summary of the two peak shapes is also presented in Fig. 2.
OPERATION
Interface parameters have been optimized to maximize signal to noise. However, it is a very tightly coupled system. Beneficial changes to one parameter can lead to an opposite detrimental effect on system performance. This is perhaps best illustrated by the drying oven. We have observed the potentially largest source of sample loss in the moving wire system to result from the sample drying process. At a minimum, the drying oven must evaporate the solvent and, ideally, it would do this without affecting the analyte of interest. However, changes to parameters to improve sample drying can have unintended negative consequences to overall system performance. Table 1 lists the effects on performance when changes are made to the system to improve sample drying. Reducing the drop volume while maintaining the sample concentration could allow for the reduction of the oven temperature. However, in practice, we have found it very difficult to accurately and reliably manually place drops significantly smaller than 1 μl onto the moving wire using a disposable pipet tip.
Table 1.
Moving wire system parameters that affect sample drying and their effects on system performance.
| Drying Parameter Change | Effect on System Performance |
|---|---|
| Decrease drop volume | Decreased 14C and 12C signals |
| Decrease wire speed | Decrease in peak signal to noise |
| Increase oven temperature | Increased loss of semivolatile components |
| Increase oven length | Increased wire vibration (potential sample loss) |
For discrete drop analysis, wire speed is set to 2.5 cm/sec, which balances the droplet volume with the drying oven temperature. For directly-coupled HPLC-AMS analysis, we can run the wire much faster, at 6 cm/sec. Here, we balance the liquid loading onto the wire from the coherent jet (faster wire speed means an increase in HPLC solvent flow rate), with the residence time of that liquid in the drying oven (faster wire speed, means less time in the drying oven, which leads to less liquid that can be loaded onto the wire). In principle, the length of the drying oven could be increased, or multiple ovens could be placed in series to increase the drying capabilities of the system. However, in practice, this is much harder to achieve. In addition to the length of the moving wire table increasing linearly with drying oven length, the distance between wire support pulleys will also increase, as there can be nothing touching the wire between the point in which the sample is deposited onto it and the point in which it is combusted off. The longer the distance between supports, the more susceptible the wire is to vibrations, which can lead to, drops falling off and subsequent loss of sample.
Decreasing the wire speed allows for a longer time in the drying oven, enabling a lower drying temperature which can limit the potential loss of semi-volatile material. However, this can result in a decrease in the signal to noise ratio of the measured sample, leading to a loss in sensitivity. This is illustrated in Fig. 3 in which we plot 12C− recorded from 1 μl drops of aqueous solutions of either sucrose or caffeine, containing 0.4 μg carbon, with respect to wire speed. For this experiment, the drying oven temperature was held constant and the drop was placed onto the wire and allowed to dry. The wire control motor was then set to the desired speed and the sample entered the combustion oven. Decreasing the wire speed from 4 cm/sec to 1 cm/sec resulted in the full width at half maximum (FWHM) of the measured 12C ion peak of an aqueous sugar sample to increase by a factor of 1.4. For the caffeine sample, the results are even more dramatic as the FWHM increased by more than a factor of 2. For both sample types, an increase in the FWHM leads to a corresponding decrease in the signal to noise ratio, leading to a decrease in sensitivity and peak resolution.
Fig. 3.

Measured full width half maximum (FWHM) from 12C− peaks from 1 μl drops of aqueous solutions of either caffeine or sucrose containing 0.4 μg carbon with respect to wire speed as the sample moves through the combustion furnace.
DYNAMIC RANGE
The dynamic range of 14C and 12C contents in the sample for routine analysis using our present LS-AMS system is presented in Table 2. These limits are all constrained by performance of the ion source and AMS system; the moving wire interface has a much larger dynamic range [3]. The minimum amount of 50 zmol of 14C in a sample is to obtain a measurement precision of 5% based on counting statistics. This lower limit can decrease if a lower precision can be tolerated (or, conversely, increase if a higher precision is required). The upper limit of 14C quantitation is based on the data acquisition dead time in the counting electronics. As the count rate in the detector increases, we must apply corrections which become less reliable as the dead time increases. The 50 amol of 14C upper limit results in a peak count rate in the detector of approximately 25 kHz with a data acquisition dead time of close to 25%.
Table 2.
14C and 12C dynamic ranges for our present LS-AMS system.
| lower limit | upper limit | |
|---|---|---|
| 14C | 50 zmol (5% precision) | 50 amol |
| 12C | 10 ng | 1000 ng |
The lower limit in 12C content is based on obtaining a quantifiable peak above the background ion current. We observe typical baseline ion currents of a couple hundred nanoAmps when the system is being operated under normal conditions. This background current comes from the small amount of carbon present in the nickel wire and from the small amount of carbon present in the titanium insert in our gas targets. We can detect peaks containing less carbon, however, the uncertainty in our calculated background rises to unacceptable levels. The upper limit of 12C quantitation arises from saturation effects in the ion source for samples containing more than 1 μg carbon. The ionization process of CO2 in a cesium sputter ion source involves an adsorption step onto the titanium surface [11]. For large pulses of CO2, the Ti surface becomes saturated and any additional CO2 enters the ion source vacuum region as a neutral gas and is not adsorbed onto the titanium. Additionally, we observe a temporary decrease in source vacuum before it is pumped away. This spike in ion source pressure may lead to a temporary decrease in ionization efficiency. Both of these effects result in a dip in the measured ion signals near its peak.
The dynamic range of our LS-AMS capability spans approximately three orders in magnitude with a minimum sensitivity of 0.5 modern in samples containing 1 μg carbon. In contrast, routine analysis of biochemical samples as solid graphite for 14C-AMS ranges from approximately 0.1 modern to 500 modern. However, our routine solid sample preparation requires a minimum of 0.5 mg carbon with a maximum amount of 10 mg carbon [1]. In a mg-sized sample, the lower limit of quantitation for solid graphite samples is approximately 10 amol 14C with the upper limit of approximately 50,000 amol, which is driven by saturation in the detector counting electronics. Although in terms of 14C/C isotope ratios, solid samples offer greater sensitivity, the clear advantage for LS-AMS over solid graphite is the smaller sample size and greater 14C sensitivity, enabling the use of lower 14C and chemical doses.
SAMPLE TO SAMPLE CARRYOVER (MEMORY) IN THE SYSTEM
One issue regarding the use of gas-accepting ion sources is the concern over sample-to-sample carryover (termed “memory”). The effect of memory is illustrated in Fig. 4, which shows 14C and 12C traces from a series of 1 μl drops of aqueous sugar solutions, each containing 500 ng carbon. The peaks labeled with an asterisk (*) are from drops of ANU sucrose. The second peak is from a prepared aqueous glucose solution with a carbon isotope ratio of approximately 1000 modern. The first ANU sucrose peak measures to our nominal value of 1.5 modern. However, the peaks following the 1000 modern sample all measure high with carbon isotope ratios of 4.7, 2.7 and 2.3 modern, even after careful background subtraction. A 1000 modern sample of 500 ng carbon contains approximately 50 amol 14C. We do not observe as strong of a memory effect for a 100 modern sample containing approximately 5 amol 14C, indicating that memory is present, to some extent, at all isotopic concentrations.
Fig. 4.
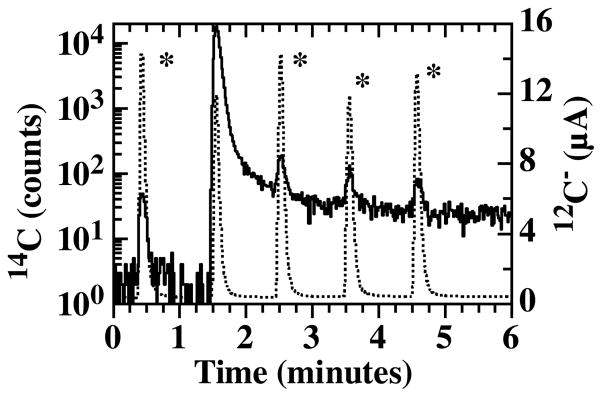
LS-AMS trace of 14C counts (solid) and 12C ion current (dotted) of discrete 1 μl drops of aqueous sugar solutions containing 500 ng carbon. Peaks marked with an asterisk (*) are from ANU sucrose solutions. Tailing in the 14C signal is evident following the 1000 modern sample.
We have determined that the source of this memory resides in the front surface of the titanium insert where the absorbed CO2 is ionized by the cesium sputter beam. A foam-like structure consisting of carbon, titanium and cesium has been observed after cesium sputtering of CO2 on titanium [12]. In addition, at these temperatures, titanium carbide is also likely formed [13]. Both of these materials could plausibly be the source of memory in the target. When we switch to a fresh target, the 14C background immediately drops to our typical background levels. We have also modified target designs to minimize the dead volumes in the target and gas transport system, as well as reduce the surface area of titanium not exposed to the Cs+ beam. All of these modifications have not changed the shape or relative magnitude of the observed tailing.
This issue can be addressed for the analysis of discrete individual samples by the use of a fresh target for each sample. Also, prior to the analysis of a series of discrete samples, we can obtain a preliminary assessment of the 14C/12C isotope ratio by measuring a single drop from each sample. We can then group samples of similar isotope ratio together and analyze groups in order of increasing isotope ratio. This preliminary assessment also allows us to determine the approximate carbon content in each sample and, if necessary, the sample can be either diluted or concentrated.
However, for continuous flow applications, such as directly coupled HPLC-AMS analysis, sample memory is much more complicated. Tailing from highly elevated peaks can result in an overestimation of the 14C content from subsequent peaks. However, sample sizes from an HPLC peak will be many orders in magnitude smaller than the samples measured in Fig. 4. So, while the specific activity of an HPLC peak may be large, the total amount of 14C contained in that peak may be low, in which case, sample memory will not be as significant of a concern.
To test this hypothesis, we measured two representative cases, representing discrete drop analysis and directly-coupled HPLC-AMS analysis. Aqueous samples containing a defined amount of 14C and 12C were prepared from labeled and unlabeled glucose. The 14C and 12C contents were verified by measuring representative aliquots by LSC or AMS for (14C) and elemental carbon analyzer (for 12C). In the discrete drop case, the mass of the two samples are the same, while the amount of 14C in the highly elevated sample (“Sample 2”) is approximately 500 times more than the amount in the 1 modern sample (“Sample 1”). In the HPLC-AMS case, the two samples have neglible carbon mass while the elevated sample contains approximatley 100 times more 14C than the other. The two cases are listed in Table 3.
Table 3.
Two representative cases of high and low levels of 14C and 12C to investigate sample to sample carryover in our LS-AMS system under conditions representing either discrete drop or HPLC-AMS analysis. Sample 1 of the simulated Discrete Drop Case has a 14C/12C approximately equal to unlabeled contemporary material. Also presented is the excess 14C, in amol, measured in Sample 1 at one and two minutes after the measurement of Sample 2 compared to the amount in Sample 1 measured prior to Sample 2.
| “Discrete Drop” Case | “HPLC-AMS” Case | ||||
|---|---|---|---|---|---|
| 12C (ng) | 14C (amol) | F. Mod. | 12C (ng) | 14C (amol) | |
| Sample 1 | 500 | 0.05 | 1 | ~0 | 0.25 |
| Sample 2 | 500 | 25 | 500 | ~0 | 25 |
| Excess 14C in Sample 1 | F. Mod. | Excess 14C in Sample 1 | |
|---|---|---|---|
| after 1 minute | 0.10 ± 0.03 amol | 3.0 ± 0.6 | −0.02 ± 0.04 amol |
| after 2 minutes | 0.03 ± 0.02 amol | 1.6 ± 0.4 | 0.01 ± 0.04 amol |
In each case, a 1 μl drop of Sample 1, containing a low level of 14C, is measured in triplicate on a fresh target. Then a 1 μl drop of Sample 2, which contains a high level of 14C, is measured. This is then followed by further replicates of 1 μl drops of Sample 1 at approximate 1 minute intervals. All drops were placed onto the moving wire using a hand pipettor. Data traces of the two cases are presented in Fig. 5. For the discrete drop case, in which Sample 1 has significant carbon, the average measured carbon isotope ratio of Sample 1 measured before Sample 2 was used to determine the expected amount of 14C that should be measured from Sample 1 following the measurement of Sample 2. This procedure accounts for any differences in the ionization efficiency between different targets or any variation in the actual volume contained in the drop. Data from the HPLC-AMS case, in which the samples did not contain significant carbon, was processed by consideration of the measured and expected 14C counts only.
Fig. 5.

Unnormalized 14C (solid) and 12C (dotted) traces of 1 μl drops of aqueous glucose solutions for the two cases presented in Table 3. In all plots, the 1st, 3rd and 4th peaks are from Sample 1 while the 2nd peak is from Sample 2.
Table III also presents the amount of excess 14C measured in Sample 1 after measurement of Sample 2 compared to the amount of 14C measured in Sample 1 before Sample 2. As expected, the discrete drop case shows evidence of sample memory wherein the measured isotopic ratio of Sample 1 is 3 modern and 1.6 modern after Sample 2 while its measured value was 1 modern prior to deposition of the 500 modern sample. In contrast, the HPLC-AMS case does not show evidence of sample memory. In this case, it is more appropriate to discuss the results in terms of 14C only as there is no measurable 12C from each sample. Here, no excess 14C is observed in Sample 1 following measurement of the highly elevated sample. These results suggest that in cases where HPLC traces do not contain large amounts of carbon, effects due to target memory are not likely to be significant.
FUTURE DIRECTIONS
As reported elsewhere in these proceedings, the 1-MV AMS system at LLNL is being reconfigured for natural abundance 14C analysis [12]. It is anticipated that the moving wire interface described here will remain coupled to this spectrometer and will be used in support of carbon cycle research. We are constructing two more copies of our interface for use with our recently commissioned 250 kV SSAMS for biomedical 14C AMS applications.
Acknowledgments
Work performed at the Research Resource for Biomedical AMS, which is operated at LLNL under the auspices of the U.S. Department of Energy under contract DE-AC52-07NA27344, is supported by the National Institutes of Health (NIH), National Institute of General Medical Sciences (NIGMS), Biomedical Technology Research Resources (BTRR) under grant number 8P41GM103483.
Footnotes
Publisher's Disclaimer: This is a PDF file of an unedited manuscript that has been accepted for publication. As a service to our customers we are providing this early version of the manuscript. The manuscript will undergo copyediting, typesetting, and review of the resulting proof before it is published in its final citable form. Please note that during the production process errors may be discovered which could affect the content, and all legal disclaimers that apply to the journal pertain.
References
- 1.Ognibene TJ, Bench G, Vogel JS, Peaslee GF, Murov S. A high-throughput method for the conversion of CO2 obtained from biochemical samples to graphite in septa-sealed vials for quantification of C-14 via accelerator mass spectrometry. Anal Chem. 2003;75:2192–2196. doi: 10.1021/ac026334j. [DOI] [PubMed] [Google Scholar]
- 2.Ognibene TJ, Salazar GA. Installation of hybrid ion source on the 1-MV LLNL BioAMS spectrometer. Nucl Instrum Meth B. 2013;294:311–314. doi: 10.1016/j.nimb.2011.11.029. [DOI] [PMC free article] [PubMed] [Google Scholar]
- 3.Thomas AT, Ognibene T, Daley P, Turteltaub K, Radousky H, Bench G. Ultrahigh Efficiency Moving Wire Combustion Interface for Online Coupling of High-Performance Liquid Chromatography (HPLC) Anal Chem. 2011;83:9413–9417. doi: 10.1021/ac202013s. [DOI] [PMC free article] [PubMed] [Google Scholar]
- 4.Thomas AT, Stewart BJ, Ognibene TJ, Turteltaub KW, Bench G. Directly Coupled High-Performance Liquid Chromatography-Accelerator Mass Spectrometry Measurement of Chemically Modified Protein and Peptides. Anal Chem. 2013;85:3644–3650. doi: 10.1021/ac303609n. [DOI] [PMC free article] [PubMed] [Google Scholar]
- 5.Brand WA, Dobberstein P. Isotope-Ratio-Monitoring Liquid Chromatography Mass Spectrometry (IRM-LCMS): First Results from a Moving Wire Interface System. Isot Environ Healt S. 1996;32:275–283. doi: 10.1080/10256019608036320. [DOI] [PubMed] [Google Scholar]
- 6.Caimi RJ, Brenna JT. High-Precision Liquid Chromatography-Combustion Isotope Ratio Mass Spectrometry. Anal Chem. 1993;65:3487–3500. doi: 10.1021/ac00071a028. [DOI] [PubMed] [Google Scholar]
- 7.Eek KM, Sessions AL, Lies DP. Carbon-isotopic analysis of microbial cells sorted by flow cytometry. Geobiology. 2007;5:85–95. doi: 10.1111/j.1472-4669.2006.00094.x. [DOI] [PubMed] [Google Scholar]
- 8.Sessions AL, Sylva SP, Hayes JM. Moving-Wire Device for Carbon Isotopic Analyses of Nanogram Quantities of Nonvolatile Organic Carbon. Analytical Chemistry. 2005;77:6519–6527. doi: 10.1021/ac051251z. [DOI] [PubMed] [Google Scholar]
- 9.Stout VL, Gibbons MD. Gettering of Gas by Titanium. J Appl Phys. 1955;26:1488–1492. [Google Scholar]
- 10.Caimi RJ, Brenna JT. High-Sensitivity Liquid-Chromatography Combustion Isotope Ratio Mass-Spectrometry of Fat-Soluble Vitamins. J Mass Spectrom. 1995;30:466–472. [Google Scholar]
- 11.Salazar G, Ognibene T. Design of a secondary ionization target for direct production of a C− beam from CO2 pulses for online AMS. Nucl Instrum Meth B. 2013;294:300–306. doi: 10.1016/j.nimb.2012.03.039. [DOI] [PMC free article] [PubMed] [Google Scholar]
- 12.Ognibene TJ, Haack KW, Bench G, Brown TA, Turteltaub KW. Operation of the “Small” BioAMS Spectrometers at CAMS: Past and Future Prospects. Nucl Instrum Meth B, these proceedings. 2014 doi: 10.1016/j.nimb.2015.05.019. [DOI] [PMC free article] [PubMed] [Google Scholar]