Abstract
Plac1 is a recently identified, X-linked gene whose expression is restricted primarily to cells of trophoblast lineage. It localizes to a chromosomal locus previously implicated in placental growth. We therefore sought to determine if Plac1 is necessary for placental and embryonic development by examining a mutant mouse model. Plac1 ablation resulted in placentomegaly and mild intrauterine growth retardation (IUGR). At E16.5, knockout (KO) and heterozygous (Het) placentae of the Plac1-null allele inherited from the mother (Xm-X) weighed approximately 100% more than wildtype (WT) placentae, whereas the corresponding embryos weighed 7–12% less. Histologically, Plac1 mutants exhibited an expanded spongiotrophoblast layer that invaded the labyrinth. By contrast, Het placentae that inherited the null allele from the father (XXp-) exhibited normal growth and were histologically indistinguishable from WT placentae, consistent with paternal imprinting of Plac1. When examined across gestation, WT and Xm-X placental weights peaked at E16.5 and decreased slightly thereafter. KO placentae (Xm-Xp- and Xm-Y), however, continued to increase in weight after E16.5, consistent with a functional role for the paternal Plac1 allele. Subsequent analysis confirmed that the paternal allele partially escapes complete X-inactivation and thus contributes to placental growth regulation. Additionally, although male Plac1 KO mice can survive, they exhibit decreased viability as a consequence of events occurring late in gestation or shortly after birth. Thus, Plac1 is a paternally imprinted, X-linked gene essential for normal placental and embryonic development.
Keywords: Plac1, Placenta Specific-1, fetal development, placenta, imprinting, X-Chromosome
INTRODUCTION
Plac1 (Placenta-specific 1) is an X-linked gene that maps to Xq26 near the Hprt locus (Cocchia et al, 2000). Both murine and human PLAC1 expression is almost entirely restricted to cells of trophoblast lineage, although low mRNA expression has also been reported in the human testis (Cocchia et al, 2000; Fant et al, 2002; Silva et al, 2007). Independent observations have suggested that this region of the X chromosome contains genetic elements important for fetal and placental development. First, Kushi et al (1998) reported that large chromosomal deletions, ranging from 200 to 700 kb around the mouse Hprt locus, resulted in fetal growth retardation and early death. Second, Zechner et al (1996) reported that offspring resulting from interspecies crosses and backcrosses involving Mus musculus and Mus spretus resulted in either placental hypoplasia or hyperplasia. The resulting phenotype was referred to as interspecific hybrid placental dysplasia (Ihpd). Polymorphic microsatellite markers suggested the responsible genetic elements localized to Xq26, near the Hprt locus (Hemberger et al, 1999). Sequencing of the region surrounding the HPRT locus on the human X-chromosome led to the identification of PLAC1. Murine Plac1 maps to the syntenic locus on the mouse X-chromosome.
According to the latest annotations, there is a paucity of known genes that localize to the Xq26 region of the X-chromosome, including PLAC1, HPRT, GPC-3, PHF6, MGC16121, and CR59647 (Cocchia et al, 2002). To date, only Plac1 has been shown to be relatively placental-specific. Because of its highly restricted tissue expression and chromosomal localization, Plac1 emerged as a likely candidate for involvement in placental development and, perhaps, in the Ihpd phenotype. Evidence consistent with such a regulatory role for Plac1 came from analyses of mouse models of placenta hyperplasia derived by distinct mechanisms. Gene microarray analysis demonstrated that hyperplastic placentae associated with Ihpd exhibited down-regulation of Plac1 (Singh et al, 2004) compared to normal placentae. By contrast, Plac1 overexpression was observed in hyperplastic placentae of mice generated by nuclear transfer (Suemizu et al, 2003).
In humans, PLAC1 mRNA is expressed at relatively constant levels between 22 and 40 weeks gestation whereas murine Plac1 expression declines markedly after day 12.5 of gestation (Fant et al, 2002). The human PLAC1 protein localizes to membranous structures in the apical region of the differentiated villus syncytiotrophoblast, where it associates, in part, with the apical, microvillous brush border membrane (Massabbal et al, 2005, Fant et al, 2007). It contains a putative signal peptide and shares 30% homology with zona pellucida 3, a protein important to sperm-egg interactions. Collectively, these observations suggest PLAC1 is involved in specific protein interactions relevant to an important, yet undefined, role at the maternal-fetal interface. By examining a mutant mouse model, we have begun to examine the role of Plac1 in placental development, and have directly demonstrated that Plac1 is essential for normal placental and embryonic development.
RESULTS
Plac1 deficiency results in placentomegaly and intrauterine growth retardation
Heterozygous (Het) females mated with wildtype (WT) or hemizygous males were initially studied at E16.5, a time when the placenta achieves its maximum weight and is structurally developed. Gross examination demonstrated Het placentae inheriting the Plac1 mutation from the mother (Xm-X) were approximately twice as large as WT placentae whereas the embryos were approximately 10% smaller (Figure 1).
Figure 1.
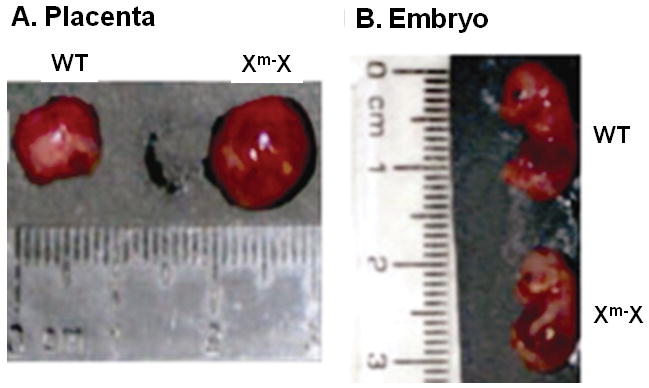
Plac1 ablation results in placentomegaly and apparent intrauterine growth retardation (IUGR). Gross appearance of a typical Het (Xm-X) placenta and embryo at E16.5 is illustrated. WT placenta = 103 mg; Xm-X placenta = 215 mg
Histologic analysis of mutant placentae revealed striking differences from WT. As shown in Figure 2, Periodic acid-Schiff (PAS) staining of glycogen cells contained in the junctional zone revealed that the Het (Xm-X) placentae exhibited an expanded junctional zone that migrated and encroached into the labyrinth (Fig. 2D). This effect on the junctional zone was also observed in the knockout (KO) placentae (Fig. 2B). Interestingly, placentae associated with Hets that inherited the mutant allele from the father (XXp-) appeared normal in both size and histological appearance, continuing to exhibit a well-defined boundary between the junctional zone and labyrinth (Fig. 2C).
Figure 2.
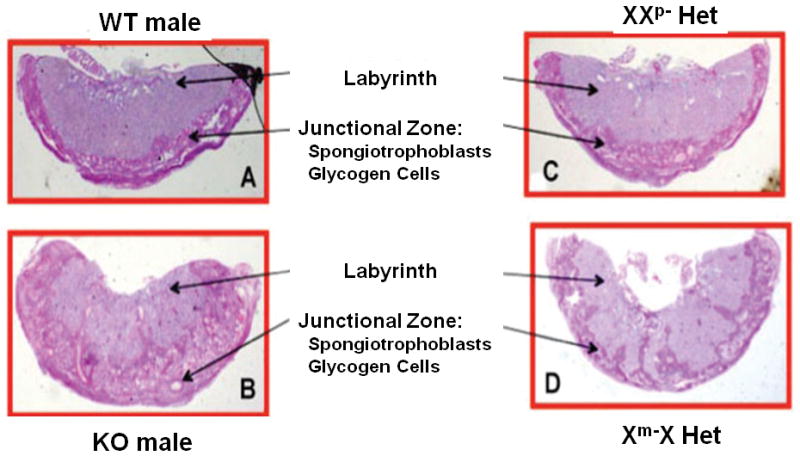
Histological appearance of Plac1 mutant placentae. Periodic acid-Schiff (PAS) stain of paraffin-embedded placentae obtained at E16.5 (magnification = 1.5×).
The identification of the junctional zone was confirmed by in situ hybridization. The expression of Prl8a8 and Prl2c2, specific markers for spongiotrophoblasts and trophoblast giant cells (TGC), respectively (Simmons et al, 2010), were examined. As shown in Figure 3, positive staining for Prl8a8 confirmed the identity of the expanded spongiotrophoblast layer in both the Het (Xm-X) and KO placentae, whereas the spongiotrophoblast of the WT placenta retained its relatively narrow, well demarcated dimensions. By contrast, Prl2c2 transcript was found in TGCs localized at the periphery of the junctional zone, in proximity to the decidua; in sinusoidal TGCs within the labyrinth; and in some spongiotrophoblasts at the boundary of the junctional zone and labyrinth (Figure 4). Increased TGCs numbers were evident in the labyrinth layer in the Het and KO placentae. It is not clear from these images if these cells represent sinusoidal TGCs or TGCs associated with parts of the junctional zone that have encroached into the labyrinth.
Figure 3.
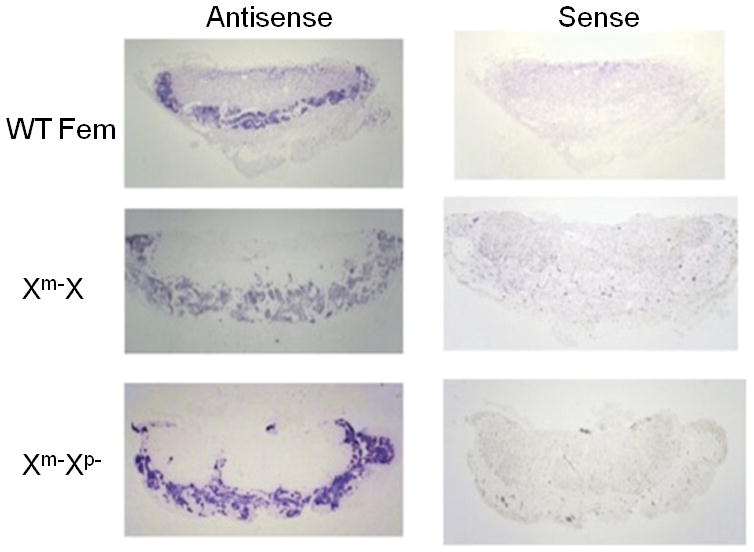
Spongiotrophoblasts in WT and Plac1-mutant placentae. In situ hybridization of Prl8a8 expression using a digoxygenin detection system, as described in “Materials and Methods”. Non-specific signal was determined by hybridization with the “sense” riboprobe construct (magnification = 1.5×).
Figure 4.
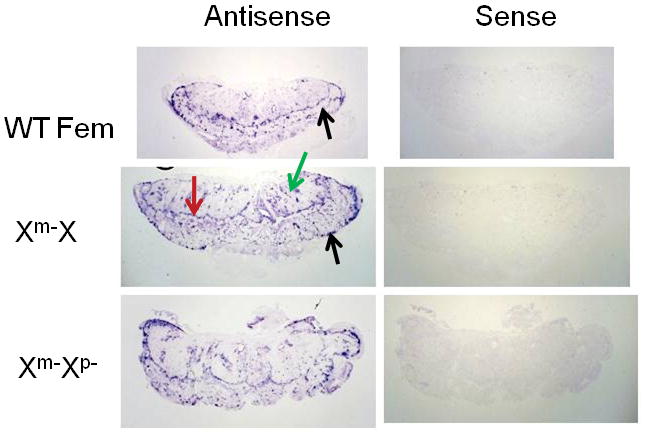
Trophoblast giant cells (TGC) in WT and Plac1-mutant placentae. In situ hybridization of Prl2c2 expression using the digoxygenin detection system, as described in “Materials and Methods”. Black arrows = parietal TGCs adjacent to the decidua; Green arrow = sinusoidal TGCs; Red arrow = SpT at the interface of the junctional zone and labyrinth. Non-specific signal was determined by hybridization with the “sense” riboprobe construct. Magnification = 1.5×.
Temporal Pattern of Placental Growth: Relationship to Genotype
In order to assess the dynamics of placental and embryonic growth, mice with each genotype were examined at different stages of gestation. As illustrated in Figure 5A, WT placental weights peaked at E16.5 and decreased slightly thereafter, as expected. The weights of Het (Xm-X) placentae were slightly greater than WT at E12.5, but exhibited accelerated weight gain afterwards, doubling in weight by E14.5. They subsequently followed a pattern similar to the WT, peaking at E16.5 and decreasing afterwards. By contrast, the KO placentae deviated from the growth pattern exhibited by the Hets. Although they weighed more than the WT placentae at all time points examined, they weighed less (approximately 20%) than the Hets at E15.5 and E16.5. Moreover, instead of decreasing in weight after E16.5, they continued to increase in weight until term. The basis for divergence in their growth patterns is not known but suggests a dependence on the level of active Plac1 during gestation.
Figure 5.
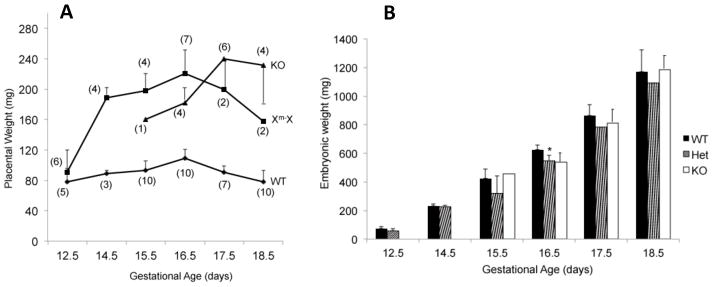
Placental and embryonic growth dynamics. Placental and embryonic weights were determined throughout gestation as a function of WT, Xm-X, and KO genotypes. WT and KO data include both male and female embryos. A. Placental weights (mean ± SD), with the number assessed (n) indicated in parentheses. B. Embryonic weights (mean ± SD); *, P = 0.041 (difference between Het and WT at E16.5).
Although placentae were generally larger in Het (Xm-X) and KO mice, embryonic weights between E12.5 and E18.5 were more variable but tended to be less (0–12%) than WT (Figure 5B), suggesting some degree of diminished placental function. Within this sampling, we were able to demonstrate that the weights of Xm-X Het embryos were significantly less than WT embryos at E16.5 (P = 0.041). Additionally, the rate of growth of the Xm-X Het embryos, as a group, was significantly less than WT embryos over this time period (P = 0.036). The absence of a statistically significant difference in the weights of the KO embryos most likely reflects their relatively smaller sample size. By contrast, postnatal growth of the KO males was not significantly different than the growth of WT males from weaning up to 4 months of age (Figure 6).
Figure 6.
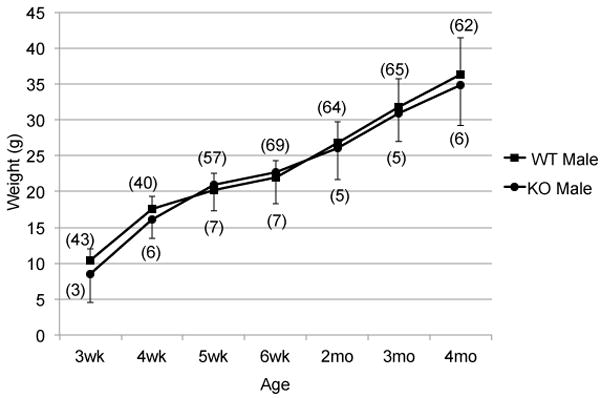
Post-natal growth of Plac1 mutants. The weights of male Plac1-KO and WT mice were determined at weaning (3 weeks) and followed for 4 months. The number assessed (n) indicated in parentheses.
Plac1 escapes complete paternal X-inactivation
The paternal X-chromosome is preferentially inactivated in extra-embryonic tissue in the mouse (Takagi and Sasaki, 1975). Therefore, null-mutations of X-linked genes contained on the maternal allele usually result in phenotypes identical to the complete KO. The observation that Het placentae inheriting the Plac1 mutation through the father (XXp-) appeared phenotypically normal was consistent with that outcome. Yet, in somatic X-inactivation, approximately 15% of X-linked genes are estimated to escape complete inactivation (Yang et al, 2010). Although paternal X-inactivation in extraembryonic cells has not been investigated at a molecular level, partial escape from total inactivation of the paternal Plac1 allele would likely provide some degree of compensation for the mutated maternal allele. This could result in the less severe phenotype compared to the complete KO and disparate growth patterns of the Plac1 KO and Het (Xm-X) placentae.
To test if paternal Plac1 partially escapes X-inactivation, Plac1 mRNA expression was measured at E15.5 by quantitative, real time PCR. As shown in Figure 7, Xm-Xplacentae, representing paternal expression, was approximately 10–20% of WT expression, confirming expression from the paternal allele. The paternal expression of Plac1 was further supported by in situ hybridization. Plac1 expression was demonstrated in the labyrinth and junctional zone of the WT placenta at E12.5, as shown in Figure 8A. Expression in the junctional zone was particularly strong at this stage of gestation. By contrast, expression was substantially diminished or eliminated in the junctional zone in the Xm-XHet placenta, whereas the labyrinth continued to express some Plac1 (Figure 8C).
Figure 7. Paternal expression of Plac1.
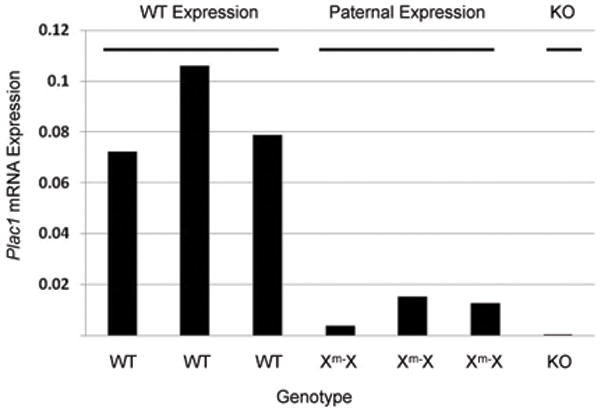
Plac1 mRNA expression was determined by quantitative RT-PCR in placentae of female WT and Xm-X littermates. Plac1 expression was normalized against 18S ribosomal RNA, and shown in arbitrary units. A KO placenta from a separate litter was included as a negative control.
Figure 8.
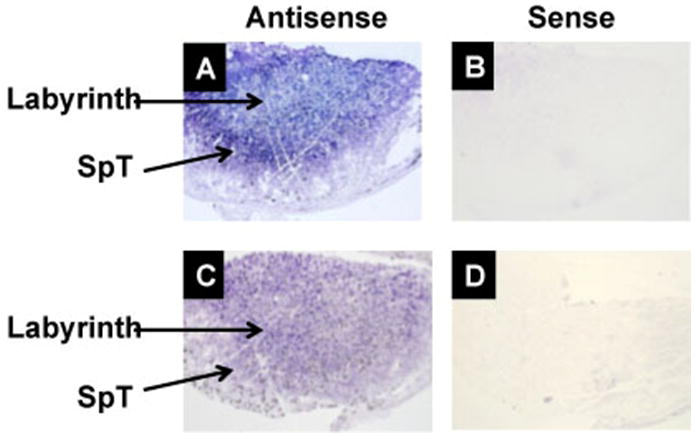
Plac1 expression in murine placenta. In situ hybridization of Plac1 mRNA at E12.5 using a digoxygenin detection system, as described in “Materials and Methods”. A–B: WT placenta. C–D: Xm-X heterozygous placenta. SpT = spongiotrophoblasts. Non-specific hybridization was identified using a probe in the “sense” orientation.
Plac1 KO mice are less viable
Crosses between Plac1 KO males and WT females yield offspring, demonstrating that KO males are fertile. Yet, when 136 mice resulting from (XY) x (Xm-X) and (XY) x (XXp-) mating schemes were genotyped at weaning, male KO (Xm-Y) mice were underrepresented based on their expected occurrence, suggesting reduced viability (Table 1a, P = 0.0001). Similarly, no Xm-Xp- KO females have been recovered thus far from the limited number of offspring available from the appropriate cross (Table 1b).
Table 1.
Postnatal Phenotypes
| A: WT Male x Het Female | ||||
|---|---|---|---|---|
| Litter | WT Male | KO Male | WT Female | Het (Xm-X) |
| 1 | 4 | 1 | 5 | 0 |
| 2 | 2 | 1 | 1 | 3 |
| 3 | 2 | 1 | 2 | 0 |
| 4 | 1 | 1 | 4 | 2 |
| 5 | 2 | 0 | 2 | 0 |
| 6 | 5 | 0 | 0 | 2 |
| 7 | 1 | 0 | 3 | 1 |
| 8 | 2 | 0 | 1 | 3 |
| 9 | 6 | 0 | 2 | 0 |
| 10 | 2 | 0 | 0 | 1 |
| 11 | 2 | 0 | 0 | 3 |
| 12 | 3 | 0 | 0 | 3 |
| 13 | 3 | 0 | 3 | 0 |
| 14 | 4 | 0 | 2 | 2 |
| 15 | 4 | 0 | 2 | 2 |
| 16 | 1 | 0 | 1 | 1 |
| 17 | 3 | 0 | 4 | 0 |
| 18 | 5 | 0 | 2 | 0 |
| 19 | 3 | 0 | 4 | 1 |
| 20 | 2 | 0 | 1 | 3 |
| 21 | 2 | 0 | 2 | 1 |
| 22 | 3 | 1 | 2 | 0 |
| 23 | 3 | 0 | 3 | 0 |
| Actual # Offspring | 59 | 7* | 46 | 24 |
| Expected # Offspring | 34 | 34 | 34 | 34 |
| B: KO Male x Het Female | ||||
|---|---|---|---|---|
| Litter | WT Male | KO Male | KO Female | Het (XXp-) |
| 1 | 0 | 1 | 0 | 3 |
| 2 | 1 | 0 | 0 | 3 |
| 3 | 0 | 1 | 0 | 0 |
| Actual #Offspring | 1 | 2 | 0 | 6 |
| Expected #Offspring | 2–3 | 2–3 | 2–3 | 2–3 |
Statistically significant deviation from the expected number of offspring
Similar analyses examined the prenatal genotypes of all embryos obtained from E12.5 – E18.5. In the WT male x Het female crosses, KO animals were not underrepresented (Table 2a, P = 0.27). Similarly, embryos resulting from KO male x Het female matings resulted in Xm-Y (KO male) and Xm-Xp- (KO female) embryos in numbers consistent with their expected occurrence (Table 2b). These data indicate that Plac1-null mice tend to succumb late in gestation, during the peripartum period, or shortly after delivery. The basis for this is not known.
Table 2.
Prenatal Genotypes
| A: WT Male x Het Female | ||||
|---|---|---|---|---|
| Litter | WT Males | KO Male | WT Female | Het (Xm-X) |
| e12.5-L1 | 1 | 0 | 2 | 3 |
| e12.5-L2 | 1 | 1 | 1 | 3 |
| e15.5-L3 | 0 | 0 | 3 | 3 |
| e15.5-L4 | 2 | 1 | 2 | 1 |
| e16.5-L5 | 3 | 0 | 1 | 3 |
| e16.5-L6 | 2 | 0 | 1 | 4 |
| e17.5-L7 | 1 | 3 | 3 | 2 |
| e18.5-L8 | 3 | 1 | 1 | 2 |
| e18.5-L9 | 3 | 2 | 2 | 0 |
| Actual # Offspring | 16 | 8 | 16 | 21 |
| Expected # Offspring | 15–16 | 15–16 | 15–16 | 15–16 |
| B: KO Male x Het Female | ||||
|---|---|---|---|---|
| Litter | WT Male | KO Male | KO Female | Het (XXp-) |
| e16.5-L1 | 3 | 3 | 1 | 1 |
| e17.5-L2 | 3 | 1 | 2 | 2 |
| e18.5-L3 | 1 | 1 | 0 | 0 |
| e16.5-18.5-L4 | 3 | 2 | 2 | 2 |
| Actual # Offspring | 10 | 7 | 5 | 5 |
| Expected # Offspring | 6–7 | 6–7 | 6–7 | 6–7 |
DISCUSSION
These findings demonstrate that Plac1 is essential for normal placental development. Plac1 deficiency results in a hyperplastic placenta, characterized by an enlarged and dysmorphic junctional zone. The molecular mechanisms contributing to this abnormal placental development are still unknown, but it is interesting that several other mouse models have been reported with similar phenotypes. Placentomegaly is a common phenotype of nuclear transplantation (NT) offspring from engineered mouse ES cells and of mouse interspecies hybridization (Ihpd) (Zechner et al, 1996; Suemizu et al, 2003). The observed overgrowth is associated with histological changes analogous to the Plac1 phenotype. Additionally, Esx1 is a paternally imprinted gene located on the distal end of the long arm of the X-chromosome and is important in fetal and placental development (Li et al, 1997, Li and Behringer, 1998). It is only expressed in extra-embryonic tissues. Esx1 deficiency results in a phenotype strikingly similar to Plac1 deficiency, with an expansion of the junctional zone as well as abnormal extension of the spongiotrophoblast layer into the labyrinth layer. Further, Esx1 deficiency is associated with embryonic growth retardation by E16.5. Differential microarray analysis comparing the placentomegaly associated with Ihpd, NT, and Esx1 deletion revealed little overlap in differentially expressed genes, suggesting that their shared phenotype has distinct genetic origins (Singh et al, 2004). Interestingly, Plac1 is over-expressed in placentae of the NT mouse (Suezimu et al, 2003) whereas it is downregulated in Ihpd (Singh et al, 2004).
Imprinted genes not localized to the X-chromosome have also been identified that have similar effects on placental growth and morphology. Deficiency of Ipl (also known as Tssc3 or Phlda2), a maternally imprinted gene expressed in extra-embryonic tissues (labyrinthine trophoblast and visceral yolk sac), is also associated with placentomegaly (Frank et al, 2002). Phenotypically, Plac1 and Ipl deficiency have similar features, including expansion of the spongiotrophoblast. By contrast, the loss of Phlda2 imprinting (leading to over-expression) results in the opposite phenotype, characterized by placental growth retardation and a reduction in the spongiotrophoblast layer (Salas et al, 2004). The levels and activity of Plac1 have not been assessed in these models. Overall, Plac1 is a candidate protein that may mediate placentomegaly in a variety of genetic models and may contribute to the understanding of placental developmental programming.
It is well established that there is preferential inactivation of the murine paternal X chromosome in extra-embryonic tissues. Our data also suggests that there is some paternal escape from Plac1 X-inactivation. Quantitative RT-PCR demonstrated that Plac1 expression from the paternal allele (Xm-X) was not completely eliminated, indicating that the paternal allele contributed to overall Plac1 expression. This partial expression from the paternal allele is most likely responsible for the observed difference in growth patterns exhibited by the (Xm-X) Het and KO placentae. The basis for the apparent Plac1 expression from the paternal allele is not known, but likely reflects differential promoter activity. Koslowski, et al (2007) recently identified a PLAC1 promoter relevant to its expression in trophoblasts and its ectopic expression in cancer cells. More recently, Chen, et al (2011) reported the presence of an additional Plac1 promoter in both mouse and human. It remains to be seen which promoter is driving the expression when the copy of Xp escapes inactivation.
The decreased viability exhibited by Plac1-null mice, but not by (Xm-X) Hets, provides compelling evidence that the small amount of Plac1 expressed from the paternal allele results in sufficient functional capacity of the placenta (not present in the KO). The absence of this activity is not invariably lethal, suggesting that it may lead to a probabilistic increased susceptibility to adverse outcomes. Because embryos of all genotypes are represented in numbers that approximate their expected distribution, Plac1-null mice appear to be adversely affected and tend to succumb somewhere between late gestation (in the peripartum period) and weaning. Secondary factors can now be studied that could predispose the Plac1-null embryos to specific developmental risks and/or stress events late in gestation or shortly after delivery.
In summary, these studies demonstrate that Plac1 is paternally imprinted and essential for normal placental and embryonic development. The paternal Plac1 allele exhibits partial escape from X-inactivation, contributing significantly to placental development and function. Plac1-null males exhibit reduced viability, yet surviving males are fertile and exhibit normal postnatal growth.
MATERIALS AND METHODS
Mutant mouse model
The Plac1 open reading frame, located on exon 6, was deleted in murine ES cells (KOMP-NIH initiative; www.velocigene.com/komp/detail/10766). Blastocysts were injected with the Plac1-null ES cells and chimerae were obtained. After germline transmission was achieved, the mice were bred against a C57BL/6 background. For the studies described in this report, timed matings between hemizygous (KO) or wild type (WT) males and heterozygous (Het) or WT females were carried out in accordance to a protocol approved by the Institutional Animal Care and Use Committee of the University of South Florida College of Medicine. Pregnant females were studied at specific times during gestation to evaluate placental and embryonic growth during gestation.
Genotyping and sex determination of mice
DNA was isolated from embryonic mouse tails using a DNeasy Blood and Tisssue Kit (Qiagen). Plac1 genotype was determined by PCR, using the following primers: 5′-CCAATCATGTTCACCCACATTTCTAC (WT forward); 5′-CCCTAAAAGAGCTATCATGGCATCT (Reverse); 5′-GCAGCCTCTGTTCCACATACACTTCA (Neo universal forward). The cycling parameters were: 94°C for 5 min, followed by 10 cycles of 94°C for 15 s, 65°C for 30 s (decreased by 1°C at each repeat), and 72°C for 40 s; followed by 30 cycles of 94°C for 15 s, 55°C for 30 s, and 72°C for 40 s. PCR products were terminated with a final extension at 72°C for 5 min, then held at 4°C. A 1% agarose gel was used to visualize the generated wildtype and mutant bands at 548 bp and 326 bp, respectively. Embryonic sex was determined by PCR using the mouse SRY primers: 5′-TGGGACTGGTGACAATTGTC and 5′-GAGTACAGGTGTGCAGCTCT (Salas et al., 2004). The cycling parameters were: 95°C for 4.5 min, followed by 33 cycles of 95°C for 35 s, 55°C for 1 min and 72°C for 1 min, and final extension 72°C for 5 min, then held at 4°C. A 1% agarose gel was used to visualize the generated SRY fragment at 402 bp.
Immunohistochemical Analysis
Immediately following the sacrifice of the pregnant females, placentae and embryos were collected, blotted dry, and weighed. The placentae were bisected in half, then one half was placed immediately into RNAlater (Ambion) for DNA and RNA isolation; the other half was placed in 4% phosphate-buffered paraformaldehyde (Electron Microscopy Sciences) for 24 hours, embedded in paraffin, and cut into 5-μm sections. The sections were deparaffinized using Histoclear-II (Fisher), followed by dehydration with graded concentrations of ethanol. Glycogen cells were identified using a Periodic Acid-Schiff (PAS) Staining System (Sigma-Aldrich) according to manufacturer’s instructions. Additional sections were subjected to immunofluorescence microscopy.
In situ hybridization
In situ hybridization was performed using a digoxigenin-labeled, complementary RNA (cRNA) probe specific for Prl8a8, Prl2c2/proliferin and Plac1 (Openbiosystems) using a modified protocol for paraffin-imbedded tissue sections (Roche). Embryonic day-16.5 sections were deparaffinized twice in xylene for 5 min, incubated in cold 100% methanol for 30 min, then incubated in methanol/hydrogen peroxide (5:1) for 60 min, rehydrated from 70% ethanol to distilled water for 5 min, and washed with PBT (phosphate buffered saline, 0.1% Tween 20). The sections were treated with proteinase K at 20 μg/ml for 20 min, and fixed with 4% phosphate-buffered paraformaldehyde for 20 min. The slides were hybridized using digoxigenin-labeled cRNA probes specific for mouse Prl2c2, Prl8a8, or Plac1, in the sense and anti-sense orientation, at 1 μg/ml overnight at 60°C. The slides were washed twice with WASH I (50% Formamide, 5X SSC and 1% SDS) for 30 min at 65°C, then washed twice with WASH III (50% Formamide, 2X SSC and 0.1% Tween 20) for 30 min at 65°C. The slides were then blocked in blocking solution for 1 hour and incubated with alkaline phosphatase (AP)-conjugated, anti-digoxigenin Fab fragments overnight at 4°C. The slides were washed three times in PBT and NTMT (100mM NaCL, 100mM Tris-HCL pH9.5, 50mM MgCl2 and 0.1% Tween 20). The BM purple substrate was added to the slides, and incubated overnight. Finally, the slides were washed and fixed with 4% PFA, dehydrated, cleared in xylene, and mounted using permanent mounting medium.
Quantitative, real time PCR
Placental RNA was extracted using the AllPrep DNA/RNA Mini Kit (Qiagen). Isolated placental RNA was used for quantitative real-time PCR. Two micrograms of total RNA were used to synthesize the complementary cDNA with primer oligo dT and the SuperScript III First-Strand Synthesis SuperMix (Invitrogen), according to the manufacturer’s protocol. The RT-PCR reaction was performed using 2 μL cDNA with 1 μL 20X Taqman mouse Plac1 probe 5′-TCA AAG GCC CAA CTG CGA TTG TCC A (Applied Biosystems), 10 μL TaqMan Universal PCR Master Mix (Applied Biosystems), 7 μL autoclaved RNAase-free water, for a total volume of 18 μL. As an internal control, a second RT-PCR reaction was performed using 2 μL of a 1:10 diluted cDNA with 1 μL 20X Taqman 18S probe, 10 μL 2X Master Mix (Applied Biosystems), and 7 μL autoclaved RNAase-free water for a total volume of 18 μL. Thermocycling conditions were as follows: 50°C, 2 min; 95°C, 10 min; and 40 cycles of 95°C for 15 s and 60°C for 1 min. RNA expression relative to 18S was calculated.
Statistical Analysis
The distributions of prenatal and postnatal genotypes were analyzed using the Fisher exact test. Genotype-specific embryonic weights were compared using a three-way analysis of variance (ANOVA), except at E12.5 and E14.5 where the Students t-test was used due to insufficient numbers of KO embryos. Additionally, analysis of covariance (ANCOVA) was performed to assess the change in weights of between E12.5 and E18.5 of each genotype. A P-value ≤ 0.05 was considered statistically significant.
Acknowledgments
The authors would like to acknowledge Brandon Keith and the staff of the animal care facility of the USF-Morsani College of Medicine for their assistance with breeding and maintenance of the Plac1 mutant mice. The authors would also like to acknowledge the support and helpful suggestions of Drs. Ramaiah Nagaraja and David Schlessinger of the National Institute on Aging (Baltimore, Md.) and Richard Behringer (MD Anderson Cancer Center, Houston, TX.) during the course of these studies. The help of Jane Carver, Ph.D. and Ren Chen, Ph.D. with the statistical analyses is gratefully acknowledged. This work was supported by grants from NICHD (HD048862, MEF) and the March of Dimes (FY09-503, MEF).
Grant Support: NICHD (HD048862, MEF); The March of Dimes (FY09-503, MEF).
Abbreviations
- Het
heterozygous
- Ihpd
interspecific hybrid placental dysplasia
- KO
knockout
- Plac1
Placenta specific-1
- TGC
trophoblast gian cell
- WT
wildtype
References
- 1.Chen Y, Moradin A, Nagaraja R, Schlessinger D. RxRα and LxR activate two promoters in placenta- and tumor-specific expression of PLAC1. Placenta. 2011;32:877–84. doi: 10.1016/j.placenta.2011.08.011. [DOI] [PMC free article] [PubMed] [Google Scholar]
- 2.Cocchia M, Huber R, Pantano S, Chen EY, Ma P, Forabosco A, Ko MS, Schlessinger D. PLAC1, an Xq26 gene with placenta-specific expression. Genomics. 2000;68:305–12. doi: 10.1006/geno.2000.6302. [DOI] [PubMed] [Google Scholar]
- 3.Fant M, Weisoly DL, Cocchia M, Huber R, Khan S, Lunt T, Schlessinger D. PLAC1, a trophoblast-specific gene, is expressed throughout pregnancy in the human placenta and modulated by keratinocyte growth factor. Mol Reprod Dev. 2002;63:430–6. doi: 10.1002/mrd.10200. [DOI] [PubMed] [Google Scholar]
- 4.Fant M, Barerra-Saldana H, Dubinsky W, Poindexter B, Bick R. The PLAC1 protein localizes to membranous compartments in the apical region of the syncytiotrophoblast. Mol Reprod Dev. 2007;74:922–9. doi: 10.1002/mrd.20673. [DOI] [PubMed] [Google Scholar]
- 5.Frank D, Fortino W, Clark L, Musalo R, Wang W, Saxena A, Li CM, Reik W, Ludwig T, Tycko B. Placental overgrowth in mice lacking the imprinted gene Ipl. Proc Natl Acad Sci U S A. 2002;99:7490–5. doi: 10.1073/pnas.122039999. [DOI] [PMC free article] [PubMed] [Google Scholar]
- 6.Hemberger MC, Pearsall RS, Zechner U, Orth A, Otto S, Ruschendorf F, Fundele R, Elliott R. Genetic dissection of X-linked interspecific hybrid placental dysplasia in congenic mouse strains. Genetics. 1999;153:383–390. doi: 10.1093/genetics/153.1.383. [DOI] [PMC free article] [PubMed] [Google Scholar]
- 7.Koslowski M, Sahin U, Mitnacht-Kraus R, Seitz G, Huber C, Tureci O. A placenta-specific gene ectopically activated in many human cancers is essentially involved in malignant cell processes. Cancer Res. 2007;67:9528–9534. doi: 10.1158/0008-5472.CAN-07-1350. [DOI] [PubMed] [Google Scholar]
- 8.Kushi A, Edamura K, Noguchi M, Akiyama K, Nishi Y, Sasai H. Generation of mutant mice with large chromosomal deletion by use of irradiated ES cells--analysis of large deletion around hprt locus of ES cell. Mamm Genome. 1998;9:269–73. doi: 10.1007/s003359900747. [DOI] [PubMed] [Google Scholar]
- 9.Li Y, Lemaire P, Behringer RR. Esx1, a novel X chromosome-linked homeobox gene expressed in mouse extraembryonic tissues and male germ cells. Dev Biol. 1997;188:85–95. doi: 10.1006/dbio.1997.8640. [DOI] [PubMed] [Google Scholar]
- 10.Li Y, Behringer RR. Esx1 is an X-chromosome-imprinted regulator of placental development and fetal growth. Nat Genet. 1998;20:309–11. doi: 10.1038/3129. [DOI] [PubMed] [Google Scholar]
- 11.Massabbal E, Parveen S, Weisoly DL, Nelson DM, Smith SD, Fant M. PLAC1 expression increases during trophoblast differentiation: evidence for regulatory interactions with the fibroblast growth factor-7 (FGF-7) axis. Mol Reprod Dev. 2005;71:299–304. doi: 10.1002/mrd.20272. [DOI] [PubMed] [Google Scholar]
- 12.Salas M, John R, Saxena A, Barton S, Frank D, Fitzpatrick G, Higgins MJ, Tycko B. Placental growth retardation due to loss of imprinting of Phlda2. Mech Dev. 2004;121:1199–210. doi: 10.1016/j.mod.2004.05.017. [DOI] [PubMed] [Google Scholar]
- 13.Silva WA, Jr, Gnjatic S, Ritter E, Chua R, Cohen T, Hsu M, Jungbluth AA, Altorki NK, Chen YT, Old LJ, Simpson AJ, Caballero OL. PLAC1, a trophoblast-specific cell surface protein, is expressed in a range of human tumors and elicits spontaneous antibody responses. Cancer Immun. 2007;7:18. [PMC free article] [PubMed] [Google Scholar]
- 14.Singh U, Fohn LE, Wakayama T, Ohgane J, Steinhoff C, Lipkowitz B, Schulz R, Orth A, Ropers HH, Behringer RR, Tanaka S, Shiota K, Yanagimachi R, Nuber UA, Fundele R. Different molecular mechanisms underlie placental overgrowth phenotypes caused by interspecies hybridization, cloning, and Esx1 mutation. Dev Dyn. 2004;230:149–64. doi: 10.1002/dvdy.20024. [DOI] [PubMed] [Google Scholar]
- 15.Simmons DG, Rawn S, Davies A, Hughes M, Cross JC. Spatial and temporal expression of the 23 murine Prolactin/Placental Lactogen-related genes is not associated with their position in the locus. BMC Genomics. 2010 doi: 10.1186/1471-2164-9-352. [DOI] [PMC free article] [PubMed] [Google Scholar]
- 16.Suemizu H, Aiba K, Yoshikawa T, Sharov AA, Shimozawa N, Tamaoki N, Ko MS. Expression profiling of placentomegaly associated with nuclear transplantation of mouse ES cells. Dev Biol. 2003;253:36–53. doi: 10.1006/dbio.2002.0870. [DOI] [PubMed] [Google Scholar]
- 17.Takagi N, Sasaki M. Preferential inactivation of the paternally derived X chromosome in the extraembryonic membranes of the mouse. Nature. 1975;256:640–2. doi: 10.1038/256640a0. [DOI] [PubMed] [Google Scholar]
- 18.Yang F, Babak T, Shendure J, Disteche CM. Global survey of escape from X inactivation by RNA-sequencing in mouse. Genome Res. 2010;20:614–22. doi: 10.1101/gr.103200.109. [DOI] [PMC free article] [PubMed] [Google Scholar]
- 19.Zechner U, Reule M, Orth A, Bonhomme F, Strack B, Guenet, Hameister H, Fundele R. An X-chromosome linked locus contributes to abnormal placental development in mouse interspecific hybrid. Nat Genet. 1996;12:398–403. doi: 10.1038/ng0496-398. [DOI] [PubMed] [Google Scholar]


