

Abstract
A growing body of evidence has highlighted an association between a lack of access to nutritious, affordable food (e.g., through full-service grocery stores [FSG]), poor diet, and increased risk for obesity. In response, there has been growing interest among policymakers in encouraging the siting of supermarkets in “food deserts,” i.e., low-income geographic areas with low access to healthy food options. However, there is limited research to evaluate the impact of such efforts, and most studies to date have been cross-sectional. The Pittsburgh Hill/Homewood Research on Eating, Shopping and Health (PHRESH) is a longitudinal quasi-experimental study of a dramatic change (i.e., a new FSG) in the food landscape of a low-income, predominantly African-American neighborhood. The study is following a stratified random sample of households (n=1372), and all food venues (n=60) in both intervention and control neighborhoods, and the most frequently reported food shopping venues outside both neighborhoods. This paper describes the study design and community-based methodology, which focused simultaneously on the conduct of scientifically rigorous research and the development and maintenance of trust and buy-in from the involved neighborhoods. Early results have begun to define markers for success in creating a natural experiment, including strong community engagement. Baseline data show that the vast majority of residents already shop at a FSG and do not shop at the nearest one. Follow-up data collection will help determine whether and how a new FSG may change behaviors, and may point to the need for additional interventions beyond new full service grocery stores alone.
Keywords: natural experiment, food desert, community engagement, full-service grocery stores
Two of three adults in the United States (US) are currently either overweight or obese (Ogden et al., 2006; Ogden, Carroll, & Flegal, 2008). Low-income populations and racial/ethnic minority groups are disproportionately affected (May, Freedman, Sherry, & Blanck, 2013), with non-Hispanic blacks at the highest prevalence of obesity (48%) compared with non-Hispanic whites (33%), and Hispanics (43%) (Ogden, Carroll, Kit, & Flegal, 2013). A growing body of research emphasizes the importance of social conditions and their role in people’s risk for obesity and other health conditions. As a result, the use of socioecological approaches to health promotion has increased (Lieberman, Golden, & Earp, 2013), and interventions have been designed to follow suit (McLeroy, Bibeau, Steckler, & Glanz, 1988), including, for example, family and community-level interventions (Cottrell et al., 2013) and policy and environmental efforts (Cheadle et al., 2010).
The Case for a Natural Experiment
Some studies have explored the lack of supermarkets in low-income areas as a possible contributing factor to unhealthy eating and obesity. Neighborhoods with greater socioeconomic deprivation and higher concentrations of African American residents tend to have fewer supermarkets than neighborhoods populated by white and more affluent residents (Gordon et al., 2011; Krukowski, West, Harvey-Berino, & Elaine Prewitt, 2010). In a national study representing more than 28,000 ZIP codes across the US (Powell, Slater, Mirtcheva, Bao, & Chaloupka, 2007), the availability of chain supermarkets in African American neighborhoods was found to be approximately one-half that in white neighborhoods. Compared with other food stores, supermarkets tend to offer a larger variety of high-quality healthful foods at lower cost (Block & Kouba, 2006; Bodor, Rose, Farley, Swalm, & Scott, 2008; Chung & Myers Jr, 1999; Connell et al., 2007; Glanz, Sallis, Saelens, & Frank, 2007; Sallis, Nader, Rupp, Atkins, & Wilson, 1986). Studies using in-store observations have shown greater availability and higher quality of fresh produce, low-fat dairy products and snacks, lean meats, and high-fiber bread in predominantly white areas compared to non-white areas (Fisher & Strogatz, 1999; Horowitz, Colson, Hebert, & Lancaster, 2004; Hosler, Varadarajulu, Ronsani, Fredrick, & Fisher, 2006; Morland & Filomena, 2007; Sloane et al., 2003; Zenk et al., 2006). Finally, research has found that residing nearer to a large, full-service grocery store (FSG) or supermarket is linked to better dietary quality, and lower risk of obesity and other risk factors for chronic disease (Bodor et al., 2008; Cheadle et al., 1991; Laraia, Siega-Riz, Kaufman, & Jones, 2004; Moore, Diez Roux, & Brines, 2008; Morland, Wing, & Roux, 2002; Rose & Richards, 2004; Zenk et al., 2006).
In response to such data, there has been growing interest among policymakers in locating supermarkets in “food deserts,” defined by the USDA as census tracts that meet both low-income and low-access thresholds: “Low-income communities”, have a) a poverty rate of 20 percent or greater, or b) a median family income at or below 80 percent of the area median family income. “Low-access communities”, are based on the determination that at least 500 persons and/or at least 33% of the census tract’s population live more than one mile from a supermarket or large grocery store (10 miles, in the case of non-metropolitan census tracts) (United States Department of Agriculture, 2009).
For example, the Healthy Food Financing Initiative, which was proposed by the White House Task Force on Childhood Obesity (The White House Office of the First Lady, 2011; White House Task Force on Childhood Obesity, 2010), incentivizes supermarkets to locate in food deserts. The initiative is a partnership between the U.S. Departments of Treasury, Agriculture and Health and Human Services to provide financing in the form of tax credits, grants, or low-cost loans for developing and equipping grocery stores, small retailers, corner stores, and farmers markets selling healthy food in underserved areas. The full service grocery as part of this study received almost $1 million in funding from the Healthy Food Financing Initiative. This effort is based on the premise that increased access to FSGs will lead to healthier food purchases. We note that although there is variation in how the funds are used, most are for start-up expenses including construction and infrastructure development (i.e., refrigeration, startup business expenses). The grants are made as part of a broader strategy to address objectives like decreasing dependency on Federal programs, chronic unemployment, and community deterioration in rural areas. Conditions of the store and/or food prices are not regulated.
Although a number of studies have highlighted an association between a lack of physical access to nutritious, affordable food, poor diet, and increased risk for obesity, the evidence has been shown to be more tentative (Feng et al 2010; Larson NI et al 2009; Papas MA 2007). Part of the challenge has been that measures across studies have not been consistent, and no meta-analyses have been performed (Feng et al 2010). Some major limitations to both sets of research (that have found associations, and that have not) include varying use of ‘food environment’ measures, in addition to reliance on commercial databases such as Info USA and Dun & Bradstreet, which particularly in predominantly Black tracts, have been found to have misclassification bias (Han et al. 2012). Boone-Heinonen and colleagues have pointed out how relevant proximities vary across neighborhood features and across population subgroups, and how physical activity and food environments may operate differently in rural, suburban, and urban areas. Boone-Heinonen found that greater supermarket availability was generally unrelated to diet quality and fruit and vegetable intake, and relationships between grocery store availability and dietary outcomes were mixed (Boone-Heinonen et al 2011). Shier et al found no consistent evidence that access to a large supermarket was related to lower BMI in youth, or that greater exposure to fast food restaurants, convenience stores and small food stores was associated with increased BMI (Shier et al. 2012).
Another major limitation of the research on supermarket availability and health behaviors to date is that, with few exceptions (Boone-Heinonen et al., 2011), the research has been on cross-sectional data. To our knowledge, there is just one longitudinal study in the US that has evaluated the health behaviors of households in low-income, minority communities over the course of a changing food environment (i.e., eliminating a food desert with the opening of a FSG). The study, based in Philadelphia, found low adoption of the new supermarket as the primary place for food shopping, and a statistically insignificant effect on body mass index and dietary behaviors (Cummins, Flint, & Matthews, 2014). Two studies in the United Kingdom (UK) measured the impact of new or improved large-scale food retail provision in poor communities; these studies yielded mixed results: a Leeds study demonstrated a modest improvement in intake (Wrigley, Warm, & Margetts, 2003) while a Glasgow study found no improvement (Cummins, Petticrew, Higgins, Findlay, & Sparks, 2005). All three studies faced significant limitations: The Philadelphia study collected information via telephone and included a disproportionate share of university students, which limits the generalizability of the findings, while the Leeds study did not have a control group, and the Glasgow study had limited power to detect change and questionable external validity because of small sample sizes. Additionally, these studies were not able to examine potential moderators of healthy food purchasing and intake, such as means of transportation; degree of physical proximity to food purchasing venues; perceived food availability and prices; and socio-cultural factors, including attitudes toward eating a healthy diet, nutrition knowledge, and social support for healthy eating.
In this paper we describe a natural experiment to evaluate the extent to which a major change in the food environment (the opening of a FSG) of a low-income, predominantly African American neighborhood in Pittsburgh, PA, influences change in residents’ diet and food purchasing. This Pittsburgh neighborhood, known as the Hill District, had been a food desert for more than three decades, a generation of time for residents to develop the food behaviors and habits that are the focus of our study.
We describe the study design and community-based methodology, which focused simultaneously on the conduct of scientifically rigorous research and on developing and maintaining trust and buy-in from the involved communities. We present baseline findings that describe households’ food acquisition practices prior to the supermarket opening and lessons learned from the study to date.
The Pittsburgh Hill/Homewood Research on Eating, Shopping, and Health (PHRESH)
PHRESH is taking advantage of the opening of a new $8.5 million FSG in the Hill District of Pittsburgh, PA. The study combines a natural experiment with a pre-post quasi experimental design and involves two waves of data collection: at baseline and exactly three years later.
Study Design
“Natural experiments” are studies in which the researcher cannot control the allocation of an intervention to communities of interest, but where natural variation in allocation occurs; a natural experiment is often the best alternative in the absence of a randomized controlled study (Petticrew et al., 2005). PHRESH is using household surveys to compare the average within-person change in an intervention group (Hill District neighborhood) relative to the average within-person change in a “control” group (Homewood neighborhood). The use of a control group allows us to separate intervention effects from other simultaneous changes and secular trends. Our team will also employ propensity score matching, a statistical method where intervention residents are matched with control residents to estimate an unbiased effect of the intervention by accounting for characteristics of residents in the intervention neighborhood (or control neighborhood) that may predict receiving the intervention (or not receiving the intervention). Propensity score matching accounts for any systematic differences between the ‘intervention’ and ‘control’ groups. Accounting for these differences with propensity scores reduces or eliminates effects of confounding when using observational data. We are also conducting pre- and post-assessments of the in-store food environment in both neighborhoods and the ten most frequently reported food retail venues (i.e., up to 20 venues total) outside each neighborhood where participants report purchasing food. These assessments: 1) document the number and type of food purchasing venues and 2) assess the availability, quality, and price of healthy foods within these venues.
Research Setting
The Pittsburgh setting has many features that make it a suitable location for this study. Like many post-industrial US cities, Pittsburgh is characterized by racial and socioeconomic residential segregation. Located in southwestern Pennsylvania, Pittsburgh is home to 306,430 ± 53 people, of whom 64.7% are non-Hispanic White (NHW), 25.5% non-Hispanic Black (NHB), 4.5% Asian, and 2.5% Hispanic (U.S. Census Bureau). Substantial economic disparities exist between NHWs and NHBs. In 2008–2012, the median household income for NHB families in Pittsburgh was $22,289, compared to $45,970 for NHW families (U.S. Census Bureau).
Description of intervention neighborhood
The Hill District is the city’s geographic center and was once considered the cultural center of African American life for the city. Today, the Hill District is one of the city’s most distressed neighborhoods, with 45% of African American residents earning an income below the federal poverty line (U.S. Census Bureau). Nearly 20% of the Hill’s residents in the civilian labor force are unemployed (with many others under-employed) (U.S. Census Bureau), and 35.8% report no access to a vehicle. According to U.S. census data (U.S. Census Bureau, 2000), the total population of the Hill in 2010 was 10,311. The last grocery store in the Hill closed in 1980. Figure 1 shows “The Hill” neighborhoods, which consist of five City of Pittsburgh Neighborhoods. As its name suggests, the Hill District is located approximately 100 – 250 ft. above bordering neighborhoods, with the northwest border of the area being a 500 ft. escarpment. These features help depict why and how the Hill District is geographically isolated.
Figure 1.

The Hill District
Description of control community
Homewood (See Figure 1) consists of six City of Pittsburgh neighborhoods. The current population, which is 90 – 97% African American and includes some of the poorest household incomes in the city, is comparable in many ways to the Hill District (See Table 1). With topography similar to that of the Hill District, the northern section of Homewood rises sharply as one of the highest escarpments in the city. Homewood is also isolated since it is bordered on the southwest by a bus route that is not traversable by pedestrians and by hills on the northeast and east.
Table 1.
Comparison of the Hill District and Homewood, using ACS data
| Neighborhood | Total # Households | % Black | % Unemployed | % No Access to Vehicle | % Families Below Poverty | % Female Headed Households | Median Household income in 2009 |
|---|---|---|---|---|---|---|---|
| Hill District | 4839 | 84% | 19% | 36% | 39% | 29% | 17,914 |
| Homewood | 3657 | 91% | 22% | 33% | 37% | 32% | 24,179 |
Note. From American Community Survey 5-yr data (2008–2012), Tables DP04, DP05, DP03, B08141, B17010, and DP02, and the American Community Survey 5-yr data (2005–2009) for the Hill District neighborhoods (census tracts 305, 501,506, 509, 510, and 511) and Homewood neighborhoods (census tracts 1204, 1207, 1208, 1301, 1302, 1303, and 1304).
Implementation of the Experiment and Baseline Results
Participants and community engagement
PHRESH is following a stratified random sample of households (n=1372), all food venues (restaurants and stores) (n=60) in both intervention and comparison neighborhoods, and the 20 most frequently reported food shopping venues outside of both neighborhoods. Participants were selected through door-to-door recruitment of randomly selected households where the primary food purchaser in each household who was at least 18 years old was asked to enroll. Signed informed consent was obtained in person after the interviewer discussed the study details. Participants were reimbursed up to $40 for completing both the administered questionnaire ($25) and one follow-up dietary recall approximately 7 – 10 days later ($15).
Engagement of the community
Engagement of the local community has proven critical to the study’s ability to randomly select and enroll households and collect data from community food purchasing venues. In addition to forming a neighborhood presence through our Hill District-based field office, we partnered with The Hill House Association, located in the Hill District, and Operation Better Block (OBB), located in Homewood. Hill House and OBB were established community partners prior to the researchers’ application to the National Institutes of Health. The Hill House, as a major advocate for siting the grocery store in the neighborhood, held a key stake in the anticipated outcomes from PHRESH and valued potential data from the project. Similarly, OBB saw the project as a source of evidence about the Homewood community’s needs for services and resources. Both organizations have assisted with questions about and perceptions of “research” being done in the community, and discussed the project’s value for the neighborhoods. The project hired a full-time field coordinator, responsible for the coordination and management of all data collectors, as well as for community-based outreach. The field coordinator was very familiar with both neighborhoods and had key connections with stakeholders, which made explaining the project and making an entry into the community easier.
Community partners also assisted with recruitment and hiring of 17 data collectors, 15 of whom were from the Hill District or Homewood. This was an additional priority, as our research team knew that training residents to understand the purpose and intent of the study would assist in enrollment and retention of households. We worked with our community partners to organize two 10-member Community Advisory Boards (CABs), one each in the Hill District and Homewood. We sought feedback from the CABs on our fieldwork and recruitment strategies, and both CABs reviewed and commented on preliminary versions of the household survey.
Our sampling frame consisted of all occupied residential addresses in both neighborhoods of interest. We obtained address information from the Pittsburgh Neighborhood and Community Information System (PNCIS), a parcel-level property information system managed by the University of Pittsburgh Center for Social and Urban Research (UCSUR). PNCIS data were merged with Allegheny County Office of Property Investment data, and addresses coded for residential or commercial status; commercial addresses, vacancies, and student housing were excluded from the sample.
In the intervention neighborhood, we stratified sampled households by distance from the future FSG site. We oversampled households from the stratum closest to the FSG, under the hypothesis that people closer to the site may utilize the store at different rates than those who reside at a greater distance. We did not use any stratification of stratum in our control neighborhood.
Based on this sampling frame, 2,900 households (1,809 in intervention and 1,091 in control) were approached about this study. Of the 1,956 that could be reached at home, 1,649 were eligible, of whom 87% (1,435) consented to participate. We did not have complete baseline interviews for approximately 4% of households. These data were removed, leaving a total of 1,372 randomly selected households (896 from the intervention neighborhood and 476 from the control). Our team did not conduct non-response interviews on individuals who we were unable to contact, or individuals who refused to participate. Therefore, we don’t have data to show whether these households may have differed from the households who we were able to enroll. However, our sample cohort is geographically representative of both neighborhoods, and we found our sample to be similar to the American Community Survey data for both areas, except for a few differences including: our population was slightly older, less likely to have a child in the household, and more likely to be female. At least some of these differences are probably because we interviewed primary food shoppers (more likely to be female) rather than selecting a random household adult. Respondents with children may be more difficult to enroll than respondents without children, likely because of time constraints.
Individual surveys
Eligible participants agreed to a 90-minute in-person and a 30-minute phone interview conducted 1–2 weeks later, and a follow-up interview after the introduction of the FSG. We conducted baseline household interviews from May to November 2011 to assess participants’ household food purchasing habits and individual dietary intake. Follow-up interviews will take place in May through November 2014.
Food Audits
From November 2011 to February 2012, we conducted pre-assessments of all existent stores that sold any type of food in both neighborhoods, and the most frequently reported food retail venues outside the neighborhood where households reported purchasing food. We compiled lists of food establishments from several sources: a database of food purchasing venues compiled for the City of Pittsburgh, an existing database of food purchasing venues maintained by the Hill House, feedback from our community partners, and a systematic street-by-street audit of comparison and intervention neighborhoods by our data collectors. Data collectors performed audits that assessed type, quality and price of available foods, in addition to information on displays, advertising, store cleanliness, and facilities.
Baseline data
In this paper, we focus on results from our household survey of food shoppers. Results from our food audits are presented in another paper (under review). Table 2 shows that of our cohort, most respondents were between 45 and 75 years of age, reported a per capita household income between $5,000 and $20,000/year, and were high school graduates and/or had some college or technical school. Almost all (90.5%) identified as black, and an additional 3.6% identified as biracial. Approximately 42% of respondents reported either taking public transport or a jitney (unregulated taxi) as their primary mode of transportation for food shopping. Nearly three-quarters were female. Most respondents were not currently married and did not have children living in the household. More than three-quarters (76.6%) were overweight or obese; 21% were of normal weight; and 2.4% were underweight. Mean Healthy Eating Idex-2005 (HEI-2005) score was 48.9 (out of a possible 100 points). Nationally, HEI-2005 mean scores are 57.2, and among non-Hispanic blacks, 55.0 (Ervin, 2011).
Table 2.
Description of Participants
| Demographics | n | Percentage |
|---|---|---|
| Age | ||
| 18–34 | 238 | 17.35 |
| 35–44 | 161 | 11.73 |
| 45–54 | 289 | 21.06 |
| 55–64 | 295 | 21.50 |
| 65–74 | 204 | 14.87 |
| 75+ | 185 | 13.48 |
| Sex | ||
| Male | 356 | 25.95 |
| Female | 1016 | 74.05 |
| Race/Ethnicity | ||
| Black | 1234 | 90.54 |
| Mixed - Black | 49 | 3.6 |
| Other | 80 | 5.87 |
| Per Capita Annual Household Income | ||
| < 5,000 | 221 | 16.11 |
| 5,000–9,999 | 488 | 35.57 |
| 10,000–19,999 | 403 | 29.37 |
| 20,000+ | 260 | 18.95 |
| Marital Status | ||
| Married/Living w/Partner | 254 | 18.58 |
| Never Married | 574 | 41.99 |
| Widowed/Divorced/Separated | 539 | 39.43 |
| Educational Attainment | ||
| < High School Diploma | 202 | 14.72 |
| High School Diploma | 499 | 36.37 |
| Some College/Technical School | 461 | 33.60 |
| College Degree | 210 | 15.31 |
| Number of Kids in the Household | ||
| 0 | 1001 | 72.96 |
| 1 | 189 | 13.78 |
| 2 | 100 | 7.29 |
| 3+ | 82 | 5.98 |
| Drive to food shop | 529 | 38.6% |
| Get a ride | 234 | 17.1% |
| Jitney (unregulated taxi) | 343 | 25% |
| Public Transport | 239 | 17.4% |
| Other | 26 | 1.9% |
| BMI | ||
| < 18.5 | 33 | 2.43 |
| 18.5 – 24.9 | 285 | 20.97 |
| 25 – 29.9 | 408 | 30.02 |
| 30.0 – 34.9 | 303 | 22.3 |
| 35.0 – 39.9 | 167 | 12.29 |
| >=40 | 163 | 11.99 |
| Healthy Eating Index | ||
| 0–30 | 53 | 3.87 |
| 31–40 | 300 | 21.91 |
| 41–50 | 466 | 34.04 |
| 51–60 | 364 | 26.59 |
| 61–70 | 144 | 10.52 |
| 71–90 | 42 | 3.06 |
As shown in Figure 3, when asked where they do their major food shopping, 76% of respondents (n=1029) reported going to a FSG, and 11% (n=154) reported going to a supercenter (e.g., Walmart, Target Supercenter). Others went to discount groceries (5%), wholesale clubs like Sam’s Club or Costco (3%), or specialty stores.
Figure 3.

Most Residents Shop at a Full Service Supermarket
When we looked at the distance that residents reported travelling for food shopping, we found that most (n=698), or 51%, were not shopping at the nearest FSG, but instead at one that was on average 2.7 miles from home (See Figure 4). An additional 25% (n=334) who went to another store (not a FSG) travelled an average distance of 7.9 miles. Just 24% (n=331) of our residents shopped at their closest FSG.
Figure 4.
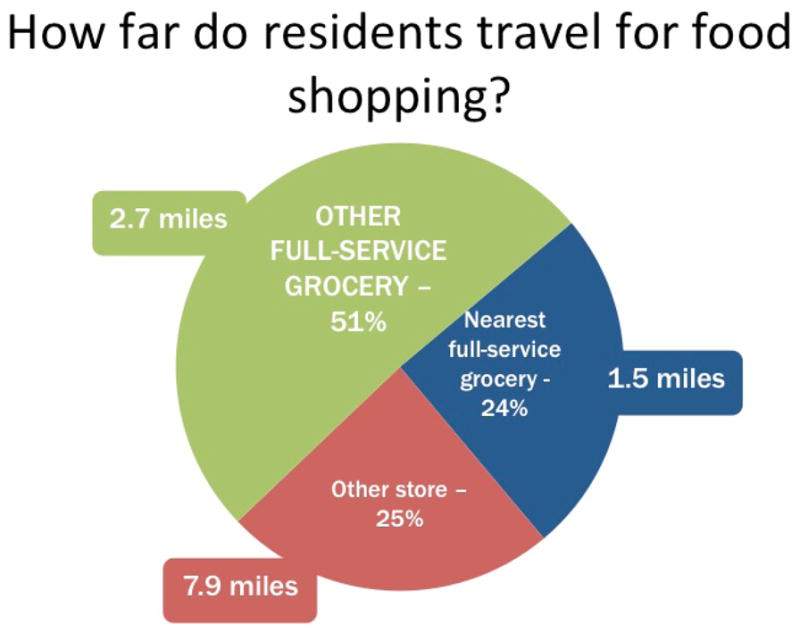
Most Residents did not shop at the nearest store to their home
Table 3 shows characteristics of residents according to their major food shopping venue. Residents who reported going to the nearest FSG (24.3% of residents) had a slightly lower average household income compared to those who went to FSGs located further away (51.2% of residents). Residents who reported going to discount grocery stores and/or meat and seafood stores (8.5% of residents) had the lowest average household income. Those who went to the nearest FSG were also less likely to have access to a car (45.7 % had access to a car), compared to residents who went to FSGs further away (57% had access to a car). Residents who went somewhere else (supercenters, wholesale clubs) had a substantially higher access to car (75.8% and 94.3% respectively). Most residents left from home to do their food shopping, except for residents who shopped mostly at specialty stores. Likewise, the average weekly spending on food was similar except for residents who shopped at Specialty stores. Those residents who went to a full service grocery that was not the closest reported spending slightly less time to complete shopping, compared with those residents do went to the closest full service grocery.
Table 3.
Characteristics of Residents and Where They Shop
| Store Type | % who use this as main place to shop | Adjusted Household Income (in 1000’s) | Average distance traveled to this type of store | Frequency of shopping (times/month) | Access to a Car | Usual departure from home in food shopping routine | Average Weekly Spending on Food | Average amount of time it takes to complete shopping | HEI of shopper | BMI of shopper |
|---|---|---|---|---|---|---|---|---|---|---|
| Nearest FSG | 331 (24.3%) | 11.3 (10.9) | 1.5 (0.3) | 2.9 (0.8) | 150 (45.7%) | 317 (96.4%) | $62.40 (45.7) | 115.0 (59.1) | 47.9 (10.2) | 30.2 (7.4) |
| Other FSG | 698 (51.2%) | 14.3 (13.1) | 2.7 (1.5) | 3.0 (0.8) | 396 (57.0%) | 633 (91.5%) | $64.70 (52.2) | 109.9 (51.9) | 49.3 (11.1) | 30.4 (7.3) |
| Not FSG | 334 (24.5%) | 14.9 (13.6) | 7.9 (4.5) | 2.6 (0.7) | 229 (68.8%) | 301 (90.7%) | $73.30 (62.5) | 134.8 (67.3) | 49.1 (10.8) | 31.3 (7.6) |
| DGS | 74 (5.4%) | 9.6 (9.9) | 4.8 (3.1) | 2.7 (0.8) | 42 (56.8%) | 68 (91.9%) | 73.1 (62.2) | 120.2 (66.8) | 48.1 (10.4) | 32.5 (8.0) |
| Supercenter | 154 (11.3%) | 12.9 (13.7) | 11.1 (2.9) | 2.5 (0.7) | 116 (75.8%) | 137 (90.1%) | 71.0 (59.6) | 145.5 (69.8) | 48.9 (10.9) | 32.1 (8.0) |
| Wholesale | 35 (2.6%) | 14.7 (12.0) | 10.4 (2.9) | 2.5 (0.7) | 33 (94.3%) | 33 (94.3%) | 72.6 (53.1) | 145.3 (68.9) | 51.5 (9.9) | 31.9 (4.5) |
| Specialty | 25 (1.8%) | 21.9 (25.9) | 2.2 (1.3) | 3.2 (0.9) | 18 (72.0%) | 18 (72.0%) | 107.9 (79.6) | 97.2 (46.7) | 56.6 (12.7) | 27.4 (6.1) |
| Meat/Seafood | 42 (3.1%) | 10.1 (8.0) | 3.5 (2.3) | 2.4 (0.6) | 19 (45.2%) | 41 (97.6%) | 66.5 (66.5) | 140.5 (57.8) | 44.9 (8.6) | 28.3 (7.3) |
Note. FSG = full service grocery store; DGS = discount grocery store
Discussion
Although we have not yet collected data on the study’s fundamental outcomes of interest, specifically changes in residents’ diet, food shopping, and purchasing behaviors, we have already identified important lessons from the implementation process and our baseline data.
First, we have begun to define markers for success in creating a natural experiment. PHRESH has focused on having researchers and community members join together to rigorously study health issues in their environment in a way that produces quality data. Because many components of natural experiments (e.g., the intervention) are not within the researcher’s control, community engagement prior to the study was critical to facilitate collaboration among researchers and community members, particularly in responding to time-sensitive opportunities. Capitalizing on such natural experiments in low-income communities necessitates an understanding, and acknowledgement, that research has historically not benefitted many low-income minority populations, and there is often lingering distrust of research and researchers in such communities. Establishing trust among key stakeholders and organizations in the community was essential in our study’s design and implementation. Regular meetings with CABs and our community partners allowed us to explain the types of data we were collecting (e.g., perceptions of neighborhood satisfaction, crime, safety, health status) and the ways in which these data could be used for community advocacy and planning. The engagement of residents as key members of our study team (i.e., data collectors) allowed the study to be represented to the community by trusted individuals.
Our baseline results indicate the need to re-examine some assumptions about residents’ food purchasing practices and the role of geographic access in a food desert. Many studies have assumed that residents of food deserts do not shop at FSGs but purchase foods mainly at stores closest to where they live. However, our results indicated that the vast majority of residents in these food deserts already shop at a FSG, even though there are none in their immediate surroundings (i.e., within a mile radius of their homes). Our estimate that 76% of residents shopped at a FSG is lower than that for a multiethnic sample of recipients of the Special Supplemental Nutrition Program for Women, Infants, and Children (WIC) in two low-income neighborhoods in Philadelphia (98%) (Hillier et al., 2011), but much higher than estimates for a predominantly African American sample and a multiethnic sample in low-income neighborhoods in Detroit (38% and 35%, respectfully) (Zenk et al., 2005; Zenk et al., 2013).
We also found that the majority of residents in our study did not rely chiefly on neighborhood stores for their food shopping and also tended to bypass closer stores to shop elsewhere. Residents travelled an average distance of 2.7 miles to shop at a preferred FSG, despite the closest FSG being located, on average, 1.5 miles from their homes. And many travelled much further to access other types of stores. Similarly, residents of two low-income Philadelphia neighborhoods, on average, traveled 0.65 miles further than their closest food store for their general food shopping (Hillier et al., 2011).
Such findings at baseline give us the opportunity to question whether and how policy efforts that are focused mostly on “distance” from healthy options (in terms of access to healthy foods) may be incomplete. Specifically, if residents are already shopping at FSGs, but still not maintaining healthy food purchasing practices – then building more supermarkets alone may not have the hoped-for effect on people’s eating habits or on obesity trends, and other options may be needed on a programmatic or policy level. Of course, we will not know whether there are changes in food purchasing practices or diet until we have collected our follow-up data. It is possible that proximity to the new FSG will allow for more frequent trips to the store, which may be associated with increased purchases of fresh produce or perishable (and more healthy) food items. At the same time, it is also possible that the new supermarket will focus its marketing efforts on less-healthy food options (i.e., packaged foods, snacks and candy) and that, as a result, residents might not change food practices or diet.
Strengths and Challenges
PHRESH is the largest study in the US to longitudinally follow households and food outlets during the changing of the food environment. The findings of this study will begin to fill a key gap in the literature, and are expected to result in policy recommendations about the role of the food environment on food access, affordability, food choices and attitudes, and health status, as well as the unintended consequences of such a change.
The timing of the supermarket’s opening has been a challenge in this study. The FSG in the intervention neighborhood was originally scheduled to open by Thanksgiving 2011, but did not open until fall 2013. Such delays are not uncommon in natural experiment studies, but may require flexibility on the part of researchers, since the timeline and other aspects of the intervention cannot be controlled. Another limitation of this study design is its inability to fully account for differences between neighborhoods as well as the exposure of interest. However, this limitation is almost impossible to avoid with quasi-experimental studies of residents in neighborhoods, and propensity score matching will assist in systematically accounting for such differences.
Our ongoing study has already allowed us to understand the importance of community engagement in research that focuses on changes in low-income populations or neighborhoods. While there has been tremendous community enthusiasm and investment in the opening of the FSG, only time will tell whether and how this policy may change behaviors. Our findings thus far lead us in the direction of trying to understand what types of additional interventions may be needed to complement such policy-based efforts.
Figure 2.

Homewood
Contributor Information
Tamara Dubowitz, RAND Corporation.
Collette Ncube, University of Pittsburgh Graduate School of Public Health.
Kristin Leuschner, RAND Corporation.
Shannah Tharp-Gilliam, Homewood Children’s Village.
References
- An R, Sturm R. School and residential neighborhood food environment and diet among California youth. Am J Prev Med. 2012;42(2):129–135. doi: 10.1016/j.amepre.2011.10.012. [DOI] [PMC free article] [PubMed] [Google Scholar]
- Block D, Kouba J. A comparison of the availability and affordability of a market basket in two communities in the Chicago area. Public Health Nutrition. 2006;9(7):837. doi: 10.1017/phn2005924. [DOI] [PubMed] [Google Scholar]
- Bodor JN, Rose D, Farley TA, Swalm C, Scott SK. Neighbourhood fruit and vegetable availability and consumption: the role of small food stores in an urban environment. Public Health Nutrition. 2008;11(4):413. doi: 10.1017/S1368980007000493. [DOI] [PubMed] [Google Scholar]
- Boone-Heinonen J, Gordon-Larsen P, Kiefe CI, Shikany JM, Lewis CE, Popkin BM. Fast food restaurants and food stores: longitudinal associations with diet in young to middle-aged adults: the CARDIA study. Arch Intern Med. 2011;171(13):1162–1170. doi: 10.1001/archinternmed.2011.283. [DOI] [PMC free article] [PubMed] [Google Scholar]
- Boone-Heinonen J, Gordon-Larsen P. Obesogenic environments in youth: concepts and methods from a longitudinal national sample. Am J Prev Med. 2012 May;42(5):e37–46. doi: 10.1016/j.amepre.2012.02.005. [DOI] [PMC free article] [PubMed] [Google Scholar]
- Cheadle A, Psaty BM, Curry S, Wagner E, Diehr P, Koepsell T, Kristal A. Community-level comparisons between the grocery store environment and individual dietary practices. American Journal of Preventive Medicine. 1991;20(2):250–261. doi: 10.1016/0091-7435(91)90024-x. [DOI] [PubMed] [Google Scholar]
- Cheadle A, Samuels SE, Rauzon S, Yoshida SC, Schwartz PM, Boyle M, Solomon L. Approaches to measuring the extent and impact of environmental change in three California community-level obesity prevention initiatives. Am J Public Health. 2010;100(11):2129–2136. doi: 10.2105/AJPH.2010.300002. [DOI] [PMC free article] [PubMed] [Google Scholar]
- Chung C, Myers SL., Jr Do the Poor Pay More for Food? an Analysis of Grocery Store Availability and Food Price Disparities. Journal of consumer affairs. 1999;33(2) [Google Scholar]
- Connell CL, Yadrick MK, Simpson P, Gossett J, McGee BB, Bogle ML. Food supply adequacy in the Lower Mississippi Delta. Journal of Nutrition Education and Behavior. 2007;39(2):77–83. doi: 10.1016/j.jneb.2006.10.007. [DOI] [PubMed] [Google Scholar]
- Cottrell L, John C, Murphy E, Lilly CL, Ritchie SK, Elliott E, Neal WA. Individual-, family-, community-, and policy-level impact of a school-based cardiovascular risk detection screening program for children in underserved, rural areas: the CARDIAC Project. J Obes. 2013;2013:732579. doi: 10.1155/2013/732579. [DOI] [PMC free article] [PubMed] [Google Scholar]
- Craig P, Cooper C, Gunnell D, Haw S, Lawson K, Macintyre S, Thompson M. Using natural experiments to evaluate population health interventions: guidance for producers and users of evidence. Medical Research Council. 2011 doi: 10.1136/jech-2011-200375. [DOI] [PMC free article] [PubMed] [Google Scholar]
- Cummins S, Flint E, Matthews SA. New neighborhood grocery store increased awareness of food access but did not alter dietary habits or obesity. Health Aff (Millwood) 2014;33(2):283–291. doi: 10.1377/hlthaff.2013.0512. [DOI] [PMC free article] [PubMed] [Google Scholar]
- Cummins S, Petticrew M, Higgins C, Findlay A, Sparks L. Large scale food retailing as an intervention for diet and health: quasi-experimental evaluation of a natural experiment. Journal of Epidemiology & Community Health. 2005;59(12):1035–1040. doi: 10.1136/jech.2004.029843. [DOI] [PMC free article] [PubMed] [Google Scholar]
- Ervin RB. Healthy Eating Index–2005 total and component scores for adults aged 20 and over: national health and nutrition examination survey, 2003–2004. Washington, D.C: U.S. Department of Health and Human Services, Centers for Disease Control and Prevention, National Center for Health Statistics; 2011. [PubMed] [Google Scholar]
- Feng J, Glass TA, Curriero FC, Stewart WF, Schwartz BS. The built environment and obesity: a systematic review of the epidemiologic evidence. Health Place. 2010;16:175e90. doi: 10.1016/j.healthplace.2009.09.008. [DOI] [PubMed] [Google Scholar]
- Fisher BD, Strogatz DS. Community measures of low-fat milk consumption: comparing store shelves with households. Am Public Health Assoc. 1999;89(2):235–237. doi: 10.2105/ajph.89.2.235. [DOI] [PMC free article] [PubMed] [Google Scholar]
- Glanz K, Sallis JF, Saelens BE, Frank LD. Nutrition Environment Measures Survey in Stores (NEMS-S): Development and Evaluation. American Journal of Preventive Medicine. 2007;32(4):282–289. doi: 10.1016/j.amepre.2006.12.019. [DOI] [PubMed] [Google Scholar]
- Gordon C, Purciel-Hill M, Ghai NR, Kaufman L, Graham R, Van Wye G. Measuring food deserts in New York City’s low-income neighborhoods. Health Place. 2011;17(2):696–700. doi: 10.1016/j.healthplace.2010.12.012. [DOI] [PubMed] [Google Scholar]
- Han E, Powell LM, Zenk SN, Rimkus L, Ohri-Vachaspati P, Chaloupka FJ. Classification bias in commercial business lists for retail food stores in the U.S. Int J Behav Nutr Phys Act. 2012 Apr 18;9:46. doi: 10.1186/1479-5868-9-46. [DOI] [PMC free article] [PubMed] [Google Scholar]
- Hillier A, Cannuscio CC, Karpyn A, McLaughlin J, Chilton M, Glanz K. How far do low-income parents travel to shop for food Empirical evidence from two urban neighborhoods. Urban Geography. 2011;32(5):712–729. [Google Scholar]
- Horowitz CR, Colson KA, Hebert PL, Lancaster K. Barriers to buying healthy foods for people with diabetes: evidence of environmental disparities. Am Public Health Assoc. 2004;94(9):1549–1554. doi: 10.2105/ajph.94.9.1549. [DOI] [PMC free article] [PubMed] [Google Scholar]
- Hosler AS, Varadarajulu D, Ronsani AE, Fredrick BL, Fisher BD. Low-Fat Milk and High-Fiber Bread Availability in Food Stores in Urban and Rural Communities. Journal of Public Health Management & Practice. 2006;12(6):556. doi: 10.1097/00124784-200611000-00009. [DOI] [PubMed] [Google Scholar]
- Krukowski RA, West DS, Harvey-Berino J, Elaine Prewitt T. Neighborhood impact on healthy food availability and pricing in food stores. J Community Health. 2010;35(3):315–320. doi: 10.1007/s10900-010-9224-y. [DOI] [PMC free article] [PubMed] [Google Scholar]
- Laraia BA, Siega-Riz AM, Kaufman JS, Jones SJ. Proximity of supermarkets is positively associated with diet quality index for pregnancy. Preventive Medicine. 2004;39(5):869–875. doi: 10.1016/j.ypmed.2004.03.018. [DOI] [PubMed] [Google Scholar]
- Larson NI, Story MT, Nelson MC. Neighborhood environments: disparities in access to healthy foods in the U.S. Am J Prev Med. 2009;36:74e81. doi: 10.1016/j.amepre.2008.09.025. [DOI] [PubMed] [Google Scholar]
- Lieberman L, Golden SD, Earp JAL. Structural Approaches to Health Promotion: What Do We Need to Know About Policy and Environmental Change? Health Education & Behavior. 2013;40(5):520–525. doi: 10.1177/1090198113503342. [DOI] [PubMed] [Google Scholar]
- May AL, Freedman D, Sherry B, Blanck HM. Obesity - United States, 1999–2010. MMWR Surveill Summ. 2013;62(Suppl 3):120–128. [PubMed] [Google Scholar]
- McLeroy KR, Bibeau D, Steckler A, Glanz K. An ecological perspective on health promotion programs. Health Educ Q. 1988;15(4):351–377. doi: 10.1177/109019818801500401. [DOI] [PubMed] [Google Scholar]
- Moore LV, Diez Roux AV, Brines S. Comparing perception-based and geographic information system (GIS)-based characterizations of the local food environment. Journal of Urban Health. 2008;85(2):206–216. doi: 10.1007/s11524-008-9259-x. [DOI] [PMC free article] [PubMed] [Google Scholar]
- Morland K, Filomena S. Disparities in the availability of fruits and vegetables between racially segregated urban neighbourhoods. Public Health Nutr. 2007;10(12):1481–1489. doi: 10.1017/S1368980007000079. [DOI] [PubMed] [Google Scholar]
- Morland K, Wing S, Roux AD. The contextual effect of the local food environment on residents’ diets: the atherosclerosis risk in communities study. American Journal of Public Health. 2002;92(11):1761–1768. doi: 10.2105/ajph.92.11.1761. [DOI] [PMC free article] [PubMed] [Google Scholar]
- Ogden CL, Carroll MD, Curtin LR, McDowell MA, Tabak CJ, Flegal KM. Prevalence of overweight and obesity in the United States, 1999–2004. Am Med Assoc. 2006;295(13):1549–1555. doi: 10.1001/jama.295.13.1549. [DOI] [PubMed] [Google Scholar]
- Ogden CL, Carroll MD, Flegal KM. High body mass index for age among US children and adolescents, 2003–2006. JAMA. 2008;299(20):2401–2405. doi: 10.1001/jama.299.20.2401. [DOI] [PubMed] [Google Scholar]
- Ogden CL, Carroll MD, Kit BK, Flegal KM. NCHS data brief. Vol. 131. Hyattsville, MD: National Center for Health Statistics; 2013. Prevalence of obesity among adults: United States, 2011–2012. [PubMed] [Google Scholar]
- Papas MA, Alberg AJ, Ewing R, Helzlsouer KJ, Gary TL, Klassen AC. The built environment and obesity. Epidemiol Rev. 2007;29:129e43. doi: 10.1093/epirev/mxm009. [DOI] [PubMed] [Google Scholar]
- Petticrew M, Cummins S, Ferrell C, Findlay A, Higgins C, Hoy C, Sparks L. Natural experiments: an underused tool for public health? Public Health. 2005;119(9):751–757. doi: 10.1016/j.puhe.2004.11.008. [DOI] [PubMed] [Google Scholar]
- Powell LM, Slater S, Mirtcheva D, Bao Y, Chaloupka FJ. Food store availability and neighborhood characteristics in the United States. Preventive Medicine. 2007;44(3):189–195. doi: 10.1016/j.ypmed.2006.08.008. [DOI] [PubMed] [Google Scholar]
- Rose D, Richards R. Food store access and household fruit and vegetable use among participants in the US Food Stamp Program. Public Health Nutr. 2004;7(8):1081–1088. doi: 10.1079/PHN2004648. [DOI] [PubMed] [Google Scholar]
- Sallis JF, Nader PR, Rupp JW, Atkins CJ, Wilson WC. San Diego surveyed for heart-healthy foods and exercise facilities. Public health reports (Washington, DC: 1974) 1986;101(2):216. [PMC free article] [PubMed] [Google Scholar]
- Shier V, An R, Sturm R. Is there a robust relationship between neighbourhood food environment and childhood obesity in the USA? Public Health. 2012 Sep;126(9):723–30. doi: 10.1016/j.puhe.2012.06.009. Epub 2012 Aug 13. [DOI] [PMC free article] [PubMed] [Google Scholar]
- Sloane DC, Diamant AL, Lewis LVB, Yancey AK, Flynn G, Nascimento LM, Cousineau MR. Improving the nutritional resource environment for healthy living through community-based participatory research. Journal of General Internal Medicine. 2003;18(7):568–575. doi: 10.1046/j.1525-1497.2003.21022.x. [DOI] [PMC free article] [PubMed] [Google Scholar]
- The White House Office of the First Lady. First Lady Michelle Obama announces nationwide commitments to provide millions of people access to healthy, affordable food in underserved communities [Press release] 2011 Retrieved from http://www.whitehouse.gov/the-press-office/2011/07/20/first-lady-michelle-obama-announces-nationwide-commitments-provide-milli.
- U.S. Census Bureau. American Community Survey. 2008–2012 American Community Survey 5-Year Estimates, Table B23025. Retrieved February, 2014, from http://factfinder2.census.gov.
- U.S. Census Bureau. American Community Survey. 2008–2012 American Community Survey 5-Year Estimates, Table DP05. Retrieved February, 2014, from http://factfinder2.census.gov.
- U.S. Census Bureau. American Community Survey. 2008–2012 American Community Survey 5-Year Estimates, Table S1903. Retrieved February, 2014, from http://factfinder2.census.gov.
- U.S. Census Bureau. American Community Survey. 2008–2012 American Community Survey 5-Year Estimates, Tables B17020A and B17020B. Retrieved February, 2014, from http://factfinder2.census.gov.
- U.S. Census Bureau. Census 2000 Summary File 4: Household and Families 2000. 2000 Retrieved October 2004, from http://factfinder.census.gov.
- U.S. Department of Agriculture. Agricultural Marketing Service; How are food deserts identified? https://apps.ams.usda.gov/fooddeserts/foodDeserts.aspx.
- White House Task Force on Childhood Obesity. Solving the Problem of Childhood Obesity in a Generation: Report to the President. Washington, DC: Executive Office of the President of the United States; 2010. Retrieved from http://www.letsmove.gov/sites/letsmove.gov/files/TaskForce_on_Childhood_Obesity_May2010_FullReport.pdf. [Google Scholar]
- Wrigley N, Warm D, Margetts B. Deprivation, diet, and food-retail access: findings from the Leedsfood deserts’ study. Environment and Planning A. 2003;35(1):151–188. [Google Scholar]
- Zenk SN, Schulz AJ, Hollis-Neely T, Campbell RT, Holmes N, Watkins G, Odoms-Young A. Fruit and vegetable intake in African Americans income and store characteristics. Am J Prev Med. 2005;29(1):1–9. doi: 10.1016/j.amepre.2005.03.002. [DOI] [PubMed] [Google Scholar]
- Zenk SN, Schulz AJ, Israel BA, James SA, Bao S, Wilson ML. Fruit and vegetable access differs by community racial composition and socioeconomic position in Detroit, Michigan. Ethnicity & Disease. 2006;16(1):275–280. [PubMed] [Google Scholar]
- Zenk SN, Schulz AJ, Israel BA, Mentz G, Miranda PY, Opperman A, Odoms-Young AM. Food shopping behaviours and exposure to discrimination. Public Health Nutr. 2013:1–10. doi: 10.1017/S136898001300075X. [DOI] [PMC free article] [PubMed] [Google Scholar]