

Abstract
Aims
We examined the relationship between alcohol expectancies in childhood and onset of drinking, binge drinking, and drunkenness in adolescence and the influence of drinking onset on expectancy development.
Design
A prospective, longitudinal study of children assessed for alcohol expectancies and drinking at 4 time points between ages 6 and 17.
Setting
Community study of families at high risk for alcoholism conducted in a 4-county area in the Midwestern United States.
Participants
The study involved 614 children; 460 were children of alcoholics and 70% were male.
Measurements
Expectancies about alcohol effects were measured using the Beverage Opinion Questionnaire and child’s drinking by the Drinking and Drug History - Youth Form.
Findings
Partial factor invariance was found for expectancy factors from ages 6 to 17. Survival analysis showed that social/relaxation expectancies in childhood predicted time to onset of binge drinking and first time drunk (Wald chi-square, 1 d.f. = 3.8, p < .05 and 5.1, p < .05, respectively). The reciprocal effect was also present; when adolescents began drinking, there was an increase in social/relaxation expectancy and a concomitant increase in slope of the expectancy changes lasting throughout adolescence.
Conclusions
A reciprocal relationship exists between childhood alcohol expectancies and the development of alcohol involvement. Higher expectancies for positive effects predict earlier onset of problem drinking. Onset of use, in turn, predicts an increase in rate of development of positive expectancies.
Introduction
What is the relationship between childhood beliefs about alcohol and subsequent alcohol use? Goldman and colleagues noted that expectancies are “among the strongest predictors of drinking, even after other variables are controlled” (p. 219,1). The issue of whether alcohol expectancies also predict onset of drinking is of considerable etiologic importance, implying influence of personal characteristics in addition to social pressures. Our working model of expectancies is that they generally work in an automatic fashion to influence drinking behavior, although children can describe their beliefs when directly asked.
Expectancies have been studied as risk factors for heavy alcohol use in two ways. One way is to relate expectancies to other risk for alcoholism. Higher positive expectancies are related to both family history of alcoholism (2–4), and personality risk for alcoholism, such as undercontrolled temperament (3). Children in heavy drinkers’ homes had higher positive and arousal expectancies as early as third grade (3, 5, 6).
Secondly, expectancies have been studied as predictors of onset and amount of drinking. In pre-adolescence, positive expectancies were cross-sectionally related to drinking (7). In longitudinal studies traversing 2–4 years in adolescence, there is evidence for the effect of prior positive expectancies on drinking onset as well reciprocal relationships between positive expectancies and drinking in adolescence (8–10) and in college students (11). One long-term longitudinal study found that higher positive expectancies at age 16 predicted alcohol misuse and greater drinking at 35 (12). Increases in positive expectancies following drinking onset may be due to 1) drinking experiences that confirm pre-existing expectancies, 2) a self-fulfilling prophecy of drinking resulting in what was expected or 3) increased attention to the expected outcomes reinforcing the previously held beliefs (10). In addition, earlier drinkers may have higher subjective responses to the rewarding effects of alcohol, which would lead to an increase in positive expectancies.
Other studies of expectancies have focused on developmental trajectories. For the general population, positive expectancies are higher in older children, from 2nd through 12th grade (5, 13–15). The largest change is between third and fourth grades (ages 9 – 11) as children approach the age of experimentation with alcohol. Miller and colleagues (16) proposed that this age range reflects a “critical period” for expectancy development. Positive expectancies (17) and social facilitation expectancies (8) increase throughout middle and high school. In addition there is a substantial shift from negative-sedating to positive-arousing expectancies between 6th and 9th grades, suggesting that early experience with alcohol changes perceptions about alcohol’s effects. However, positive expectancies were seen to decrease throughout the college years (11).
Most prior longitudinal studies have traversed only 1 to 2 years and have measured expectancies after drinking onset. In our 9-year longitudinal study, we assessed expectancies long before drinking onset, allowing considerably stronger inference about the developmental effect of expectancies on drinking. We compare expectancy development in children from alcoholic and non-alcoholic families. This high-risk design provides higher than normal variance in onset indicators of drinking problems, increasing power to detect their relationships with expectancies. In addition, we examine multiple drinking behaviors rather than concentrating only on onset age. We hypothesized that expectancies would be more positive for children from alcoholic than control families and for those who are already drinking. In addition, we hypothesized that children of alcoholics (COAs) would have earlier onset of drinking, positive expectancies would predict earlier onset for several drinking behaviors (first drink, binge drinking, first drunkenness), and the drinking experience itself would predict subsequent expectancy increases. Having very early measures of expectancies allows us to examine the structure of expectancies throughout childhood and adolescence.
Method
Study Design
This research is part of a multi-wave prospective family study (18, 19) of a community sample at high risk for the development of alcoholism among offspring. Alcoholic men were recruited when they were convicted of drunk driving, met the Feighner diagnosis of probable or definite alcoholism (20), and resided with a 3–5 year old son and the son’s biological mother. Later, all siblings within +/− 8 years of age were recruited. Door-to-door canvassing in these families’ neighborhoods yielded a contrast/control group of families with no lifetime substance use diagnosis and an intermediate risk group of families with alcoholic fathers (For a detailed description, see 19).
All family members received a comprehensive assessment including drinking, psychiatric symptomatology, and social environment at baseline, and thereafter at 3-year intervals. Assessments were labeled Wave 1 (ages 6–8) to Wave 4 (ages 15–17), based on age of the child at time of assessment. This work involves 614 children (460 COAs, 70% male) for whom there was at least one alcohol expectancy measure and drinking onset data. 43% of mothers and 35% of fathers had high school education or less and 14% of both mothers and fathers were college graduates.
Beverage Opinion Questionnaire
The Beverage Opinion Questionnaire (BOQ) (21), administered at ages 6–8 (n=280), 9–11 (n=433), 12–14 (n=514), and 15–17 (n=522), assesses expectancies for soft drinks (30 items) and alcohol (30 items); responses to the alcohol items have been found to predict adolescent alcohol use (22). The phrase, “Drinking beer or wine would…” was followed by a phrase indicating expectancy for the beverage’s effect, e.g. would “make me feel good”. At age 6–8 (9–11 for poor readers), assessors read the instrument and showed 5 schematic faces, varying from smiling to frowning. The instructions were to point to the smiling face “if you completely agree” and the frowning face “if you completely disagree”. Older subjects responded on a 5-point scale ranging from “Agree” to “Disagree.”
From the BOQ, 23 content-matched items were used to develop scales comparable to Christiansen et al.’s Alcohol Expectancies Questionnaire – Adolescent form (AEQ-A (23)), the most widely used adolescent expectancy measure. For each wave, we performed exploratory factor analysis using Mplus (24), choosing a 3-factor solution based on eigenvalues and validity of factors. We eliminated 8 items which loaded on more than one factor and 2 items which did not have face validity with other items on the same factor. For ages 9–11, 12–14 and 15–17, each item loaded on the same factor. Figure 1 shows the standardized loadings for an exploratory factor analysis of these 13 items at 15–17. Analyses at the two earlier time points produced loadings that were very similar (not shown). The 3 factors are "negative affect arousal" ("arousal"), "cognitive improvement" (“cognitive”) and "social enhancement/relaxation" (“social”).9 Sums of items weighted by the factor loadings shown in Figure 1 produced the scale scores. Correlations between scales at age 6–8 ranged from −.13 to .58, with an average of .17; correlations between scales at 9–11 ranged from −.025 to .47, with an average of .21; at 12–14 the range was .062 to .40, with an average of .23; at 15–17, the range was .24 to .37, with an average of .30. Table 1 presents coefficient alphas for each scale at each time point, showing an increasing trend with age.
Figure 1.

Exploratory factor analysis model for the Beverage Opinion Questionnaire at 15–17. Correlations between factors: social/relaxation with cognitive, .39; social/relaxation with arousal, .41; arousal with cognitive, .32.
Table 1.
Cronbach’s alpha for the 4 expectancy scales derived from the Beverage Opinion Questionnaire. The average correlation was found by averaging the Fisher transforms of the 3 correlations and taking the inverse transform of the results.
| Cronbach's alpha (standardized value) | ||||
|---|---|---|---|---|
| Cognitive improvement (3 items) | Negative Affect Arousal (3 items) | Social enhancement /Relaxation (7 items) | Average | |
| Age 6–8 | .66 | .57 | .68 | .64 |
| Age 9–11 | .84 | .64 | .70 | .74 |
| Age 12–14 | .79 | .64 | .83 | .76 |
| Age 15–17 | .87 | .67 | .88 | .82 |
Measurement invariance
Measurement invariance was tested by setting the loadings of each item to be equal across each data wave and then relaxing the constraints and finding the difference in model fit. We tested each factor separately for factor invariance. Full factor invariance was found across waves 1–4 for the cognitive factor and partial invariance was found for the arousal factor (freeing the loadings for “Angry” across time) and the social/relaxation factor (freeing loadings for “Make friends”, “Meet friends” and “Forget problems” across time). Table 2 shows the chi-square and change in chi-square for each model.
Table 2.
Chi-square and chi-square change for factor invariance tests for each expectancy factor.
| χ2 | df | Δχ2 | d f | p for change | |
|---|---|---|---|---|---|
| Cognitive improvement loadings free | 58.2 | 48 | –––– | –––– | –––– |
| Cognitive improvement full factor invariance | 69.4 | 54 | 11.2 | 6 | .08 |
| Arousal loadings free | 57.9 | 48 | ------- | ------- | ------- |
| Arousal full factor invariance | 75.5 | 54 | 17.6 | 6 | .0073 |
| Arousal partial factor invariance (loading for “angry” is free) | 60.1 | 51 | 2.2 | 3 | .53 |
| Social/relaxation loadings free | 698.5 | 344 | ------- | ------- | ------- |
| Social full factor invariance | 767.9 | 362 | 69.2 | 18 | .000 |
| Social/relaxation partial factor invariance (loading for “Make friends”; “Meet friends” , and “Forget problems” are free) | 711.6 | 353 | 13.1 | 9 | .16 |
Drinking: Assessing onset, use, and problem use
Drinking and drunkenness were assessed by the Drinking and Drug Use - Child Form administered in interview format at ages 6–11, and a self-administered Youth Form version thereafter (25). Drinking onset was assessed by the item: “How old were you the first time you ever took a drink? Do not count the times when you were given a ’sip’ by an adult.” First time drunkenness, frequency and quantity of alcohol use and problems were also assessed. Onset of binge drinking was defined as the first time drinking at least 3–4 drinks for girls and 5–6 drinks for boys (26).
Family alcoholism
Lifetime DSM-IV alcohol use disorder diagnoses of parents were assessed via the Diagnostic Interview Schedule (DIS-III, 27) and the Drinking and Drug History (28) administered at baseline (reliability= 0.81). Either parent’s diagnosis was sufficient for an alcoholic classification; in 25% of families, both parents met criteria.
Data analysis
Discrete time survival analysis (29), implemented with PROC LOGISTIC (SAS ® v. 9.3) (30) following the formulation in Singer (29), was used to test the effect of expectancies on onset of drinking, drunkenness, and binge drinking, using age from 10 to 17 as the time variable. Onset for the 7 children who reported drinking earlier than 10 was set to age 10. For each onset model, the lowest AIC was found for the unrestricted model, vs. linear, quadratic, cubic and logarithmic. Expectancies were treated as time-varying covariates (31). Expectancy data were only used up to the year prior to onset of the outcome of interest. Because we had onset data for each year and expectancy data every three years, we would carry the expectancy data from the year of assessment for the next two years, but only if the expectancy assessment was completed prior to age of onset, e.g. consider a child who had expectancy assessments at ages 9, 12 and 15 who onset binge drinking at 14. The expectancy scores would be set to those measured at 9 for ages 9, 10 and 11 and to those measured at 12 for ages 12 and 13. The assessment at 15 would not be used and expectancy scores for ages 14 and higher would be set to missing. Confirming the proportional hazards assumption, interactions between expectancies and time were non-significant for each onset variable.
The design effect determines the effect on the analysis of having multiple members from the same family (32). This is a function of the intraclass correlation, which had a maximum value of 0.1 for social/relaxation expectancy at Wave 4, and the common cluster size: the number of children (614) divided by number of families involved (323) or 1.9. The design effect was calculated to be 1.09. Generally, a design effect of < 2.0 is considered small enough to be ignored based on simulation data (33); therefore, the effect of non-independence was ignored in the survival analysis.
A linear mixed model approach, using SAS PROC MIXED, was used to examine the effect of onset of drinking on the expectancy trajectories. We followed the procedure in Singer (34) to test for discontinuous changes in elevation and slope of expectancy following onset of drinking. We tested the effect of sibling dependency for each model. There was no significant improvement in fit by including family as a grouping variable; therefore, we could treat individuals as independent. This also confirms our assumption that we could ignore non-independence based on the design effect.
Missing data
Missing cases
There were 745 children in the entire sample across all waves. We restricted the sample to those 614 with at least one expectancy time assessment and with drinking onset data from any time point between age 11 and 17. The 131 excluded subjects did not differ from the included sample on proportion of children of alcoholics, age of administration at any wave, gender, age of first drink (for the 88 excluded due to missing expectancy data), or expectancy at any wave (for the 43 excluded due to missing drinking onset data). The amount of missing expectancy data for age 6–8 was 54%, for 9–11 was 24%, for 12–14 was 16%, and for 15–17 was 15%. There were no missing data for family alcoholism or drinking onset. The higher level of missing data at 6–8 was due to a lapse in funding that resulted in missing assessments for this age range.
Factor analysis was implemented with Mplus 7.11. By default, full information maximum likelihood analysis was performed, which includes all available data. In the measurement invariance models using waves 2–4, all of the covariance coverage values were > 0.5, as preferred (35). For survival analysis models using expectancies as predictors, 17% of cases were omitted due to missing expectancy data. For the linear mixed models, 20% of data points were omitted due to missing data.
Results
Comparison of children of alcoholics and controls
Figure 2 shows that social/relaxation expectancies for children of alcoholics (COAs) was higher than for children of non-alcoholics starting at 9–11, and also shows more differentiation over time. The arousal and cognitive improvement scales were not significantly different at any time point (p > .1) (not shown).
Figure 2.
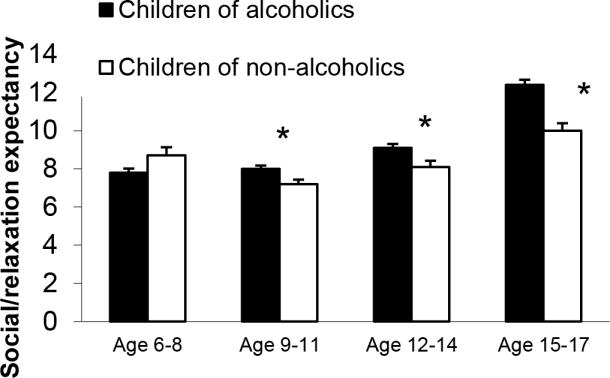
Social/relaxation expectancy score from Beverage Opinion Questionnaire for children in alcoholic (COA) and non-alcoholic families age 6–8 (208 COA, 82 controls), age 9–11 (321 COA and 118 controls), 12–14 (382 COA and 132 controls) and age 15–17 (398 COA and 124 controls)
Survival analyses predicting onset of drinking, binge drinking, and drunkenness from alcohol expectancies and child of alcoholic status
Table 3 shows the hypothesis test results for the predictors tested in the discrete time survival analysis. Gender was significantly related to the onset of binge drinking, but not drinking or first time drunk. There was a main effect of parental alcoholism status for each outcome and an interaction with time in predicting onset of drinking, so that child of alcoholic status had a greater effect at older ages.
Table 3.
Wald chi-square estimates for the survival analysis model with covariates and interactions with time.
| First drink | First time drunk | First binge | |
|---|---|---|---|
| Time | 25.3.0(7), p < .001 | 101.1 (7) p < .0001 | 12.5 (6) p = .05 |
| Sex | 2.2 (1), p = .14 | 2.5 (1), p = .11 | 4.5 (1), p = .03 |
| Sex*time | 10.3 (7), p = .17 | 4.7 (7), p = .7 | 5.3 (7), p=0.61 |
| Child of alcoholic | 0.48 (1), p < .01 | 15.9 (1), p<.001 | 26.4 (1), p<.001 |
| Child of alcoholic*time | 18.2 (7), p < .01 | 11.1 (7), p=.13 | 1.8 (7), p = .97 |
| Social/relaxation expectancy | 1.7 (1), p=.19 | 5.0 (1), p= .025 | 3.8 (1), p = .05 |
| Arousal expectancy | 0.13 (1), p = .72 | 0.08 (1), p = .78 | 1.0 (1), p = .31 |
| Cognitive expectancy | 0.6 (1), p = .43 | 1.1 (1), p = .29 | 0.09 (1), p = .77 |
For onset of drinking, no expectancy factors, measured prior to onset of drinking, were significant predictors (Table 3). Precursive social/relaxation expectancies (but not arousal or cognitive) were significant predictors for first time drunk and first binge (Table 3).
Survival curves, based on survival analysis parameter estimates, show that throughout adolescence, children of alcoholics got drunk at earlier ages than those in nonalcoholic families (Figure 3). Those with higher social expectancies, modeled at one standard deviation above the mean, got drunk at earlier ages than those with lower social expectancies (modeled at one standard deviation below the mean).
Figure 3.

Survival to first time drunk, using survival analysis estimates for the effects of social expectancies and child-of-alcoholic status
Effect of drinking onset upon expectancies
In cross-sectional analysis children who had onset drinking before the age 12–14 administration of the BOQ had higher levels of social/relaxation expectancies, even when controlling for expectancy score at the prior wave (PROC GLM, F for drinking onset = 8.5, p < .01) (Figure 4).
Figure 4.
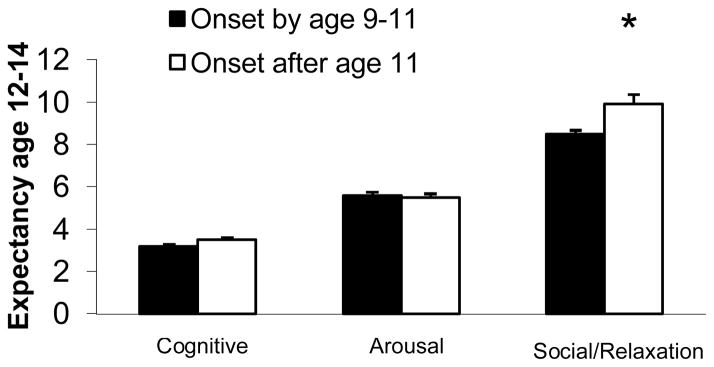
Expectancy scale scores for those who have onset drinking between ages 9–11 (n=90) and those who have not (n = 524) * p <.05.
We further examined the effect of drinking onset on social/relaxation expectancies with a linear mixed model. Table 4 shows the results of testing various models. The last column indicates which model is used as comparison for the current model. Model A is the simplest model, including age and the fixed effects of child of alcoholic status, gender and interaction between child of alcoholic status and time (Table 4). Adding the effect of drinking onset caused a significant change in model fit (Model B, to evaluate discontinuity in elevation) as did adding the effect of time elapsed since onset (Model D, to evaluate discontinuity in slope following onset). The best-fitting model included fixed and random effects for age, time since onset and the interaction of age and time since onset (Model I). The interaction term shows that the discontinuity in elevation is different at different ages. Inspection of parameter estimates (not shown) showed both an elevation increase and an increase in slope of social/relaxation expectancies following onset of drinking (this is consistent with the illustration in Figure 5).
Table 4.
Comparison of fitting alternative discontinuous change trajectories for the social/relaxation expectancies
| Model | −2LogL | Fixed effects | Variance components | Comparison model:Delta −2LogL (df) |
|---|---|---|---|---|
| A: Time and fixed effects only | 16480.1 | 2 | 4 | |
| B: Time + Elevation change | 16403.2 | 3 | 7 | A: 76.9*** (4) |
| C: Remove random effect of elevation change | 16457.6 | 3 | 4 | B: 54.4*** (3) |
| D: Time +Slope change | 16303.5 | 3 | 7 | A: 176.4*** (4) |
| E: Remove random effect of slope change | 16342.6 | 3 | 4 | D: 39.1*** (3) |
| F: Time + Elevation change +Slope change | 16216.5 | 4 | 11 | Vs B: 186.7*** (5) Vs. D 87*** (5) |
| G: Remove random effect of slope change | 16289.1 | 4 | 7 | F: 72.6*** (4) |
| H: Remove random effect of elevation change | 16289.7 | 4 | 7 | F: 73.2*** (4) |
| I: Include interaction of onset time and time | 16212.6 | 4 | 11 | B: 190.6*** (5) |
| J: Remove random effect of interaction term in I | 16281.2 | 4 | 7 | I: 68.6*** (4) |
Figure 5.

Trajectories of development of social/relaxation expectancies for children who start drinking between ages 12–14 and those who delay drinking onset until after age 17.
As an illustration of the effect of drinking onset on the development of expectancies, we plotted trajectories of social expectancies for children who started drinking between ages 12 and 14 (Figure 5) and compared those trajectories with those of children who started drinking after 17. Consistent with the model, the earlier onset children showed increasing social expectancies during the interval of onset, and their expectancy levels continued to increase throughout adolescence. In contrast, those who did not begin drinking until after 17 showed a slower increase throughout the course of adolescence.
Discussion
The present work found a reciprocal relationship between alcohol expectancies and drinking behavior over the course of middle childhood and adolescence in a sample at high risk for alcoholism. The study begins earlier (ages 6–8) than previous work, and through 9 years of changing social relationships and alcohol availability shows that the relationship between drinking behavior and expectancies is a dynamic one. On one hand, higher social/relaxation expectancies in middle childhood predict earlier onset of drunkenness and binge drinking, which are significant indicators of problem drinking (36–39). On the other hand, when children began experimenting with alcohol, there was a discontinuity in trajectory of positive expectancy development, with both an elevation change (a “bump” up) and an increase in rate of development, i.e., a steeper expectancy growth for children with early onset. Moreover, living in an alcoholic home predicted both higher positive expectancies and earlier onset of all drinking outcomes. Early onset drinking and an alcoholic home have a common thread; they involve greater exposure to other drinkers. We cannot test this by manipulating children's exposure to drinking environments. However, both children of alcoholics and early onset drinkers have higher expectancies that drinking will lead to positive social experience, indirectly suggesting that elevated exposure to drinkers and drinking leads them to develop these expectations. This explanation is consistent with findings from earlier work with these families (40, 41) showing that, even in preschool, children of parents who drink heavily have a perspective that is influenced by parental drinking. They project significantly greater alcohol use onto common social situations and the level of their attribution is predicted by level of self-reported parental drinking. However, this finding is at odds with the work of Miller (16) who found that positive expectancies were lower in children with family history of alcoholism. Concordance of more extreme substance use behaviors (e.g., frequent intoxication) had stronger effects on marital satisfaction (42), and this increased concordance is related to higher levels of positive marital behaviors (43) which in turn is related to less family discord. Children in these families may develop positive expectancies if they perceive their parents drinking together leads to lower discord.
Social/relaxation expectancies were related to earlier onset of problematic drinking, but not onset of any drinking. Onset of drinking is driven by contextual factors such as availability in addition to social status needs for peer popularity and approval. This also explains why cognitive and arousal expectancies were not related to onset of drinking, first drunkenness or first binge drink. Given that early use is driven to a large degree by social motives, the behaviors related to cognitive and arousal expectancies would not be as salient. Previous research has also found that expectancies are differentially related to drinking behavior, although studies differ about which expectancies are related to which outcome (3, 44–50).
Our findings do not support the conclusion that third and fourth grades (approximately ages 9–11) are a critical period for accelerated expectancy development (16). The reasons for these differences in findings are unclear, although study differences may account for some of them. The present study involves high risk children who are more likely on course to an alcoholic outcome than the Smith study, which involves a general population sample. Children in high-risk environments may have early experience that plays a stronger role in shaping expectancy development than the general population, where later social-contextual factors would be anticipated to be more important. In addition, boys were overrepresented in the current sample. However, results indicate that boys and girls have similar patterns of relationships of expectancies with drinking. Finally, the work was carried out in a Midwestern state, in an area where ethnic and racial minorities were poorly represented. Therefore, transferability of our findings to general populations needs to be considered with caution.
Despite the advantages conveyed by this study’s longitudinal design, and the very early start in observing the process of expectancy development, there are also some other limitations. A lapse in funding led to higher levels of missing data in the youngest assessment. Since these data were missing due to a cause unrelated to the participant characteristics, they are missing completely at random and will not cause bias in the results (51), but the extra missing data leads to higher error in estimation of expectancies in that age range. There was also lower expectancy scale reliability in earlier ages. This is probably due to less solidified understanding of the effects of alcohol at these earlier ages. The Negative Affect Arousal factor also showed lower reliability throughout the time course, making results related to it less definitive than the other scales which showed better reliability.
In conclusion, we found that higher social/relaxation alcohol expectancies in early life predicted earlier onset of problematic drinking. Moreover, once drinking begins the development of social/relaxation expectancies increases and accelerates over its previous rate of growth.
Acknowledgments
This activity was supported by NIH R37 AA07065 (RAZ) and K01AA016591 (AB)
Footnotes
Conflict of interest declaration: None
References
- 1.Goldman MS, Boca FKD, Darkes J. Alcohol expectancy theory: the application of cognitive neuroscience. In: Leonard KE, Blane HT, editors. Pschological theories of drinking and alcoholism. 2. New York: Guilford; 1999. pp. 203–46. [Google Scholar]
- 2.Brown SA, Creamer VA, Stetson BA. Adolescent alcohol expectancies in relation to personal and parental drinking patterns. Journal of abnormal psychology. 1987;96(2):117–21. doi: 10.1037//0021-843x.96.2.117. [DOI] [PubMed] [Google Scholar]
- 3.Mann LM, Chassin L, Sher KJ. Alcohol expectancies and the risk for alcoholism. Journal of Consulting & Clinical Psychology. 1987;55(3):411–7. doi: 10.1037//0022-006x.55.3.411. [DOI] [PubMed] [Google Scholar]
- 4.Shen S, Locke Wellman J, Hill SY. Adolescent alcohol expectancies in offspring from families at high risk for developing alcoholism. Journal of Studies on Alcohol. 2001 Nov;62(6):763–72. doi: 10.15288/jsa.2001.62.763. [DOI] [PubMed] [Google Scholar]
- 5.Dunn ME, Goldman MS. Age and drinking-related differences in the memory organization of alcohol expectances in 3rd-, 6th-, 9th-, and 12th-grade children. Journal of Consulting & Clinical Psychology. 1998;66(3):579–85. doi: 10.1037//0022-006x.66.3.579. [DOI] [PubMed] [Google Scholar]
- 6.O'Connor RM, Fite PJ, Nowlin PR, Colder CR. Children's beliefs about substance use: an examination of age differences in implicit and explicit cognitive precursors of substance use initiation. Psychol Addict Behav. 2007 Dec;21(4):525–33. doi: 10.1037/0893-164X.21.4.525. Epub 2007/12/13. eng. [DOI] [PubMed] [Google Scholar]
- 7.Gunn RL, Smith GT. Risk factors for elementary school drinking: Pubertal status, personality, and alcohol expectancies concurrently predict fifth grade alcohol consumption. Psychology of Addictive Behaviors. 2010;24(4):617–27. doi: 10.1037/a0020334. First Author & Affiliation: Gunn, Rachel L. [DOI] [PMC free article] [PubMed] [Google Scholar]
- 8.Aas HN, Leigh BC, Anderssen N, Jakobsen R. Two-year longitudinal study of alcohol expectancies and drinking among Norwegian adolescents. Addiction. 1998;93(3):373–84. doi: 10.1046/j.1360-0443.1998.9333736.x. [DOI] [PubMed] [Google Scholar]
- 9.Bauman KE, Fisher LA, Bryan ES, Chenoweth RL. Relationship between subjective expected utility and behavior: A longitudinal study of adolescent drinking behavior. Journal of Studies on Alcohol. 1985;46(1):32–8. doi: 10.15288/jsa.1985.46.32. [DOI] [PubMed] [Google Scholar]
- 10.Smith GT, Goldman MS, Greenbaum PE, Christiansen BA. Expectancy for social facilitation from drinking: The divergent paths of high-expectancy and low-expectancy adolescents. Journal of abnormal psychology. 1995;104(1):32–40. doi: 10.1037//0021-843x.104.1.32. [DOI] [PubMed] [Google Scholar]
- 11.Sher KJ, Wood MD, Wood PK, Raskin G. Alcohol outcome expectancies and alcohol use: a latent variable cross-lagged panel study. Journal of abnormal psychology. 1996 Nov;105(4):561–74. doi: 10.1037/0021-843X.105.4.561. Epub 1996/11/01. eng. [DOI] [PubMed] [Google Scholar]
- 12.Patrick ME, Wray-Lake L, Finlay AK, Maggs JL. The long arm of expectancies: adolescent alcohol expectancies predict adult alcohol use. Alcohol Alcohol. 2010 Jan-Feb;45(1):17–24. doi: 10.1093/alcalc/agp066. Epub 2009/10/08. eng. [DOI] [PMC free article] [PubMed] [Google Scholar]
- 13.Bekman NM, Goldman MS, Worley MJ, Anderson KG. Pre-adolescent alcohol expectancies: critical shifts and associated maturational processes. Exp Clin Psychopharmacol. 2011 Dec;19(6):420–32. doi: 10.1037/a0025373. Epub 2011/09/29. eng. [DOI] [PMC free article] [PubMed] [Google Scholar]
- 14.Dunn ME, Goldman MS. Empirical modeling of an alcohol expectancy memory network in elementary school children as a function of grade. Experimental & Clinical Psychopharmacology. 1996;4(2):209–17. [Google Scholar]
- 15.Kraus D, Smith GT, Ratner HH. Modifying alcohol-related expectancies in grade-school children. Journal of Studies on Alcohol. 1994;55(5):535–42. doi: 10.15288/jsa.1994.55.535. [DOI] [PubMed] [Google Scholar]
- 16.Miller PM, Smith GT, Goldman MS. Emergence of alcohol expectancies in childhood: A possible critical period. Journal of Studies on Alcohol. 1990;51(4):343–9. doi: 10.15288/jsa.1990.51.343. [DOI] [PubMed] [Google Scholar]
- 17.Cumsille PE, Sayer AG, Graham JW. Perceived exposure to peer and adult drinking as predictors of growth in positive alcohol expectancies during adolescence. Journal of Consulting & Clinical Psychology. 2000;68(3):531–6. [PubMed] [Google Scholar]
- 18.Zucker RA, Ellis DA, Fitzgerald HE, Bingham CR, Sanford K. Other evidence for at least two alcoholisms II: Life course variation in antisociality and heterogeneity of alcoholic outcome. Development and Psychopathology. 1996;8:831–48. [Google Scholar]
- 19.Zucker RA, Fitzgerald HE, Refior SK, Puttler LI, Pallas DM, Ellis DA. The clinical and social ecology of childhood for children of alcoholics: Description of a study and implications for a differentiated social policy. In: Fitzgerald HE, Lester BM, Zuckerman BS, editors. Children of addiction: Research, health and policy issues. New York: Routledge Falmer; 2000. pp. 109–41. [Google Scholar]
- 20.Feighner JP, Robins E, Guze SB, Woodruff RA, Jr, Winokur G, Munoz R. Diagnostic criteria for use in psychiatric research. Arch Gen Psychiatry. 1972 Jan;26(1):57–63. doi: 10.1001/archpsyc.1972.01750190059011. [DOI] [PubMed] [Google Scholar]
- 21.Fitzgerald HE, Zucker RA, Noll RB. Unpublished manuscript. East Lansing, MI: Michigan State University; 1990. The Beverage Opinion Questionnaire. [Google Scholar]
- 22.Cranford JA, Zucker RA, Jester JM, Puttler LI, Fitzgerald HE. Parental alcohol involvement and adolescent alcohol expectancies predict alcohol involvement in male adolescents. Psychol Addict Behav. 2010 Sep;24(3):386–96. doi: 10.1037/a0019801. [DOI] [PMC free article] [PubMed] [Google Scholar]
- 23.Christiansen BA, Goldman MS, Inn A. Development of alcohol-related expectancies in adolescents: Separating pharmacological from social-learning influences. Journal of Consulting & Clinical Psychology. 1982;50(3):336–44. doi: 10.1037//0022-006x.50.3.336. [DOI] [PubMed] [Google Scholar]
- 24.Muthén L, Muthén B. Mplus User's Guide. 5. Los Angeles, CA: Muthén & Muthén; 1998–2007. [Google Scholar]
- 25.Zucker RA, Fitzgerald HE, Noll RB. Form for Youth, V3. 1993. Drinking and drug history. [Google Scholar]
- 26.Donovan JE. Estimated blood alcohol concentrations for child and adolescent drinking and their implications for screening instruments. Pediatrics. 2009 Jun;123(6):e975–81. doi: 10.1542/peds.2008-0027. Epub 2009/06/02. eng. [DOI] [PMC free article] [PubMed] [Google Scholar]
- 27.Robins LN, Helzer JE, Croughan JL, Ratcliff KS. The NIMH Diagnostic Interview Schedule: Its history, characteristics and validity. St. Louis, MO: Washington University School of Medicine; 1980. [Google Scholar]
- 28.Zucker RA, Fitzgerald HE, Noll RB. Drinking and drug history. 4. East Lansing, Michigan: Michigan State University; 1990. unpublished instrument. [Google Scholar]
- 29.Singer JD, Willett JB. It's about time: Using discrete-time survival analysis to study duration and the timing of events. Journal of Educational Statistics. 1993;18(2):155–95. [Google Scholar]
- 30.SAS. SAS System for Windows. 9.1. Cary, NC: SAS Institute, Inc; 1999–2001. [Google Scholar]
- 31.Allison P. Survival Analysis using the SAS System: A Practical Guide. Cary, NC: SAS Institute Inc; 1995. [Google Scholar]
- 32.Jester JM, Nigg JT, Adams K, Fitzgerald HE, Puttler LI, Wong MM, et al. Inattention/hyperactivity and aggression from early childhood to adolescence: heterogeneity of trajectories and differential influence of family environment characteristics. Dev Psychopathol. 2005 Winter;17(1):99–125. doi: 10.1017/50954579405050066. [DOI] [PMC free article] [PubMed] [Google Scholar]
- 33.Muthén B, Satorra A. Complex sample data in structural equation modeling. Sociological Methodology. 1995;25:267–316. [Google Scholar]
- 34.Singer JD, Willett JB. Applied longitudinal data analysis : modeling change and event occurrence. Oxford ; New York: Oxford University Press; 2003. [Google Scholar]
- 35.Schafer JL. Analysis of incomplete multivariate data. London, New York: Chapman & Hall; 1997. [Google Scholar]
- 36.Henry KL, McDonald JN, Oetting ER, Walker PS, Walker RD, Beauvais F. Age of onset of first alcohol intoxication and subsequent alcohol use among urban American Indian adolescents. Psychol Addict Behav. 2011 Mar;25(1):48–56. doi: 10.1037/a0021710. Epub 2011/01/20. eng. [DOI] [PMC free article] [PubMed] [Google Scholar]
- 37.Hingson R, Heeren T, Winter MR, Wechsler H. Early age of first drunkenness as a factor in college students' unplanned and unprotected sex attributable to drinking. Pediatrics. 2003 Jan;111(1):34–41. doi: 10.1542/peds.111.1.34. Epub 2003/01/02. eng. [DOI] [PubMed] [Google Scholar]
- 38.Hingson R, Heeren T, Zakocs R, Winter M, Wechsler H. Age of first intoxication, heavy drinking, driving after drinking and risk of unintentional injury among U.S. college students. J Stud Alcohol. 2003 Jan;64(1):23–31. doi: 10.15288/jsa.2003.64.23. Epub 2003/03/01. eng. [DOI] [PubMed] [Google Scholar]
- 39.Morean ME, Corbin WR, Fromme K. Age of first use and delay to first intoxication in relation to trajectories of heavy drinking and alcohol-related problems during emerging adulthood. Alcohol Clin Exp Res. 2012 Nov;36(11):1991–9. doi: 10.1111/j.1530-0277.2012.01812.x. Epub 2012/08/18. eng. [DOI] [PMC free article] [PubMed] [Google Scholar]
- 40.Noll RB, Zucker RA, Greenberg GS. Identification of alcohol by smell among preschoolers: Evidence for early socialization about drugs occurring in the home. Child Development. 1990;61(5):1520–7. [PubMed] [Google Scholar]
- 41.Zucker RA, Kincaid SB, Fitzgerald HE, Bingham CR. Alcohol schema acquisition in preschoolers: Differences between children of alcoholics and children of nonalcoholics. Alcoholism: Clinical & Experimental Research. 1995;19(4):1011–7. doi: 10.1111/j.1530-0277.1995.tb00982.x. [DOI] [PubMed] [Google Scholar]
- 42.Mudar P, Leonard KE, Soltysinski K. Discrepant substance use and marital functioning in newlywed couples. Journal of consulting and clinical psychology. 2001 Feb;69(1):130–4. doi: 10.1037//0022-006x.69.1.130. [DOI] [PubMed] [Google Scholar]
- 43.Floyd FJ, Cranford JA, Daugherty MK, Fitzgerald HE, Zucker RA. Marital interaction in alcoholic and nonalcoholic couples: alcoholic subtype variations and wives' alcoholism status. Journal of abnormal psychology. 2006 Feb;115(1):121–30. doi: 10.1037/0021-843X.115.1.121. [DOI] [PMC free article] [PubMed] [Google Scholar]
- 44.Bekman NM, Anderson KG, Trim RS, Metrik J, Diulio AR, Myers MG, et al. Thinking and drinking: alcohol-related cognitions across stages of adolescent alcohol involvement. Psychol Addict Behav. 2011 Sep;25(3):415–25. doi: 10.1037/a0023302. Epub 2011/05/04. eng. [DOI] [PMC free article] [PubMed] [Google Scholar]
- 45.Christiansen BA, Goldman MS. Alcohol-related expectancies versus demographic/background variables in the prediction of adolescent drinking. Journal of Consulting & Clinical Psychology. 1983;51(2):249–57. doi: 10.1037//0022-006x.51.2.249. [DOI] [PubMed] [Google Scholar]
- 46.Christiansen BA, Smith GT, Roehling PV, Goldman MS. Using alcohol expectancies to predict adolescent drinking behavior after one year. Journal of Consulting & Clinical Psychology. 1989;57(1):93–9. doi: 10.1037//0022-006x.57.1.93. [DOI] [PubMed] [Google Scholar]
- 47.Killen JD, Hayward C, Wilson DM, Haydel KF, et al. Predicting onset of drinking in a community sample of adolescents: The role of expectancy and temperament. Addictive Behaviors. 1996;21(4):473–80. doi: 10.1016/0306-4603(95)00077-1. [DOI] [PubMed] [Google Scholar]
- 48.Newcomb MD, Chou CP, Bentler PM, Huba GJ. Cognitive motivations for drug use among adolescents: Longitudinal tests of gender differences and predictors of change in drug use. Journal of Counseling Psychology. 1988;35(4):426–38. [Google Scholar]
- 49.Rather BC. Using the Alcohol Expectancy Questionnaire-Adolescent Form to predict college drinking: long versus short forms. Addict Behav. 1990;15(6):567–72. doi: 10.1016/0306-4603(90)90058-6. Epub 1990/01/01. eng. [DOI] [PubMed] [Google Scholar]
- 50.Reese FL, Chassin L, Molina BSG. Alcohol expectancies in early adolescents: Predicting drinking behavior from alcohol expectancies and parental alcoholism. Journal of Studies on Alcohol. 1994;55(3):276–84. doi: 10.15288/jsa.1994.55.276. [DOI] [PubMed] [Google Scholar]
- 51.Schafer JL, Graham JW. Missing data: Our view of the state of the art. Psychological Methods. 2002;7(2):147–77. [PubMed] [Google Scholar]