

Abstract
Rationale: Most immunocompetent patients diagnosed with latent tuberculosis infection (LTBI) will not progress to tuberculosis (TB) reactivation. However, current diagnostic tools cannot reliably distinguish nonprogressing from progressing patients a priori, and thus LTBI therapy must be prescribed with suboptimal patient specificity. We hypothesized that LTBI diagnostics could be improved by generating immunomarker profiles capable of categorizing distinct patient subsets by a combinatorial immunoassay approach.
Objectives: A combinatorial immunoassay analysis was applied to identify potential immunomarker combinations that distinguish among unexposed subjects, untreated patients with LTBI, and treated patients with LTBI and to differentiate risk of reactivation.
Methods: IFN-γ release assay (IGRA) was combined with a flow cytometric assay that detects induction of CD25+CD134+ coexpression on TB antigen–stimulated T cells from peripheral blood. The combinatorial immunoassay analysis was based on receiver operating characteristic curves, technical cut-offs, 95% bivariate normal density ellipse prediction, and statistical analysis. Risk of reactivation was estimated with a prediction formula.
Measurements and Main Results: Sixty-five out of 150 subjects were included. The combinatorial immunoassay approach identified at least four different T-cell subsets. The representation of these immune phenotypes was more heterogeneous in untreated patients with LTBI than in treated patients with LTBI or unexposed groups. Patients with IGRA(+) CD4+CD25+CD134+ T-cell phenotypes had the highest estimated reactivation risk (4.11 ± 2.11%).
Conclusions: These findings suggest that immune phenotypes defined by combinatorial assays may potentially have a role in identifying those at risk of developing TB; this potential role is supported by risk of reactivation modeling. Prospective studies will be needed to test this novel approach.
Keywords: biomarker, flow cytometry, immunoassay, latent tuberculosis infection, tuberculosis
At a Glance Commentary
Scientific Knowledge on the Subject
The majority of immunocompetent patients diagnosed with latent tuberculosis infection (LTBI) will not progress to tuberculosis (TB) reactivation. Diagnostic testing for LTBI suboptimally predicts patients who will progress to TB reactivation; however, LTBI treatment greatly reduces this risk. Better biomarkers and diagnostics for LTBI to improve patient risk stratification could potentially translate into more targeted treatment selections and improved prevention strategies.
What this Study Adds to the Field
We report a combinatorial immunoassay approach that succeeded in visualizing distinct immune reactive subsets between unexposed subjects, untreated patients with LTBI, and treated patients with LTBI, which preliminarily correlated with distinct TB reactivation risk predictions. From our study, LTBI appears to represent a spectrum of immune reactivities of host–pathogen interactions associated with different risks of reactivation. We propose these candidate immune biomarker profiles be prospectively assessed for reactivation risk stratification in LTBI.
Assessment of reactivation risk for patients with latent tuberculosis infection (LTBI) remains challenging. Approximately 90% of immunocompetent individuals with LTBI will never develop active TB (1). In fact, 80% of human lung calcified granulomas do not contain viable Mycobacterium tuberculosis (MTB) (2), suggesting that most immunocompetent individuals can either clear or effectively contain infection (3–5). Therefore, new biomarkers to reliably identify the 10% of immunocompetent patients with LTBI with reactivation potential are highly desirable. In current practice, diagnosis of patients with LTBI is based on immunoassays with positive reactivity and clinical assessment of prior TB exposure(s) and reactivation risk (6, 7). Immunoassays for LTBI include tuberculin skin test (TST); IFN-γ release assays (IGRA); and investigationally, flow cytometry (FC)-based assays of T-cell markers (8–10). Because these tests assess cell-mediated immune responses against MTB antigens, positivity can potentially result from the following: (1) active but incompletely effective anti-MTB immune responses; (2) active, effective immune containment (e.g., calcified granuloma); (3) immune memory after completely effective bacterial clearance; or (4) false-positive reactions (3–5). The first scenario, and potentially in the second scenario (if a patient develops immunosuppression), represent situations where patients truly require treatment, but no single immunoassay distinguishes these patient subsets from the other immune-reactive subsets (3, 5). Despite these limitations and treatment risks, LTBI treatment confers a clinical state of low-risk of TB reactivation (11, 12). Thus, the field would benefit from improved LTBI diagnostics to better identify the patient subsets in need of treatment.
Our study premise is that MTB immunoreactivity differentiates patients at high versus low risk of TB reactivation. We decided to compare MTB antigen–specific responses between unexposed subjects, untreated patients with LTBI, and treated patients with LTBI. We hypothesized that the resulting immunoreactivity profiles are different between these subject subgroups and that these signatures would allow reactivation risk stratification of patients with LTBI. These candidate biomarker profile subsets are based on the combinatorial analysis of IGRA with a FC assay assessing TB antigen–induced T-cell expression of CD25 (IL-2 receptor α-chain) and CD134 (OX40, a TNF-α receptor superfamily member). Activation-induced expression and engagement of CD25 and CD134 are critical for T-cell survival, proliferation, and cytokine production upon antigen-specific activation (13, 14). FC detection of CD4+CD25+CD134+ T cells has been shown to greatly increase detection of antigen-specific activated effector T cells in various infections, including TB, when compared with FC detection of intracellular IFN-γ production (15). Furthermore, detection of CD4+CD25+CD134+ T cells in LTBI cases with and without HIV coinfection was reported recently (16).
The present work proposes that the strategy of combinatorial multiimmunoassay analysis may be capable of generating novel immune profiles that may distinguish infection and treatment status and potential risk of TB reactivation. Some of the results of these studies have been previously reported in the form of abstracts (17, 18).
Methods
Subjects
The study was approved by the Mayo Clinic Institutional Review Board and Olmsted County Public Health Services. Study participants were enrolled between August 2010 and December 2012. For this study, only unexposed subjects; previously untreated, highly suspected patients with LTBI; and treated patients with LTBI were included. Unexposed subjects were included if individuals had no known TB exposures and negative TST results. Highly suspected LTBI cases were defined as asymptomatic patients with positive TB risk factors and both TST(+) and prior IGRA(+) results or TST(+) conversion and prior IGRA(−) results following current guidelines (6). The Online TST/IGRA calculator was used to estimate the cumulative risk of TB reactivation in all subjects (19). Additional details about the study subjects, LTBI treatment, and estimation of individual risk of TB reactivation are provided in the online supplement.
Sample Collection and Processing
Peripheral blood mononuclear cells (PBMCs) for FC were isolated by Ficoll gradient centrifugation from 40 ml of heparinized blood within 1 hour of collection. After isolation, aliquots of all PBMC samples were cryopreserved in liquid nitrogen until analysis. In addition, 3 ml of the original blood sample was sent for same-day QuantiFERON-TB Gold In-Tube (QFT) testing to the clinical laboratories at Mayo Clinic. For FC assays, thawed PBMC samples (viability ≥85%) were subjected to antigen stimulation as previously described (20). A multiparametric FC method was used to analyze cells stimulated with MTB-specific antigens (region of difference 1 [RD1] peptides), MTB-purified protein derivative (PPD), or positive or negative controls. Further details are provided in the online supplement.
T-Cell CD25+CD134+ Coexpression FC Assay
The PBMC samples were incubated for 48 hours at 37°C with the indicated antigens or controls as described above and then stained with fluorescent dye–conjugated anti-CD3, anti-CD4, anti-CD8, anti-CD25, and anti-CD134 antibodies. The FC gating strategies were optimized to avoid detecting false-positive signals and to accurately detect T-cell subsets (21, 22). Analysis was gated on viable lymphocytes and CD3+ cells (T cells). The percentage of antigen-stimulated CD25+CD134+ cells over background was determined (8). Additional details about antigen formulation, T-cell stimulation, and FC methods are provided in the online supplement.
Clinical IGRA Testing
The QFT was performed as recommended by the manufacturer (Qiagen GmbH, Hilden, Germany) (23). A cut-off level of IFN-γ ≥0.35 IU/ml and >50% above negative control (nil) defined a QFT(+) test. Clinical laboratory technicians were blinded to the results of the FC.
Statistical Analysis
Results were compared using the χ2 test for categorical variables (Fisher’s exact test for cells with numbers ≤5) and two-sided parametric or nonparametric tests for continuous variables as appropriate. Receiver operating characteristic curves defined the sensitivity and specificity of the diagnostic assays, and cut-offs were determined to best differentiate unexposed versus untreated subjects with LTBI and untreated versus treated subjects with LTBI. A bivariate normal density ellipse with 95% coverage was applied to group subsets of interest in plots of combinatorial test results. P values ≤0.05 were considered statistically significant. Data were analyzed using JMP software, version 9.0.1 (SAS Institute, Inc., Cary, NC).
Results
Study Subjects
We consecutively screened 150 subjects from August 2010 through December 2012. Sixty-five of 150 subjects fulfilled the study inclusion criteria, including 27 unexposed healthy subjects, 21 with untreated patients with LTBI, and 17 patients with LTBI who successfully completed LTBI therapy (Table 1). Several patients had a longstanding history of LTBI diagnosis, with average time since initial diagnosis (untreated patients) and initiation of LTBI treatment (treated patients) of 172.3 and 81.4 months, respectively (P > 0.05) (Table 1). Most study participants in each group were healthcare workers, but the risk of prior TB exposure(s) differed between the unexposed group and the group of patients with LTBI that included foreign-born individuals from TB endemic areas (Table 1). Fourteen out of 21 (63.6%) untreated patients with LTBI had prior QFT(+) results during their original LTBI diagnosis, of which 12 (57.1%) remained QFT(+) during our study testing. For previously treated patients with LTBI, 13 out of 17 (76.5%) had prior QFT(+) results, whereas nine of these patients remained QFT(+) (52.9%) during our study. Overall, there were no significant differences in baseline patient characteristics between untreated and treated LTBI patients, except for male predominance in the former group (90.0 vs. 47.1%; P = 0.042) (Table 1).
Table 1.
Characteristics of Study Subjects
| Demographics | Unexposed Control Subjects (n = 27) | Untreated LTBI Subjects (n = 21) | Treated LTBI Subjects (n = 17) | P Value* | |
|---|---|---|---|---|---|
| Male, n (%) | 13 (48.2) | 17 (90.0) | 8 (47.1) | 0.042 | |
| Age, yr | |||||
| Mean ± SD | 32.7 ± 13.5 | 51.3 ± 20.9 | 47.2 ± 14.2 | 0.476† | |
| Range | 20–74 | 19–91 | 27–68 | ||
| Ethnicity, n (%) | 0.319 | ||||
| White | 23 (85.2) | 10 (47.6) | 12 (70.6) | ||
| African American | 0 (0) | 6 (28.5) | 1 (5.9) | ||
| Asian Pacific | 2 (7.4) | 3 (14.3) | 3 (17.6) | ||
| Hispanics | 2 (7.4) | 1 (4.8) | 0 (0) | ||
| Others | 0 (0) | 1 (4.8) | 1 (5.9) | ||
| Place born, n (%)‡ | 0.662 | ||||
| United States | 27 (100) | 9 (42.8) | 10 (58.8) | ||
| Foreign born (high TB) | 0 (0) | 11 (52.4) | 6 (35.3) | ||
| Foreign born (low TB) | 0 (0) | 1 (4.8) | 1 (5.9) | ||
| History of BCG vaccination, n (%) | 0.137 | ||||
| Yes | 0 (0) | 10 (47.6) | 3 (17.6) | ||
| No | 27 (100.0) | 10 (47.6) | 11 (64.7) | ||
| Unknown | 0 (0) | 1 (4.8) | 3 (17.7) | ||
| Occupation, n (%) | 0.625 | ||||
| HCW, direct patient contact | 0 (0) | 12 (57.1) | 8 (47.0) | ||
| HCW, no direct patient contact | 21 (77.8) | 4 (10.1) | 6 (35.3) | ||
| Other | 6 (22.2) | 5 (23.8) | 3 (17.7) | ||
| Likelihood of TB contact, n (%)§ | 0.134 | ||||
| Close contact or prior TB | 0 (0) | 2 (9.2) | 0 (0) | ||
| Probable TB contact | 0 (0) | 13 (61.9) | 7 (41.2) | ||
| Possible TB contact | 0 (0) | 6 (28.6) | 10 (58.8) | ||
| Unlikely TB contact | 27 (100.0) | 0 (0) | 0 (0) | ||
| TST/IGRA category, n (%) | 0.306 | ||||
| TST(−)/IGRA(−) | 25 (92.6) | 0 (0) | 0 (0) | ||
| TST(+)/IGRA(−) | 0 (0) | 7 (31.8) | 4 (23.5) | ||
| TST(+)/IGRA(+) | 0 (0) | 14 (63.6) | 11 (64.7) | ||
| TST(−)/IGRA(+) | 0 (0) | 0 (0) | 2 (11.8) | ||
| Unknown TST/IGRA(−) | 2 (7.4) | 0 (0) | 0 (0) | ||
| Time from initial LTBI diagnosis and treatment, mo, mean ± SD | — | 150.8 ± 293.7 | 81.4 ± 40.7 | 0.297§ |
Definition of abbreviations: BCG = bacillus Calmette-Guérin; HCW = healthcare worker; high TB = high incidence of tuberculosis; IGRA = IFN-γ release assay; low TB = low incidence of tuberculosis; LTBI = latent tuberculosis infection; TB = tuberculosis; TST = tuberculin skin test.
P values for comparison between untreated patients with LTBI and previously treated patients with LTBI (Fisher’s exact test or r × c exact contingency table when appropriate).
P value for comparison of two groups of LTBI cases by Student's t test.
High incidence of TB was defined as a country with ≥20 cases per 100,000 population per year 2014 WHO global tuberculosis report (51).
Probable TB contacts include HCWs and medical students with direct patient contact or who worked in settings where patients with TB may be treated. Probable TB contact was also defined as foreign-born individuals living for ≥5 yr in high-incidence TB areas. Possible TB contacts include HCWs and personnel who do not have direct patient contact or who work in areas where patients with TB may be treated. Possible TB contact was also defined as foreign-born individuals living for ≤5 yr in high-incidence TB areas.
Diagnostic Performance of Immunodiagnostic Assays
An FC assay for T-cell coexpression of CD25 and CD134 was analyzed by gating on live lymphocytes (Figure 1A) expressing either CD4 (Figures 1B and 1C) or CD8 (Figures 1D and 1E). Results show that MTB antigen stimulation induced responding T cells to up-regulate CD25+CD134+ coexpression, identified by the appearance of copositive cells in the upper right quadrants of the FC plots (Figures 1C and 1E). In parallel, IGRA data were provided by the QFT assay. The QFT and FC assay results showed nonparametric distributions. Thus, all tests were compared across groups with the Dunn’s method of multiple comparisons (Table 2). Additional case examples are available in the online supplement (Figures E1 and E2).
Figure 1.

Flow cytometric gating strategy for detection of percentage of activated T cells (CD3+CD4+ and CD3+CD8+) coexpressing CD25+CD134+ markers in a suspected latent tuberculosis infection (LTBI) case [prior TST(+)/IGRA(+) results]. (A) Viable lymphocyte gate using side and forward scatter. (B) Gate on CD3+/CD4+. (C) Percentage of CD3+CD4+/CD25+CD134+ coexpression (right upper quadrant box) after 48 hours of incubation with an unstimulated sample, purified protein derivative (PPD), and an ESAT-6/CFP-10 peptide mixture antigen (region of difference 1 [RD1] antigen). (D) Gate on CD3+/CD8+. (E) Percentage of CD3+CD8+/CD25+CD134+ coexpression with an unstimulated sample, PPD, and RD1 antigen. Percentages (boxes) indicate the calculated distribution of CD25+CD134+ among CD3+CD4+ T cells after the subtraction of background (negative control). Ag = antigen; FCS-A = forward scatter; IGRA = interferon-γ release assay; SSC-A = side scatter; TST = tuberculin skin test. This case example was not included in the study owing to unclear history of completion of LTBI therapy. Study-generated QuantiFERON TB Gold In-Tube was 7.52 IU/ml. Additional case examples are available in Figures E1 and E2 in the online supplement.
Table 2.
Immunodiagnostic Assays Results and Multiple Comparisons
| Unexposed Subjects (n = 27) | Untreated Subjects with LTBI (n = 21) | Treated Subjects with LTBI (n = 17) | P Value* | P Value† | |
|---|---|---|---|---|---|
| QuantiFERON TB Gold In-Tube, IU/ml | |||||
| Mean ± SD | 0.01 ± 0.02 | 4.17 ± 5.48 | 3.31 ± 4.59 | ||
| Median (IQR) | 0 (0.0–0.01) | 0.69 (0.03–10.25) | 0.89 (0.02–5.98) | ||
| %CD3+CD4+/CD25+CD134+ (RD1 peptides − nil) | <0.0001 | 0.022 | |||
| Mean ± SD | 0.01 ± 0.02 | 0.57 ± 0.89 | 0.06 ± 0.13 | ||
| Median (IQR) | 0 (0.0–0.0) | 0.05 (0.0–0.84) | 0 (0.0–0.04) | ||
| %CD3+CD4+/CD25+CD134+ (PPD − nil) | 0.005 | 0.213 | |||
| Mean ± SD | 0.56 ± 1.95 | 1.24 ± 1.54 | 0.23 ± 0.31 | ||
| Median (IQR) | 0 (0.0–0.16) | 0.39 (0.03–2.40) | 0.20 (0.0–0.27) | ||
| %CD3+CD4+/CD25+CD134+ (Candida Ag − nil) | 1.00 | 0.600 | |||
| Mean ± SD | 0.52 ± 0.60 | 1.01 ± 1.58 | 0.33 ± 0.42 | ||
| Median (IQR) | 0.25 (0.0–1.03) | 0.31 (0.05–1.65) | 0.12 (0.0–0.53) | ||
| %CD3+CD4+/CD25+CD134+ (SEAB/anti-CD3 − nil) | 1.00 | 0.385 | |||
| Mean ± SD | 4.26 ± 3.67 | 3.66 ± 4.08 | 6.25 ± 5.45 | ||
| Median (IQR) | 4.26 (1.15–5.29) | 2.23 (0.01–6.74) | 5.15 (1.89–9.80) | ||
| %CD3+CD8+/CD25+CD134+ (RD1 peptides − nil) | 0.002 | 0.614 | |||
| Mean ± SD | 0.15 ± 0.37 | 0.49 ± 0.66 | 0.27 ± 0.36 | ||
| Median (IQR) | 0.02 (0.0–0.12) | 0.26 (0.05–0.71) | 0.14 (0.02–0.37) | ||
| %CD3+CD8+/CD25+CD134+ (PPD − nil) | 0.001 | <0.001 | |||
| Mean ± SD | 0.06 ± 0.14 | 0.28 ± 0.25 | 0.06 ± 0.12 | ||
| Median (IQR) | 0.0 (0.0–0.07) | 0.21 (0.06–0.56) | 0.0 (0.0–0.04) | ||
| %CD3+CD8+/CD25+CD134+ (Candida Ag − nil) | 0.908 | 0.099 | |||
| Mean ± SD | 0.09 ± 0.15 | 0.18 ± 0.26 | 0.04 ± 0.07 | ||
| Median (IQR) | 0.02 (0.0–0.16) | 0.07 (0.0–0.25) | 0.0 (0.0–0.07) | ||
| %CD3+CD8+/CD25+CD134+ (SEAB/anti-CD3 − nil) | 0.455 | 0.394 | |||
| Mean ± SD | 0.78 ± 0.92 | 0.45 ± 0.61 | 1.01 ± 1.17 | ||
| Median (IQR) | 0.66 (0.26–0.83) | 0.13 (0.0–0.78) | 0.59 (0.03–1.54) |
Definition of abbreviations: Ag = antigen; anti-CD3 = anti-CD3 monoclonal antibodies; IQR = interquartile range; LTBI = latent tuberculosis infection; nil = negative control; PPD = purified protein derivative; RD1 = region of difference 1; SEAB = staphylococcal enterotoxin A and B.
P values for comparison between unexposed subjects and untreated LTBI cases by the Dunn’s method for multiple comparison.
P value for comparison between treated and untreated LTBI cases by the Dunn’s method for multiple comparison.
We first assessed the degree to which our FC assays displayed similar diagnostic performance compared with the QFT assay to differentiate unexposed subjects from untreated patients with LTBI. The results of QFT and FC assays for CD3+CD4+ and CD3+CD8+ T cells with RD1 peptide and PPD stimulations showed a range of diagnostic accuracies from 74.3 to 84.7% (Figures 2A–2E). We determined test cut-offs that best differentiated these two study groups (Table 3). Our estimated cut-off for QFT was 0.31 IU/ml; however, we used the cut-off recommended by the manufacturer. We conclude that the diagnostic accuracy of the FC assay for CD3+CD4+ with RD1 peptides and FC assay for CD3+CD8+ T cells with PPD was comparable with the IGRA assay performed in this work.
Figure 2.

Receiver operating characteristic curves and diagnostic performance of study assays in unexposed subjects and untreated patients with latent tuberculosis infection. (A) QuantiFERON TB Gold In-Tube (i.e., region of difference 1 [RD1] peptides). (B) Flow cytometry (FC) assay detection of percentage of CD25+CD134+ coexpression in RD1 antigen–stimulated CD3+CD4+ T cells. (C) FC assay detection of the percentage of CD25+CD134+ coexpression in purified protein derivative (PPD)-stimulated CD3+CD4+ T cells. (D) FC assay detection of percentage of CD25+CD134+ coexpression in RD1 antigen–stimulated CD3+CD8+ T cells. (E) FC assay detection of percentage of CD25+CD134+ coexpression in PPD-stimulated CD3+CD8+ T cells. (F) Diagnostic performance parameters of each test associated with the receiver operating characteristic analysis. Ag = antigen; AUC = area under the curve (i.e., diagnostic accuracy); nil = negative control.
Table 3.
Diagnostic Performance Measurements and Cut-offs of Immunodiagnostic Tests That Best Differentiate Unexposed Subjects and Untreated Patients with Latent Tuberculosis Infection
| Immunodiagnostic test | Diagnostic Accuracy | Sensitivity | Specificity | Test Cut-off |
|---|---|---|---|---|
| QuantiFERON TB Gold IT | 84.7% (72.0–97.4) | 66.7% (43.0–85.4) | 100% (87.2–100.0) | 0.31 IU/ml |
| FC assay CD4+ (RD1 Ag − nil) | 81.8% (69.1–95.0) | 66.7% (43.0–85.4) | 96.3% (81.0–99.9) | 0.03% |
| FC assay CD4+ (PPD − nil) | 74.3% (59.6–89.1) | 52.4% (29.8–74.3) | 92.6% (75.7–99.1) | 0.36% |
| FC assay CD8+ (RD1 Ag − nil) | 78.9% (65.9–92.0) | 61.9% (38.4–81.9) | 85.2% (66.5–95.8) | 0.21% |
| FC assay CD8+ (PPD − nil) | 79.8% (66.4–93.2) | 76.2% (52.8–91.8) | 81.4% (61.9–93.7) | 0.07% |
Definition of abbreviations: Ag = antigen; CD4+ = CD3+CD4+ T cells; CD8+ = CD3+CD8+ T cells, FC = flow cytometric; IU = international units; nil = negative control; PPD = purified protein derivative; RD1 = region of difference 1.
Comparing Unexposed, Untreated Subjects with LTBI and Treated Subjects with LTBI Using Different Immunoassays
Compared with untreated LTBI cases, unexposed subjects displayed lower IFN-γ levels by QFT (P < 0.001) (Figure 3A). Furthermore, unexposed subjects displayed a lower proportion of CD25+CD134+ coexpressing CD3+CD4+ T cells and CD3+CD8+ T cells than untreated patients with LTBI after RD1 peptides or PPD antigen stimulation, respectively; this pattern was not observed for TB-irrelevant antigens from Candida (P < 0.001) (Figures 3B–3G). Interestingly, although IGRA data from commercial QFT did not differentiate untreated from treated LTBI (Figure 3A), the FC assay distinguished these groups when CD3+CD4+ T cells responded to RD1 antigens (Figure 3B) and when CD3+CD8+ T cells responded to PPD antigens (Figure 3F).
Figure 3.

Testing results in unexposed subjects, untreated patients with latent tuberculosis infection (LTBI), and treated patients with LTBI. (A) QuantiFERON TB Gold In-Tube results (i.e., region of difference [RD] peptides). (B) Flow cytometric detection of percentage of CD25+CD134+ coexpression in RD1 antigen–stimulated CD3+CD4+ T cells. (C) Flow cytometric detection of percentage of CD25+CD134+ coexpression in purified protein derivative (PPD)-stimulated CD3+CD4+ T cells. (D) Flow cytometric detection of percentage of CD25+CD134+ coexpression in Candida antigen–stimulated CD3+CD4+ T cells. (E) Flow cytometric detection of the percentage of CD25+CD134+ coexpression in RD1 antigen–stimulated CD3+CD8+ T cells. (F) Flow cytometric detection of the percentage of CD25+CD134+ coexpression in PPD-stimulated CD3+CD8+ T cells. (G) Flow cytometric detection of percentage of CD25+CD134+ coexpression in Candida antigen–stimulated CD3+CD8+ T cells. P value estimation by Dunn’s multiple comparison test. *P < 0.05, **P < 0.01, ***P < 0.001, and ****P < 0.0001. ns = not significant (P > 0.05). Boxed values indicate median and interquartile range, and whiskers indicate minimum and maximum values. Ag = antigen; IU = international units; nil = negative control; RD1 = region of difference 1.
Combinatorial Analysis of Study Groups by Dual-Immunoassay Assessment
Because QFT is commonly used in clinical evaluation for LTBI, we designed a combinatorial analysis with FC and QFT results in hopes of better differentiating unexposed, untreated LTBI, and treated LTBI conditions. We began by identifying by receiver operating characteristic analysis the percentage of those T-cell subsets that best differentiated between treated and untreated patients with LTBI: The percentage of CD25+CD134+ of CD3+CD8+ T cells (PPD − nil) was plotted on x axes (cut-off = 0.44%), and percentage of CD25+CD134+ of CD3+CD4+ T cells (RD1 peptides − nil) was plotted on y axes (cut-off = 0.55%) (Figure 4A; dashed lines indicate cut-offs). On these graphs we plotted each patient’s FC assay data point, colored red if the patient was also QFT(+) or blue if the patient was QFT(−). We also plotted the bivariate normal density ellipse with 95% coverage for the FC tests, color-coded according to corresponding QFT results (for additional scatterplots with individual QFT values, see Figures E3–E5 in the online supplement). This two-dimensional set-up allowed simple visualization showing that all but one unexposed subjects were negative for QFT and FC assays (Figure 4A, upper left panel). In contrast, untreated patients with LTBI varied from a low or undetectable to a high proportion of CD3+CD4+ and CD3+CD8+ T cells coexpressing CD25+CD134+ after ex vivo stimulation with RD1 peptides or PPD antigens, respectively (Figure 4A, upper right panel). Furthermore, for the untreated LTBI condition, all of the patients who had a high surface marker expression on both FC assays were also QFT(+) (Figure 4A, upper right panel, upper right quadrant); however, there were also patients who were negative by both FC assays but were QFT(+) (Figure 4A, upper right panel, lower left quadrant). Meanwhile, all treated patients with LTBI were negative by both FC assays, although, unlike unexposed subjects, there were some treated patients with LTBI who retained a QFT(+) result (Figure 4A, lower left panel, lower left quadrant).
Figure 4.

Flow cytometry (FC) test measurements and combination of immunodiagnostic tests distinguish between unexposed subjects, untreated patients with latent tuberculosis infection (LTBI), and treated patients with LTBI. (A) Bivariate normal density ellipse with 95% coverage for QuantiFERON TB Gold In-Tube (QFT)(+) results (red color) and QFT(−) results (blue color) and correspondent FC test results: percentage of CD25+CD134+ of CD3+CD4+ T cells (region of difference 1 [RD1] peptide antigen [Ag] − negative control [nil]) versus percentage of CD25+CD134+ of CD3+CD8+ T cells (purified protein derivative [PPD] − nil) by study groups. The cut-offs for the FC tests were those associated with the highest specificity to separate treated from untreated LTBI cases (dashed lines, optimized FC test cut-offs). (B) Pie charts represent the number of subjects with positive or negative immunodiagnostic test results (using the optimized FC test cut-offs) by study groups. FC assay CD4+ (RD1 Ag − nil) = FC assay for the percentage of CD25+CD134+ of CD3+CD4+ T cells (RD1 Ag − nil); FC assay CD8+ (PPD − nil) = FC assay for the percentage of CD25+CD134+ of CD3+CD8+ T cells (PPD − nil).
Summary data were visualized in pie charts in which a combined positive FC assay and QFT(+) result was more often found in untreated versus treated patients with LTBI (7 out of 21 [33.3%] vs. 0) (Figure 4B). In contrast, among all patients with LTBI with QFT(+) results, a negative FC assay result (with either RD1 peptides or PPD stimulation) was more often found in treated patients with LTBI than in untreated ones (9 out of 9 [100%] vs. 5 out of 12 [41.7%]) (Figure 4B). In all, four distinct immunomarker subsets could be identified (color coded: orange, blue, green, or red; Figure 4B), whose proportions and relative representation differed based on patient category. We conclude that this combinatorial immunoassay approach can identify unique subsets among untreated patients with LTBI when compared with unexposed and treated patients with LTBI.
Risk of Reactivation Analysis by Combinatorial Immunoassay Subsets
Overall, untreated and treated LTBI groups had no statistical differences in cumulative risk of TB reactivation by the unadjusted prediction formula (mean, 3.48 ± 2.59% vs. 4.11 ± 4.01%, respectively) (Figure 5A), and those estimates changed after our study adjustments (Figure 5B). Statistical differences in cumulative risk of TB reactivation, predicted by the adjusted formula, were seen for each test (Figures 5C–5E). We next determined the extent to which these immune reactivity subsets were also associated with a differential cumulative risk of TB reactivation. Both FC assays(+) results (i.e., CD4+ T cells stimulated with RD1 peptides and CD8+ stimulated with PPD) had the highest risk compared with QFT(+) results (mean, 4.11 ± 1.96% and 3.17 ± 2.37% vs. 2.45 ± 2.15%, respectively) (Figures 5C–5E). Patients who had the combination of QFT(+) and either FC assay(+) results yielded the highest cumulative risk estimates for TB reactivation (mean, 4.11 ± 2.11% and 3.94 ± 2.08%, respectively) (Figures 6A and 6B). Among the patients with QFT(+) and either FC assay(−) results, those risk estimates were statistically significantly reduced (mean, 1.62 ± 1.68% and 1.71 ± 1.82%, respectively) (Figures 6A and 6B). Subjects with a combination of QFT(−) and FC assay(−) results had the lowest risk of reactivation (mean, 0.34 ± 0.77% and 0.42 ± 0.97%, respectively) (Figures 6A and 6B).
Figure 5.
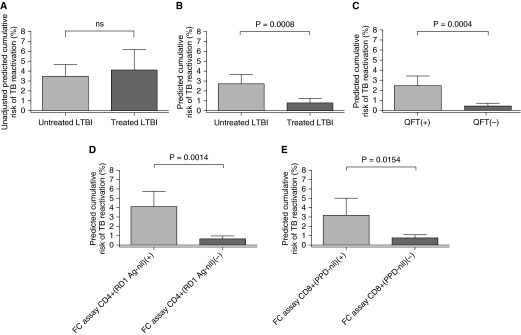
Adjusted prediction formula differentiates cumulative risk of tuberculosis (TB) reactivation in untreated versus treated patients with latent tuberculosis infection (LTBI) and for each individual immunodiagnostic test result. (A) Unadjusted cumulative risk for TB reactivation for untreated versus treated patients with LTBI. ns = not significant (P > 0.05). (B) Adjusted cumulative risk for TB reactivation for untreated versus treated patients with LTBI. (C) Adjusted cumulative risk of TB reactivation for QuantiFERON TB Gold In-Tube (QFT). (D) Adjusted cumulative risk of TB reactivation for flow cytometry (FC) assay CD4+ (region of difference 1 [RD1] peptide antigen [Ag] − negative control [nil]) results (using the optimized FC test cut-offs that differentiate untreated from treated subjects with LTBI). (E) Adjusted cumulative patients’ risk for TB reactivation for FC assay CD8+ (purified protein derivative [PPD] − nil) results (using the optimized FC test cut-offs). P value estimation by Student's t test. Bar indicates mean value; error bar indicates 95% confidence interval. FC assay CD4+ (RD1 Ag − nil) = FC assay for the percentage CD25+CD134+ of CD3+CD4+ T cells (RD1 Ag − nil); FC assay CD8+ (PPD − nil) = FC assay for the percentage CD25+CD134+ of CD3+CD8+ T cells (PPD − nil).
Figure 6.

Adjusted prediction formula differentiates cumulative risk of tuberculosis (TB) reactivation in combination subsets of QuantiFERON TB Gold In-Tube (QFT) and flow cytometry (FC) immune-reactive profiles. (A) Cumulative patients’ risk for TB reactivation for combinations of QFT and FC assay CD4+ (region of difference 1 [RD1] peptide antigen [Ag] − negative control [nil]) results (using the optimized FC test cut-offs that differentiate untreated from treated subjects with latent tuberculosis infection). (B) Cumulative patients’ risk for TB reactivation for combinations of QFT and FC assay CD8+ (purified protein derivative [PPD] − nil) results (using the optimized FC test cut-offs). P value estimation by Tukey’s multiple comparisons test. *P < 0.05, **P < 0.01, ***P < 0.001, and ****P < 0.0001. ns = not significant (P > 0.05). Bar indicates mean value; error bar indicates 95% confidence interval. FC assay CD4+ (RD1 Ag − nil) = FC assay for the percentage of CD25+CD134+ of CD3+CD4+ T cells (RD1 Ag − nil); FC assay CD8+ (PPD − nil) = FC assay for the percentage of CD25+CD134+ of CD3+CD8+ T cells (PPD − nil).
Discussion
We show that a combinatorial immunoassay profiling can distinguish unexposed subjects, untreated patients with LTBI, and treated patients with LTBI, and these immune reactivity subsets are also associated with a differential risk of TB reactivation by a prediction formula. We propose that the distinct combinatorial phenotypes observed in our study merit prospective evaluation for their potential to stratify untreated patients with LTBI. In fact, the reduction in the number of immune phenotype subsets comparing the untreated group with the treated group (Figure 4B) not only suggests how effective the treatment strategy is but also identifies a subset of cases with high surface marker expression on FC assays associated with QFT(+) results that are not present in unexposed and treated patients with LTBI (Figure 4A). Moreover, these patient subsets displayed the highest predicted risk for TB reactivation when identified for either positive CD4+ or CD8+ FC assay (Figures 5D and 5E) and in combination with QFT(+) (Figures 6A and 6B, first columns). Therefore, it is conceivable that these patient subsets are at highest risk of reactivation. However, we also identified other combination immunophenotypes, such as subsets that were QFT(−) but also FC assay(+) and a few QFT(+) that were FC assay(−), and there were some differences in their predicted risk of reactivation (Figures 4 and 6). Thus, it is possible that the distinct combination immunophenotype subsets might represent distinct underlying immune activities, as discussed below. Along these lines, it is also reasonable to speculate that patients with LTBI who are QFT(−) and display low coexpression of CD25 and CD134 by FC assay are likely be at the lowest risk of progression to TB reactivation.
T cells coexpressing CD25 and CD134 after antigen stimulation have a differentiated effector T-cell phenotype in TB and various infections (15). Thus, our results are consistent with the hypothesis that distinct effector T-cell biomarkers could potentially be used to determine TB reactivation risk in LTBI. If correct, and likely in combination with IGRAs, these markers may work by distinguishing incomplete immunity, immune clearance, and effective immune containment of infection (i.e., calcified granuloma). Highly differentiated circulating effector T cells have a limited lifespan (i.e., months) (24) and disappear or greatly decrease after removal of antigen after bacterial clearance and cessation of antigen presentation (i.e., completion of LTBI treatment) (25). Several prior studies have described activated effector T-cell phenotypes in active TB and LTBI in animal models and ex vivo human studies (4, 26–32). Moreover, antibiotic treatment is known to alter the phenotype and transcriptome of circulating T-lymphocytes in patients with active TB infection, although little is known of the effects after LTBI treatment (31, 33). One study reported a reduction in the proportion of IFN-γ+ CD4+ T cells expressing the activation marker CD38 within a few weeks after LTBI treatment (31). These findings suggest early changes in T-cell effector immunity associated with antimicrobial therapy in patients with LTBI (26, 31). We speculate that circulating differentiated T-cell effector phenotypes may be maintained by antigen-presenting cells reacting to secretory RD1 antigens released by viable MTB contained in the foci of LTBI with reactivation potential (34). Of note, the degree of CD25+CD134+ up-regulation in CD8+ T cells with PPD was low but was clearly higher in untreated versus treated LTBI cases (Figure 3F). Similar levels of CD8+ T-cell activation with PPD have been reported, but the mechanism of this finding is unclear (10, 35). In contrast, up-regulation of CD8+ T cells with RD1 peptides was higher in both untreated and treated LTBI groups, which can be explained by preservation of long-lived ESAT-6/CFP-10–specific memory CD8+ T cells (Figure 3E) (36). In fact, MTB-specific T-cell responses in patients with AIDS are CD8+ T-cell reliant, and those T cells are dynamically associated with intracellular bacterial loads, suggesting the importance of CD8+ biomarkers for LTBI in low-CD4 count states (10, 28).
Regarding standard IGRA as a biomarker and prognostic indicator in LTBI, 16 to 38% of TST(+)/IGRA(+) patients change to IGRA(−) results after LTBI therapy (26, 37). This suggests that IFN-γ detected by IGRA might represent a long-lasting memory immune response (5). Two recent studies performed in high-TB transmission settings showed a limited utility of IGRAs as biomarkers of short-term response to LTBI treatment (38, 39). Moreover, an IGRA(+) test has a low (<7%) diagnostic power to predict TB reactivation over time, again suggesting that only a subset of IGRA(+) individuals bear viable MTB with reactivation potential (3, 40).
Our proof-of-concept study findings are potentially significant to the field, but the predictive value of these candidate biomarkers would need to be evaluated in the various patient populations and settings. In fact, initial work with this FC diagnostic approach in low- and high-endemic TB areas have shown promising results to diagnose LTBI in “real-life” settings and unselected groups of subjects, including recent TB contacts, employees of high-risk congregate settings, immigrants from TB-endemic areas, immunosuppressed subjects, HIV-positive patients with low CD4 counts, and subjects vaccinated for bacillus Calmette-Guérin (16). Moreover, improving diagnostic accuracy for LTBI cases likely to reactivate could translate into better patient treatment selection and prevention strategies. More targeted selection of patients could lead to fewer patients requiring LTBI treatment or developing drug side effects, which is particularly important in high-risk populations (e.g., HIV, liver disease, and pregnancy), and in close contacts of multidrug-resistant TB cases where effective treatment for LTBI is often unclear or problematic (6). A more reliable test for LTBI with reactivation potential may also improve diagnosis in longitudinal testing, such as in healthcare workers and TB outbreak investigations (7, 41, 42). Most of our study participants were healthcare workers, suggesting that these FC assays could potentially have a role for risk stratification in this population. Importantly, identifying reliable biomarkers of protective T-cell immunity against MTB could lead to improvement in our understanding of the mechanisms associated with this state and could likely contribute to novel diagnostic and therapeutic interventions, including enabling more efficient vaccine development (25, 43, 44). One potential study design to test these novel candidates for biomarkers could include the longitudinal evaluation of all these immune phenotype candidates in healthcare workers in highly endemic TB areas with high incidence of TB reactivation.
One strength of our study is that it was performed in a low-incidence area of TB. A high-TB transmission environment could have placed study subjects at risk of MTB exposure, potentially affecting results over time (39). Although we relied on patient health records to document prior completion of LTBI therapy, our compliance rate for LTBI treatment is above 80% (internal communication). This study also has some limitations. First, there was a limited sample size, which was due to the need to obtain a carefully characterized study population to test our hypothesis in the absence of a gold standard test. Second, the inter- and intraassay precision and biological variability of this novel dual-assay approach remain to be determined. Validation of immune assays for infectious diseases should follow the same principles as methods for clinical chemistry (45). Precision testing is critical for validation, and only a few studies rigorously tested commercial IGRAs and showed a coefficient of variation of 37.8% for samples with mid- and high-end results and imprecision of testing samples with low-end levels exceeded 100% (46–48). This analytical imprecision of IGRAs that includes biological variation is in accordance with the reported imprecision of other manual immunodiagnostic tests (46, 47). Importantly, a similar FC method has shown robust precision testing results (49). Third, some of the assays’ results with PPD antigen stimulation might have been false-positive reactions to bacillus Calmette-Guérin vaccination, although the adult age of our patients with LTBI makes this possibility unlikely (50). Fourth, the “Online TST/IGRA calculator” and study adjustments have not been prospectively validated, and therefore conclusions from this part of the analysis should be taken with caution. Of note, the study design does not provide information regarding the timeframe with which these T-cell responses might change in peripheral blood after treatment for LTBI or naturally. A longitudinal study with serial testing in the same patients is needed to answer this important question.
In conclusion, a combinatorial immunoassay approach succeeded in visualizing distinct subsets between unexposed subjects, untreated patients with LTBI, and treated patients with LTBI, which preliminarily correlate with distinct TB reactivation risk predictions. These findings suggest that novel candidates for biomarkers might be found by a multiimmunoassay analysis strategy, with the ultimate goal of potentially discriminating TB reactivation risk among patients. Prospective and longitudinal studies will be the focus of future work to evaluate these novel subsets and diagnostic approach.
Acknowledgments
Acknowledgment
The authors thank the study subjects for their generous participation; the staff of the Mayo Clinic Institutional Review Board, Olmsted County Public Health Services Tuberculosis Clinic, and the Lanmark Pulmonary Research Unit and the staff and colleagues of the Mayo Mycobacterial and Bronchiectasis Clinic, the Mayo Clinic Center for Tuberculosis, and the Mayo Infectious Disease Serology Laboratory for their diligent and valuable support; and Debra Hanson, Dawn Bergen, and Gladys Hebl from Research and Academic Support Services at the Mayo Clinic for editing and proofreading support.
Footnotes
Supported by internal Mayo Clinic grants (the 2009 and 2011 Lucille Nelson Clinical Career Development Award in Pulmonary Research, the 2011 Mayo Clinic Center for Clinical and Translational Sciences [CCaTS] Career Transition Award, the 2012 Mayo Clinic CCaTS Novel Methodology Award, the 2014 Mayo Clinic Department of Medicine Career Development Time for Scholarly Physicians Award, and the 2010 Mayo Clinic Department of Medicine Clinical Immunology and Immunotherapeutics Program Award) (P.E.); by grant K23CA159391 from the National Cancer Institute (T.P.); and by grant UL1 TR000135 from the National Center for Advancing Translational Sciences. This article’s contents are solely the responsibility of the authors and do not necessarily represent the official views of the National Institutes of Health or Mayo Clinic.
Author Contributions: Conception and design, acquisition of data, analysis and interpretation of data: P.E., T.P., V.P.V.K., C.L.E., C.L.B., B.R.A, R.S.A., K.L.K., H.K., A.G.S., and A.H.L. Drafting the article and revising it critically for important intellectual content: P.E., T.P., V.P.V.K., C.L.E., C.L.B., B.R.A., K.M., L.R.P., R.S.A., K.L.K., H.K., A.G.S., and A.H.L. Final approval of the version to be published: P.E., T.P., V.P.V.K., C.L.E., C.L.B., B.R.A., K.M., L.R.P., R.S.A., K.L.K., H.K., A.G.S., and A.H.L.
This article has an online supplement, which is accessible from this issue's table of contents at www.atsjournals.org
Originally Published in Press as DOI: 10.1164/rccm.201412-2141OC on June 1, 2015
Author disclosures are available with the text of this article at www.atsjournals.org.
References
- 1.Comstock GW, Baum C, Snider DE., Jr Isoniazid prophylaxis among Alaskan Eskimos: a final report of the bethel isoniazid studies. Am Rev Respir Dis. 1979;119:827–830. doi: 10.1164/arrd.1979.119.5.827. [DOI] [PubMed] [Google Scholar]
- 2.Canetti G. Dynamic aspects of the pathology and bacteriology of tuberculous lesions. Am Rev Tuberc. 1956;74:13–21; discussion, 22–27. doi: 10.1164/artpd.1956.74.2-2.13. [DOI] [PubMed] [Google Scholar]
- 3.Esmail H, Barry CE, III, Young DB, Wilkinson RJ. The ongoing challenge of latent tuberculosis. Philos Trans R Soc Lond B Biol Sci. 2014;369:20130437. doi: 10.1098/rstb.2013.0437. [DOI] [PMC free article] [PubMed] [Google Scholar]
- 4.Lin PL, Flynn JL. Understanding latent tuberculosis: a moving target. J Immunol. 2010;185:15–22. doi: 10.4049/jimmunol.0903856. [DOI] [PMC free article] [PubMed] [Google Scholar]
- 5.Mack U, Migliori GB, Sester M, Rieder HL, Ehlers S, Goletti D, Bossink A, Magdorf K, Hölscher C, Kampmann B, et al. C. Lange; TBNET. LTBI: latent tuberculosis infection or lasting immune responses to M. tuberculosis? A TBNET consensus statement. Eur Respir J. 2009;33:956–973. doi: 10.1183/09031936.00120908. [DOI] [PubMed] [Google Scholar]
- 6.American Thoracic Society. Targeted tuberculin testing and treatment of latent tuberculosis infection. MMWR Recomm Rep. 2000;49:1–51. [PubMed] [Google Scholar]
- 7.Mazurek GH, Jereb J, Vernon A, LoBue P, Goldberg S, Castro K IGRA Expert Committee; Centers for Disease Control and Prevention (CDC) Updated guidelines for using interferon gamma release assays to detect Mycobacterium tuberculosis infection - United States, 2010. MMWR Recomm Rep. 2010;59:1–25. [PubMed] [Google Scholar]
- 8.Janossy G, Barry SM, Breen RA, Hardy GA, Lipman M, Kern F. The role of flow cytometry in the interferon-gamma-based diagnosis of active tuberculosis and its coinfection with HIV-1–A technically oriented review. Cytometry B Clin Cytom. 2008;74:S141–S151. doi: 10.1002/cyto.b.20381. [DOI] [PubMed] [Google Scholar]
- 9.Streitz M, Tesfa L, Yildirim V, Yahyazadeh A, Ulrichs T, Lenkei R, Quassem A, Liebetrau G, Nomura L, Maecker H, et al. Loss of receptor on tuberculin-reactive T-cells marks active pulmonary tuberculosis. PLoS One. 2007;2:e735. doi: 10.1371/journal.pone.0000735. [DOI] [PMC free article] [PubMed] [Google Scholar]
- 10.Sutherland JS, Young JM, Peterson KL, Sanneh B, Whittle HC, Rowland-Jones SL, Adegbola RA, Jaye A, Ota MO. Polyfunctional CD4(+) and CD8(+) T cell responses to tuberculosis antigens in HIV-1-infected patients before and after anti-retroviral treatment. J Immunol. 2010;184:6537–6544. doi: 10.4049/jimmunol.1000399. [DOI] [PubMed] [Google Scholar]
- 11.Comstock GW. How much isoniazid is needed for prevention of tuberculosis among immunocompetent adults? Int J Tuberc Lung Dis. 1999;3:847–850. [PubMed] [Google Scholar]
- 12.Lobue P, Menzies D. Treatment of latent tuberculosis infection: An update. Respirology. 2010;15:603–622. doi: 10.1111/j.1440-1843.2010.01751.x. [DOI] [PubMed] [Google Scholar]
- 13.Bansal-Pakala P, Halteman BS, Cheng MH, Croft M. Costimulation of CD8 T cell responses by OX40. J Immunol. 2004;172:4821–4825. doi: 10.4049/jimmunol.172.8.4821. [DOI] [PubMed] [Google Scholar]
- 14.Watts TH. TNF/TNFR family members in costimulation of T cell responses. Annu Rev Immunol. 2005;23:23–68. doi: 10.1146/annurev.immunol.23.021704.115839. [DOI] [PubMed] [Google Scholar]
- 15.Zaunders JJ, Munier ML, Seddiki N, Pett S, Ip S, Bailey M, Xu Y, Brown K, Dyer WB, Kim M, et al. High levels of human antigen-specific CD4+ T cells in peripheral blood revealed by stimulated coexpression of CD25 and CD134 (OX40) J Immunol. 2009;183:2827–2836. doi: 10.4049/jimmunol.0803548. [DOI] [PubMed] [Google Scholar]
- 16.Hsu DC, Zaunders JJ, Plit M, Leeman C, Ip S, Iampornsin T, Pett SL, Bailey M, Amin J, Ubolyam S, et al. A novel assay detecting recall response to Mycobacterium tuberculosis: Comparison with existing assays. Tuberculosis (Edinb) 2012;92:321–327. doi: 10.1016/j.tube.2012.03.008. [DOI] [PubMed] [Google Scholar]
- 17.Escalante P, Peikert T, Erskine C, Bornhorst C, McKey C, Andrist B, Binniker M, Feske M, Graviss E, Abraham R, et al. Evaluation of a novel flow cytometry method for the diagnosis of latent tuberculosis infection [abstract] Am J Respir Crit Care Med. 2012;185:A4722. [Google Scholar]
- 18.Escalante P, Peikert T, Van Keulen V, Erskine C, Limper A, Schrum A.Predictive risk analysis of a combinatorial immunoassay with T-cell CD25+/CD134+ co-expression in latent tuberculosis [abstract]. Presented at the Keystone Symposia: Host Response in Tuberculosis (J3). January 22–27, 2015, Santa Fe, NM [Google Scholar]
- 19.Menzies D, Gardiner G, Farhat M, Greenaway C, Pai M. Thinking in three dimensions: a web-based algorithm to aid the interpretation of tuberculin skin test results. Int J Tuberc Lung Dis. 2008;12:498–505. [PubMed] [Google Scholar]
- 20.Karyampudi L, Formicola C, Erskine CL, Maurer MJ, Ingle JN, Krco CJ, Wettstein PJ, Kalli KR, Fikes JD, Beebe M, et al. A degenerate HLA-DR epitope pool of HER-2/neu reveals a novel in vivo immunodominant epitope, HER-2/neu88-102. Clin Cancer Res. 2010;16:825–834. doi: 10.1158/1078-0432.CCR-09-2781. [DOI] [PMC free article] [PubMed] [Google Scholar]
- 21.Godoy-Ramirez K, Franck K, Mahdavifar S, Andersson L, Gaines H. Optimum culture conditions for specific and nonspecific activation of whole blood and PBMC for intracellular cytokine assessment by flow cytometry. J Immunol Methods. 2004;292:1–15. doi: 10.1016/j.jim.2004.04.028. [DOI] [PubMed] [Google Scholar]
- 22.Nomura LE, Walker JM, Maecker HT. Optimization of whole blood antigen-specific cytokine assays for CD4(+) T cells. Cytometry. 2000;40:60–68. doi: 10.1002/(sici)1097-0320(20000501)40:1<60::aid-cyto8>3.0.co;2-j. [DOI] [PubMed] [Google Scholar]
- 23.Ferrara G, Losi M, D’Amico R, Roversi P, Piro R, Meacci M, Meccugni B, Dori IM, Andreani A, Bergamini BM, et al. Use in routine clinical practice of two commercial blood tests for diagnosis of infection with Mycobacterium tuberculosis: a prospective study. Lancet. 2006;367:1328–1334. doi: 10.1016/S0140-6736(06)68579-6. [DOI] [PubMed] [Google Scholar]
- 24.Macallan DC, Wallace D, Zhang Y, De Lara C, Worth AT, Ghattas H, Griffin GE, Beverley PC, Tough DF. Rapid turnover of effector-memory CD4(+) T cells in healthy humans. J Exp Med. 2004;200:255–260. doi: 10.1084/jem.20040341. [DOI] [PMC free article] [PubMed] [Google Scholar]
- 25.Weiner J, Maertzdorf J, Kaufmann SH. The dual role of biomarkers for understanding basic principles and devising novel intervention strategies in tuberculosis. Ann N Y Acad Sci. 2013;1283:22–29. doi: 10.1111/j.1749-6632.2012.06802.x. [DOI] [PubMed] [Google Scholar]
- 26.Ewer K, Millington KA, Deeks JJ, Alvarez L, Bryant G, Lalvani A. Dynamic antigen-specific T-cell responses after point-source exposure to Mycobacterium tuberculosis. Am J Respir Crit Care Med. 2006;174:831–839. doi: 10.1164/rccm.200511-1783OC. [DOI] [PubMed] [Google Scholar]
- 27.Millington KA, Innes JA, Hackforth S, Hinks TS, Deeks JJ, Dosanjh DP, Guyot-Revol V, Gunatheesan R, Klenerman P, Lalvani A. Dynamic relationship between IFN-gamma and IL-2 profile of Mycobacterium tuberculosis-specific T cells and antigen load. J Immunol. 2007;178:5217–5226. doi: 10.4049/jimmunol.178.8.5217. [DOI] [PMC free article] [PubMed] [Google Scholar]
- 28.Nyendak MR, Park B, Null MD, Baseke J, Swarbrick G, Mayanja-Kizza H, Nsereko M, Johnson DF, Gitta P, Okwera A, et al. Tuberculosis Research Unit and the Tuberculosis Trials Consortium. Mycobacterium tuberculosis specific CD8(+) T cells rapidly decline with antituberculosis treatment. PLoS One. 2013;8:e81564. doi: 10.1371/journal.pone.0081564. [DOI] [PMC free article] [PubMed] [Google Scholar]
- 29.Tapaninen P, Korhonen A, Pusa L, Seppälä I, Tuuminen T. Effector memory T-cells dominate immune responses in tuberculosis treatment: antigen or bacteria persistence? Int J Tuberc Lung Dis. 2010;14:347–355. [PubMed] [Google Scholar]
- 30.Wergeland I, Assmus J, Dyrhol-Riise AM. T regulatory cells and immune activation in Mycobacterium tuberculosis infection and the effect of preventive therapy. Scand J Immunol. 2011;73:234–242. doi: 10.1111/j.1365-3083.2010.02496.x. [DOI] [PubMed] [Google Scholar]
- 31.Wilkinson KA, Kon OM, Newton SM, Meintjes G, Davidson RN, Pasvol G, Wilkinson RJ. Effect of treatment of latent tuberculosis infection on the T cell response to Mycobacterium tuberculosis antigens. J Infect Dis. 2006;193:354–359. doi: 10.1086/499311. [DOI] [PubMed] [Google Scholar]
- 32.Young JM, Adetifa IM, Ota MO, Sutherland JS. Expanded polyfunctional T cell response to mycobacterial antigens in TB disease and contraction post-treatment. PLoS One. 2010;5:e11237. doi: 10.1371/journal.pone.0011237. [DOI] [PMC free article] [PubMed] [Google Scholar]
- 33.Bloom CI, Graham CM, Berry MP, Wilkinson KA, Oni T, Rozakeas F, Xu Z, Rossello-Urgell J, Chaussabel D, Banchereau J, et al. Detectable changes in the blood transcriptome are present after two weeks of antituberculosis therapy. PLoS One. 2012;7:e46191. doi: 10.1371/journal.pone.0046191. [DOI] [PMC free article] [PubMed] [Google Scholar]
- 34.Millington KA, Gooding S, Hinks TS, Reynolds DJ, Lalvani A. Mycobacterium tuberculosis-specific cellular immune profiles suggest bacillary persistence decades after spontaneous cure in untreated tuberculosis. J Infect Dis. 2010;202:1685–1689. doi: 10.1086/656772. [DOI] [PubMed] [Google Scholar]
- 35.Smith SG, Lalor MK, Gorak-Stolinska P, Blitz R, Beveridge NE, Worth A, McShane H, Dockrell HM. Mycobacterium tuberculosis PPD-induced immune biomarkers measurable in vitro following BCG vaccination of UK adolescents by multiplex bead array and intracellular cytokine staining. BMC Immunol. 2010;11:35. doi: 10.1186/1471-2172-11-35. [DOI] [PMC free article] [PubMed] [Google Scholar]
- 36.Day CL, Moshi ND, Abrahams DA, van Rooyen M, O’rie T, de Kock M, Hanekom WA. Patients with tuberculosis disease have Mycobacterium tuberculosis-specific CD8 T cells with a pro-apoptotic phenotype and impaired proliferative capacity, which is not restored following treatment. PLoS One. 2014;9:e94949. doi: 10.1371/journal.pone.0094949. [DOI] [PMC free article] [PubMed] [Google Scholar]
- 37.Chee CB, KhinMar KW, Gan SH, Barkham TM, Pushparani M, Wang YT. Latent tuberculosis infection treatment and T-cell responses to Mycobacterium tuberculosis-specific antigens. Am J Respir Crit Care Med. 2007;175:282–287. doi: 10.1164/rccm.200608-1109OC. [DOI] [PubMed] [Google Scholar]
- 38.Adetifa IM, Ota MO, Jeffries DJ, Lugos MD, Hammond AS, Battersby NJ, Owiafe PK, Donkor SD, Antonio M, Ibanga HB, et al. Interferon-γ ELISPOT as a biomarker of treatment efficacy in latent tuberculosis infection: a clinical trial. Am J Respir Crit Care Med. 2013;187:439–445. doi: 10.1164/rccm.201208-1352OC. [DOI] [PubMed] [Google Scholar]
- 39.Johnson JL, Geldenhuys H, Thiel BA, Toefy A, Suliman S, Pienaar B, Chheng P, Scriba T, Boom WH, Hanekom W, et al. Effect of isoniazid therapy for latent TB infection on QuantiFERON-TB Gold in-tube responses in adults with positive tuberculin skin test results in a high TB incidence area: a controlled study. Chest. 2014;145:612–617. doi: 10.1378/chest.13-1232. [DOI] [PMC free article] [PubMed] [Google Scholar]
- 40.Diel R, Loddenkemper R, Nienhaus A. Predictive value of interferon-γ release assays and tuberculin skin testing for progression from latent TB infection to disease state: a meta-analysis. Chest. 2012;142:63–75. doi: 10.1378/chest.11-3157. [DOI] [PubMed] [Google Scholar]
- 41.van Zyl-Smit RN, Pai M, Peprah K, Meldau R, Kieck J, Juritz J, Badri M, Zumla A, Sechi LA, Bateman ED, et al. Within-subject variability and boosting of T-cell interferon-gamma responses after tuberculin skin testing. Am J Respir Crit Care Med. 2009;180:49–58. doi: 10.1164/rccm.200811-1704OC. [DOI] [PubMed] [Google Scholar]
- 42.Zwerling A, van den Hof S, Scholten J, Cobelens F, Menzies D, Pai M. Interferon-gamma release assays for tuberculosis screening of healthcare workers: a systematic review. Thorax. 2012;67:62–70. doi: 10.1136/thx.2010.143180. [DOI] [PubMed] [Google Scholar]
- 43.Ottenhoff TH. New pathways of protective and pathological host defense to mycobacteria. Trends Microbiol. 2012;20:419–428. doi: 10.1016/j.tim.2012.06.002. [DOI] [PubMed] [Google Scholar]
- 44.Brennan MJ, Stone MR, Evans T. A rational vaccine pipeline for tuberculosis. Int J Tuberc Lung Dis. 2012;16:1566–1573. doi: 10.5588/ijtld.12.0569. [DOI] [PubMed] [Google Scholar]
- 45.Banoo S, Bell D, Bossuyt P, Herring A, Mabey D, Poole F, Smith PG, Sriram N, Wongsrichanalai C, Linke R, et al. TDR Diagnostics Evaluation Expert Panel. Evaluation of diagnostic tests for infectious diseases: general principles. Nat Rev Microbiol. 2010;8(12) Suppl:S17–S29. [PubMed] [Google Scholar]
- 46.Detjen AK, Loebenberg L, Grewal HM, Stanley K, Gutschmidt A, Kruger C, Du Plessis N, Kidd M, Beyers N, Walzl G, et al. Short-term reproducibility of a commercial interferon gamma release assay. Clin Vaccine Immunol. 2009;16:1170–1175. doi: 10.1128/CVI.00168-09. [DOI] [PMC free article] [PubMed] [Google Scholar]
- 47.Tuuminen T, Tavast E, Väisänen R, Himberg JJ, Seppälä I. Assessment of Imprecision in gamma interferon release assays for the detection of exposure to Mycobacterium tuberculosis. Clin Vaccine Immunol. 2010;17:596–601. doi: 10.1128/CVI.00320-09. [DOI] [PMC free article] [PubMed] [Google Scholar]
- 48.Metcalfe JZ, Cattamanchi A, McCulloch CE, Lew JD, Ha NP, Graviss EA. Test variability of the QuantiFERON-TB gold in-tube assay in clinical practice. Am J Respir Crit Care Med. 2013;187:206–211. doi: 10.1164/rccm.201203-0430OC. [DOI] [PMC free article] [PubMed] [Google Scholar]
- 49.Sadler R, Bateman EA, Heath V, Patel SY, Schwingshackl PP, Cullinane AC, Ayers L, Ferry BL. Establishment of a healthy human range for the whole blood “OX40” assay for the detection of antigen-specific CD4+ T cells by flow cytometry. Cytometry B Clin Cytom. 2014;86:350–361. doi: 10.1002/cyto.b.21165. [DOI] [PubMed] [Google Scholar]
- 50.Wang L, Turner MO, Elwood RK, Schulzer M, FitzGerald JM. A meta-analysis of the effect of Bacille Calmette Guérin vaccination on tuberculin skin test measurements. Thorax. 2002;57:804–809. doi: 10.1136/thorax.57.9.804. [DOI] [PMC free article] [PubMed] [Google Scholar]
- 51.World Health Organization. Global tuberculosis report 2014. Geneva, Switzerland: World Health Organization; 2014 [accessed 2014 Jun 15]. Available from: http://www.who.int/tb/publications/global_report/en/