

Abstract
Summary: Biological sequence diagrams are fundamental for visualizing various functional elements in protein or nucleotide sequences that enable a summarization and presentation of existing information as well as means of intuitive new discoveries. Here, we present a software package called illustrator of biological sequences (IBS) that can be used for representing the organization of either protein or nucleotide sequences in a convenient, efficient and precise manner. Multiple options are provided in IBS, and biological sequences can be manipulated, recolored or rescaled in a user-defined mode. Also, the final representational artwork can be directly exported into a publication-quality figure.
Availability and implementation: The standalone package of IBS was implemented in JAVA, while the online service was implemented in HTML5 and JavaScript. Both the standalone package and online service are freely available at http://ibs.biocuckoo.org.
Contact: renjian.sysu@gmail.com or xueyu@hust.edu.cn
Supplementary information: Supplementary data are available at Bioinformatics online.
1 Introduction
A concise, delicate and precise picture can afford a great advantage over description alone. The graphical representation of biological sequences with various functional elements is fundamental for the efficient introduction and interpretation of scientific findings obtained in the course of the investigation of molecular biological functions. At present, biologists mainly use Microsoft PowerPoint, Adobe Illustrator or Photoshop to diagram biological sequences. However, these software packages were developed for the general propose of image manipulation, so it is difficult to use them to prepare a sequence organization diagram of sufficient accuracy. For example, the scale of functional elements such as DNA motifs and protein domains is typically approximated, even judged by eye. Also, when using these tools, neither the locations nor the positions of functional elements can be precisely designated in the biological sequences.
The first attempt at providing a professional illustrator of MyDomains for biological sequences was made by the PROSITE database (Sigrist et al., 2013). Using the tool, the functional domains and sites of a protein sequence can be drawn to a precise scale. Up to six different shapes and four different color modes are supported in the diagramming of the protein domains. However, a pre-defined script that specifies the precise positions of the function domains or sites must be provided before generating a protein domain graph (DOG). In 2009, our group also developed a software package called DOG (Ren et al., 2009) for plotting protein graphs in a step-by-step manner. Although DOG was specifically designed for protein diagramming, a number of researchers still used it for visualizing the functional elements of nucleotide sequences. However, DOG is not an optimal tool for the visualization of nucleotide sequences since it lacks of drawing elements for nucleotide domains. In this regard, the development of a new software package for the purpose of diagramming both protein and nucleotide sequences is awaited.
In this work, we present a new tool called illustrator of biological sequences (IBS) for assisting biologists in drawing publication-quality diagrams of both protein and nucleotide sequences. Abundant graphical elements are available for representing functional elements or regulatory molecules for both protein and nucleotide sequences. The standalone packages of IBS were implemented in JAVA, and supported three major Operating Systems, including Windows, Linux and Mac OS. We anticipate this powerful tool to be a great help to biologists for the purpose of visualizing biological sequences.
2 Key features
IBS provides a dual-mode interface to effectively assist the illustrative diagram for either protein or nucleotide sequences. Within the dual mode, a variety of drawing elements are implemented for the annotations of both protein and nucleotide sequences. Also, we have provided three color renderers for a better color appearance. By means of the ‘export’ module, a publication-quality figure could be generated. A user-friendly interface is provided in both the standalone package and online service of IBS.
3 The protein mode
Using options such as multiple sequence presentation, the polygonal elements for sequence annotation and enhanced markers for presenting functional sites, the protein DOG can be generated in a convenient manner. When drawing under the protein mode, the protein sequences, as well as their functional domains and sites, can be precisely pinpointed by simply specifying the starting and ending positions. Importantly, as shown in Figure 1A, a variety of drawing elements, such as polylines, polygons and information texts, have been integrated into IBS. As a result of such a wealth of drawing elements, the interaction factors as well as their annotation notes of a given protein can be easily marked on the biological sequences, which will be a great help in interpreting novel regulatory models. In addition, the cut- and dashed lines allow the protein sequence to be drawn when representing the functional domains that are distant from the ‘core’ regions. To display different functional sites in one protein, IBS also provides site markers with different shapes and colors for users, as demonstrated in Figure 1A.
Fig. 1.
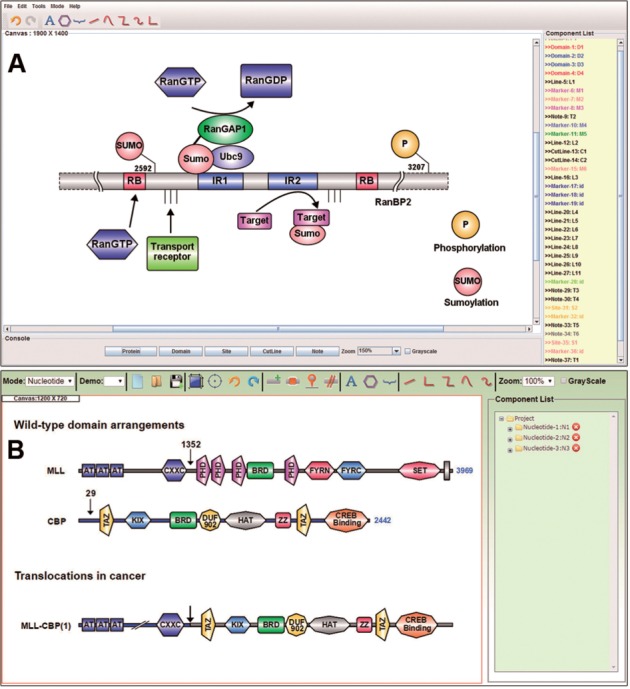
The main interface of IBS. (A) The standalone software showing the domain organization of E3 SUMO-protein ligase RanBP2 (Flotho and Werner, 2012). (B) The online service presenting the organization of bromodomain proteins and translocations in cancer (Muller et al., 2011)
4 The nucleotide mode
As the result of an extensive literature survey (Supplementary Table S1), it was found that many researchers prefer to use polygons to express the functional elements in nucleotide representation. Therefore, an interface mode with a distinct drawing style for nucleotide representation was developed. In Figure 1B, the polygonal elements that were provided in the nucleotide mode were extensively utilized. The polygonal elements can be set to different colors and different shapes, a feature that provides a much less constrained capacity for drawing operations. Also, several polyline elements were developed in the nucleotide mode. The color and thickness of the polylines can be varied to represent more diversified content in functional genes. Therefore, with the help of such powerful drawing elements, the complex genomic schematic diagram can be clearly and succinctly represented.
5 The color renderers for schematic diagrams
In addition to the earlier features, we also developed several professional color renderers in IBS. In our software, the gradient renderer is taken as a default style for all of the drawing elements. When using the gradient renderer to represent the functional elements or annotations, the color and the direction can be discretionarily varied by users. In particular, a specially designed crystal renderer has also been developed to enhance the esthetic quality of the schematic diagrams. Moreover, in consideration of the demand for the drawing of black-and-white images, IBS also provides a texture renderer. With the help of various built-in textures, experimentalists can now illustrate black-and-white diagrams so as to be able to meet different publication requirements.
6 Export of schematic diagrams
To provide a convenient means for preparing publication-quality figures, we have developed a fully functional export module for schematic diagrams. With the export interface, a resolution of 72, 300 and 600 dpi is permitted. Also, a variety of image formats, such as JPEG, PNG and TIFF, are supported. To obtain a lossless copy of the artwork, users can export the schematic diagram as a vector image in SVG format. In addition, an XML format is provided for the saving of all of the drawing details in a single project file.
7 The retrieval of annotations from UniProt
To facilitate the drawing process, IBS is currently equipped with a database visualization feature through which users can retrieve annotations from UniProt database. By providing UniProt accessions, annotations such as functional domains, short sequence motifs and modified residues are automatically retrieved and plotted upon users’ preferences. In addition, users can further manipulate the automatically generated artwork.
8 Conclusion
Here, we have developed a novel software called IBS, which is dedicated to the illustration of biological sequence organization. IBS was equipped with many features that are specifically designed for drawing both protein and nucleotide sequences. Notably, IBS was implemented with a configurable database visualization interface, which allows users to directly retrieve and specify annotations from UniProt database for the visualization. In the near future, more different annotations from other databases will be integrated, for example, the nucleotide sequence organizations from NCBI GenBank and the cancer somatic mutation information from TCGA. Thus, we believe that IBS is a useful tool for the biology research community, allowing the representation of findings in a simpler and more intuitive way.
Funding
This work was supported by grants from the National Basic Research Program (973 project) [2013CB933900, 2012CB911201 and 2012CB910101]; National Natural Science Foundation of China [31471252, 31171263, 81272578 and J1103514]; Guangdong Natural Science Funds for Distinguished Young Scholar [S20120011335]; Program for New Century Excellent Talents in University [NCET-13-0610]; Program of International S&T Cooperation [2014DFB30020].
Conflict of Interest: none declared.
Supplementary Material
References
- Flotho A., Werner A. (2012) The RanBP2/RanGAP1*SUMO1/Ubc9 complex: a multisubunit E3 ligase at the intersection of sumoylation and the RanGTPase cycle. Nucleus, 3, 429–432. [DOI] [PMC free article] [PubMed] [Google Scholar]
- Muller S., et al. (2011) Bromodomains as therapeutic targets. Expert Rev. Mol. Med., 13, e29. [DOI] [PMC free article] [PubMed] [Google Scholar]
- Ren J., et al. (2009) DOG 1.0: illustrator of protein domain structures. Cell Res., 19, 271–273. [DOI] [PubMed] [Google Scholar]
- Sigrist C.J., et al. (2013) New and continuing developments at PROSITE. Nucleic Acids Res., 41, D344–D347. [DOI] [PMC free article] [PubMed] [Google Scholar]
Associated Data
This section collects any data citations, data availability statements, or supplementary materials included in this article.