

Abstract
Objectives
The objective of this study is to assess the activity of anti-inflammatory cytokine IL-13 in blocking high-fat diet-induced obesity and obesity-associated insulin resistance and liver steatosis.
Methods
C57BL/6 mice were fed a high-fat diet and received hydrodynamic delivery of plasmids carrying the mouse Il-13 or Gfp (control) gene. IL-13 blood protein levels, food consumption and body weight of mice were continuously monitored for 8 weeks. Fat and lean masses of treated and control animals were determined at the end of the experiment. Serum concentrations of glucose, insulin, and lipids were determined, and mRNA levels of macrophage marker genes in adipose tissue and genes involved in energy metabolism were examined using real time PCR. Glucose tolerance and insulin sensitivity tests were performed to determine glucose homeostasis. Histochemistry and lipid assays were performed to determine the hepatic lipid accumulation.
Results
Blood concentration of IL-13 was 20 ng/ml one week after gene delivery and declined with time. Overexpression of IL-13 prevented high fat diet-induced weight gain without affecting food consumption. Mice that underwent Il-13 gene transfer showed regular body weight and normal serum concentrations of glucose and insulin, and less lipid accumulation in the liver. Overexpression of Il-13 blocked macrophage infiltration in adipose tissue and suppressed high-fat diet induced expression of inflammatory F4/80, Cd68 and Mcp1, and elevated expression of Ucp1 responsible for energy expenditure.
Conclusion
These results suggest that suppression of diet-induced inflammation by IL-13 is an effective strategy in preventing diet-induced obesity and obesity-associated insulin resistance and fatty liver.
Keywords: IL-13, obesity, insulin resistance, hydrodynamic gene transfer, fatty liver
Introduction
High fat diet (HFD)-induced obesity presents a serious threat to the current and future health of the human population due to its increasing incidence worldwide and association with many chronic and life threatening diseases such as cardiovascular diseases, type 2 diabetes, fatty liver and other metabolic disorders.1–3 Previous studies have shown that obesity is closely associated with chronic and low grade inflammation in the adipose tissue, accompanied by a higher level of pro-inflammatory and lower level of anti-inflammatory cytokines.4 Adipose-infiltrated macrophages appear to play a critical role in initiating such an immune imbalance.5 In HFD-induced obesity, the M2 type macrophage in adipose tissue is replaced by the M1 type, a phenomena that has been reported in obese patients.6 7 Macrophage polarization in adipose tissue is primarily regulated by anti-inflammatory cytokines such as IL-10 and IL-13.8, 9
IL-13 is secreted by many cell types especially Th2 cells. IL-13 is a member of major anti-inflammation cytokine family including IL-4, IL-10, and IL-35 that act to inhibit the production of pro-inflammatory cytokines or counteract many biological effects of pro-inflammatory mediators. IL-13 receptors are found in non-immune cells like hepatocytes suggesting its potential role in metabolism. Stanya et al. showed that IL-13 inhibits hepatic gluconeogenesis in a STAT3 dependent manner.10 In addition to suppressing inflammation and regulating glucose homeostasis, IL-13 is also found to contribute critically to cold-stimulated beige cell biogenesis.11, 12 In addition, studies by Nguyen et al and Qiu et al have shown that genetic disruption of the IL-4/IL-13 pathway abolished cold exposure-stimulated beige cell biogenesis, while pharmacological activation of the same pathway via exogenous administration of IL-4 induced beige fat development and reversed HFD-induced metabolic dysfunctions in obese mice 11, 12.
Although the role of inflammation in adiposity and development of obesity-associated complications has been well studied,13–16 fewer attempts have been made in the past to develop an immune-based intervention to control obesity-associated metabolic disorders. In this study, we took a gene transfer approach to overexpress the Il-13 gene in mice and examined its effect on HFD-induced obesity and obesity-associated insulin resistance, hyperglycemia and hepatic steatosis. We demonstrate that overexpression of the Il-13 gene in HFD-fed mice inhibits adipose tissue inflammation, blocks HFD-induced obesity, improves glucose homeostasis, and protects animals from development of liver steatosis. These results suggest that inhibition of inflammation by an anti-inflammatory cytokine, like IL-13, is an effective approach in blocking HFD-induced obesity and obesity-associated metabolic disorders.
Materials and Methods
Materials
The mouse Il-13 gene was sub-cloned from pORF5-mIL-13 plasmid (Invivogen; San Diego, CA) into the multiple cloning site of the pLIVE vector (Mirus Bio, Madison, WI) using restriction enzyme digestion. The Il-13 insertion was confirmed by DNA sequencing. A plasmid containing the Gfp gene and the same backbone of pLIVE vector was constructed and used as a control. These plasmids were prepared by cesium chloride-ethidium bromide gradient centrifugation and kept in saline at −80 °C until use. Plasmid purity was verified by absorbency ratio at 260 and 280 nm and electrophoresis on 1% agarose gel.
Animals and treatments
Male C57BL/6 mice were from Charles River Laboratories (Wilmington, MA) and housed in a 12 h light-dark cycle. All procedures performed on animals were approved by the Institutional Animal Care and Use Committee at the University of Georgia, Athens, Georgia. The high-fat diet (60% kJ/fats, 20% kJ/carbohydrates, 20% kJ/proteins) used in this study was purchased from Bio-Serv (Frenchtown, NJ; #F3282), and the normal chow was bought from LabDiet (St. Louis, MO; #5053). The published procedure for hydrodynamic tail vein injection17, 18 was followed for gene transfer using an injection volume equal to 9% of animal body weight, 1 µg plasmid DNA per mouse, and injection time at 5–8 sec.
Mice (9–10 week old) were injected with plasmid DNA containing either the Gfp or Il-13 gene. Animals with the Il-13 gene transfer were fed an HFD while the groups injected with the Gfp gene were fed either an HFD or regular chow. Body weight and food intake were monitored continuously for 8 weeks, and body composition was examined at the end of 8th week using EchoMRI-100 (Echo Medical System, Houston, TX). Animals were euthanized at the end of the feeding period and tissue samples were collected for histological and biochemical analysis.
Determination of IL-13 protein level in blood
Five mice were injected with 1 µg/mouse of Il-13-containing plasmid DNA. Blood samples were collected weekly for 7 weeks from tail veins using microvette CB300-LH (#22-043975) purchased from Fisher Scientific (Pittsburgh, PA). Serum was prepared from blood collected by centrifugation at 4,000 rpm for 5 min and kept in −80 °C until use. Circulating concentration of IL-13 was measured using an ELISA kit purchased from eBioscience (San Diego, CA, #88-7137-22) following the protocol provided by the manufacturer.
Glucose, insulin and pyruvate tolerance tests
In the glucose tolerance test, mice were fasted for 6 h and injected intraperitoneally with a glucose solution at a dose of 1.2 g per kg body weight. Blood samples were taken before and soon after glucose administration at different times and glucose concentrations determined using electronic glucose meter and test strips (TRUEtrack™, NIPRO; Fort Lauderdale, FL). In the insulin tolerance test, mice were fasted for 4 h and blood glucose levels were determined before and at different times post an intraperitoneal injection of regular human insulin (Humulin®, Lilly; Indianapolis, IN) at 0.75 U per kg. A pyruvate tolerance test was performed similarly, but the animals were fasted for 18 h and sodium pyruvate (1.5 g/kg) was intraperitoneally injected according to a previously established procedure 19.
Determination of serum insulin level
Blood samples were collected from fasted mice, and serum was obtained as described above. Serum insulin levels were determined using a commercial ELISA kit (Mercodia; Uppsala, Sweden) following the manufacturer’s instruction. Homeostasis calculation for insulin resistance (HOMA-IR) was performed as: HOMA-IR = Fasting insulin (ng/ml) × Fasting plasma glucose (mg/dl) / 405. 20
Gene expression analysis by real-time PCR
Tissue samples were freshly collected from animals and frozen immediately in liquid nitrogen until use. Total RNA was isolated from the liver using a TriZol® reagent (Invitrogen; Carlsbad, CA). RNeasy® kit (QIAGEN; # 74804) and QIAzol® lysis reagent (QIAGEN; # 79306) were used for RNA isolation from adipose tissues. One microgram of total RNA was used for synthesis of the first complementary DNA strand as recommended by the cDNA synthesis kit (qScript cDNA Supermix; Quanta Bioscience # 95048-025). Real-time PCR was performed using SYBR Green as an indicator and GAPDH as an internal loading control. PCR was carried out for 40 cycles at 95 °C for 15 sec and 60 °C for 1 min each cycle. Data was normalized to the internal control and ΔΔCt method was used for data analysis. Primer sequences used are provided in Table 1. Melting curve analysis of all real-time PCR products was conducted and showed a single DNA duplex.
Table 1.
Primer sets for real time RT-PCR analysis of gene expression
| Name | Forward sequence | Reverse sequence |
|---|---|---|
| Adpq | AGCCGCTTATATGTATCGCTCA | TGCCGTCATAATGATTCTGTTGG |
| Pparγ2 | TCGCTGATGCACTGCCTATG | GAGAGGTCCACAGAGCTGATT |
| Cpt1a | CTCCGCCTGAGCCATGAAG | CACCAGTGATGATGCCATTCT |
| Srebp1c | CCCTGTGTGTACTGGCCTTT | TTGCGATGTCTCCAGAAGTG |
| Pepck | AAGCATTCAACGCCAGGTTC | GGGCGAGTCTGTCAGTTCAAT |
| G6Pase | CGACTCGCTATCTCCAAGTGA | GTTGAACCAGTCTCCGACCA |
| Ucp1 | AGGCTTCCAGTACCATTAGGT | CTGAGTGAGGCAAAGCTGATTT |
| Ucp2 | GCGTTCTGGGTACCATCCTA | GCTCTGAGCCCTTGGTGTAG |
| Pgc1α | GAAGTGGTGTAGCGACCAATC | AATGAGGGCAATCCGTCTTCA |
| F4/80 | CCCCAGTGTCCTTACAGAGTG | GTGCCAGAGTGGATGTCT |
| Cd68 | CCATCCTTCACGATGACACCT | GGCAGGGTTATGAGTGACAGTT |
| Mcp1 | ACTGAAGCCAGCTCTCTCTTCCTC | TTCCTTCTTGGGGTCAGCACAGAC |
| Arg1 | TCCACACGTCCAGAACAGTC | CCTTGGAAACAGAGACAGGC |
| Cd206 | CAGGTGTGGGCTCAGGTAGT | TGTGGTGAGCTGAAAGGTGA |
| Il-4 | GGTCAACCCCCAGCTAGT | GCCGATGATCTCTCTCAAGTGAT |
| Gapdh | AGGTCGGTGTGAACGGATTTG | TGTAGACCATGTAGTTGAGGTCA |
Histological analysis
Samples from the liver, and white and brown adipose tissues were freshly collected from the sacrificed animals and fixed in 10% neutral buffered formalin. Tissue samples were processed, embedded in paraffin, and sectioned at 6µm in thickness and stained using hematoxylin and eosin staining kit (#3500; BBC Biochemical, Atlanta, GA). In Oil-red O staining, tissue samples were collected and immediately frozen. Frozen sections were made at 8µm in thickness and fixed in 10% neutral buffered formalin for 30 min. Tissue sections were washed with phosphate-buffered saline and rinsed with 60% isopropanol for 5 min before being stained in a freshly prepared Oil-red O working solution (Electron Microscopy Sciences, Hatfield, PA) for 30 min. Tissue sections were rinsed and then stained with hematoxylin for 1 min. The slides were examined under the optical microscope (ECLIPSE Ti; Nikon, Melville, NY) and adipocyte size was measured using NIS-Elements imaging platform purchased from Nikon Instruments (Melville, NY).
Measurement of serum concentration of liver specific enzymes
Enzymes alanine aminotransferase (ALT) and aspartate aminotransferase (AST) were measured using the commercial kit (#TR71121) from Thermo-Scientific (Middleton, VA) following the protocol from the manufacturer.
Measurements of liver triglyceride content
The Folch method 21 was used for determining liver triglyceride content. Briefly, the liver was homogenized in the chloroform-methanol mixture (2:1) and incubated in 4°C overnight. After centrifugation in 12,000 rpm for 20 min at 4 °C, the supernatant was collected, dried in a lyophilizer, and re-dissolved in 5% Triton-X100. Triacylglycerol concentration was determined using the commercial kit (Thermo-Scientific, Middleton, VA), following the instructions provided by the manufacturer.
Statistics analysis
The data is expressed as mean ± SEM for each group (n=5), and statistical significance was determined using an analysis of variance. Prism GraphPad® software (GraphPad Software, Inc., La Jolla, CA) was used for depicting the plots and statistical tests. A value of P < 0.05 was considered statistical significance.
Results
Il-13 gene transfer blocks weight gain in mice fed an HFD
Hydrodynamic gene delivery was employed to transfer mouse Il-13 gene into C57BL/6 mice, and IL-13 blood protein levels were monitored weekly. At a dose of 1 µg/mouse of pLIVE-mIL-13 plasmids, blood concentration of IL-13 was 20 ng in week 1, and decreased thereafter reaching background levels in week 4 (Figure 1a). Data in Figure 1b shows that Il-13 gene transfer blocked HFD-induced weight gain. At the end of the experiment, the average body weight of mice fed a regular chow was 31.0 ± 1.8, similar to that of HFD-fed mice injected with pLIVE-mIL-13 plasmids (31.6 ± 2.4 g), and about 12 g less than the body weight of HFD-fed mice injected with control plasmids carrying a Gfp gene (43.6 ± 2.2). IL-13 treated and control mice are visually distinguished by their apparent sizes (Figure 1c). There was remarkable difference in fat mass of mice with IL-13 gene transfer in comparison to those of Gfp gene injected HFD-fed control mice (Figure. 1d). Direct measurement of fat mass after euthanasia of animals showed significantly less epididymal, inguinal and perirenal fat in Il-13 gene transferred mice in comparison to their pGFP+HFD treated counterparts (Figure 1e). Continuous measurements of food and energy consumption revealed that there was no statistical difference in energy intake between the two groups of mice fed a HFD (Figure 1f). The calculated caloric intake of animals in each group (pmIL-13+HFD, pGFP+HFD, pGFP+Chow [consistent with figure labels]) was 15.7 ± 2.3, 16.5 ± 2.6 and 11.9 ± 2.2 kcal/mouse/day, respectively. These results suggest that Il-13 overexpression completely blocked HFD-induced fat mass gain in animals.
Figure 1. Time dependent expression of mIL-13 and its impact on body weight and energy intake of mice fed either regular or high fat diet.

(a) Serum level of IL13 in normal mice after hydrodynamic delivery of 1µg/animal of pLIVE-mIL13 plasmid; (b) body weight gain of animals over an 8-week period after hydrodynamic injection of 1µg/mouse of pLIVE-mIL13 fed an HFD (●) or pLIVE-GFP plasmids fed a regular chow (Δ) or HFD (■); (c) representative images of animals 8 weeks after gene transfer and fed with either a regular chow or an HFD; (d) body composition; and (e) weight of epididymal (EWAT), inguinal (IWAT) and perirenal (PRWAT) fat pad of animas at the end of 8-week on selected diets after plasmid transfer; and (f) average energy intake (kcal/mouse/day) of animas with gene transfer. Solid bars (■) represents animals injected with pLIVE-mIL13 plasmids and fed a HFD; open bars (□) represents animals injected with pLIVE-gfp plasmids and fed an HFD; and grey bars (■) represent animals injected with pLIVE-gfp and fed a regular chow. Data represent mean ± SEM (n=5). * P<0.05 compared with pGFP+HFD mice; **, P<0.05 compared to pGFP+HFD mice, and *** P<0.01 compared to pGFP+HFD mice.
Il-13 gene transfer inhibited hypertrophy of adipocytes and reduced inflammation in white adipose tissue
The diameters of adipocytes are directly proportional to the degree of obesity in animals. Figure 2a shows that the adipocytes in epididymal, inguinal and perirenal fat pads of IL-13 treated mice are significantly smaller than those of HFD-fed control injected with pLIVE-GFP plasmids, suggesting that IL-13 blocked hypertrophy development of the adipocytes (Figures 2b, 2c). The effect of IL-13 on macrophage activation in adipose tissue was assessed by histochemistry. Figure 2a shows that crown-like structure, defined as an adipocyte surrounded by macrophages, was readily seen in HFD-fed control mice (arrows in Figure 2a inserts), but hardly seen in tissue sections of IL-13 treated mouse adipose tissue. Results from real time PCR analysis of adipose tissues (Figure 2d) show that the relative expression of the inflammation marker genes (Cd68, F4/80 and Mcp1) is significantly lower in animals with Il-13 gene transfer. HFD feeding decreased expression of Il-4 and Adiponectin in the white adipose tissue in Gfp treated control animals, and Il-13 gene transfer maintained their expression levels. As anticipated, IL-13 overexpression increases Arg1 expression, which was associated with an elevated mRNA level of Il-10 (Supplementary Figure 1). Collectively, these data demonstrate that Il-13 gene transfer is effective in inhibiting HFD-induced inflammation in white adipose tissue.
Figure 2. mIl-13 gene transfer prevented adipocyte hypertrophy and adipose tissue inflammation.

(a) Representative images of hematoxylin and eosin stained tissue sections of EWAT, IWAT, PRWAT and brown adipose tissue (BAT); (b) average size of adipocytes in EWAT; (c) average size of adipocytes in IWAT, and (d) relative mRNA levels of proinflammatory and anti-inflammatory genes in EWAT. Values in b and c represent average ± SEM of total number of adipocytes seen in three tissue slices (63 adipocytes per slice). (■) Animals injected with pLIVE mIl-13 plasmids and fed an HFD; (□) animals injected with pLIVE-GFP plasmids and fed HFD and (■) animals injected with pLIVE-GFP plasmids and fed a regular chow. Data represent mean ± SEM (n=5). * P<0.05 compared with pGFP+HFD mice; # P<0.05 compared with pGFP + Chow mice.
Hydrodynamic Il-13 gene transfer improved glucose tolerance and insulin sensitivity
Obesity-associated glucose intolerance and insulin resistance are related to adipose tissue inflammation.22–24 To investigate whether the blockade of adipose tissue inflammation by IL-13 overexpression affects glucose homeostasis, we ran an intra-peritoneal glucose tolerance test (IPGTT) and insulin tolerance test (ITT) in mice after 8 weeks of either high-fat or normal diet feeding. While glucose intolerance was apparent in HFD-fed control animals with Gfp gene transfer, mice with Il-13 gene transfer significantly improved glucose tolerance (Figure 3a). The AUC of the IPGTT curve confirms glucose tolerance (Figure 3b) in mice with IL-13 gene transfer. In concurrence with this observation, ITT shows that Il-13 overexpression maintained insulin sensitivity at the normal level similar to that of mice fed a regular chow (Figure 3c). In addition, fasting serum insulin levels in HFD-fed animals injected with Gfp plasmids is 2-fold higher than that of IL-13 treated and normal mice fed a regular chow (Figure 3d). Calculation of insulin resistance (Figure 3e) showed insulin resistance in HFD-fed control mice with Gfp gene transfer. In contrast, animals with Il-13 gene transfer show normal insulin sensitivity identical to that of animals fed a regular chow (Figure 3e). Gluconeogenesis is an important process of glucose homeostasis that is elevated in obesity.25 In order to examine the effect of IL-13 on hepatic gluconeogenesis, we performed a pyruvate tolerance test and observed remarkable inhibition of gluconeogenesis in Il-13 overexpressing mice compared to an elevated level in HFD-fed control (Figure 3f). mRNA levels of key regulatory genes involved in gluconeogenesis, Pepck and G6Pase in the liver, showed reduction in animals with Il-13 gene transfer (Figure 3g), suggesting that IL-13-mediated inhibition of gluconeogenesis occurs not only at functional level but also at gene expression level.
Figure 3. Hydrodynamic delivery of mIl-13 gene maintained glucose tolerance and insulin sensitivity in mice fed a HFD.

(a) Intraperitoneal glucose tolerance test (IPGTT); profile of blood glucose concentration versus time; (b) area under the curve of IPGTT after intraperitoneal injection of glucose solution; (c) insulin tolerance test (ITT); profile of blood glucose concentration (percentage of initial value) as a function of time upon intraperitoneal injection of insulin; (d) fasting insulin level in the mice; (e) result of homeostatic model assessment for insulin resistance (HOMA-IR); (f) pyruvate tolerance test; profile of blood glucose concentration versus time after intraperitoneal injection of sodium pyruvate solution; and (g) relative mRNA levels of gluconeogenesis related genes, Pepck and G6Pase in liver. In panels a and c: (●) Animals injected with pLIVE-IL13 plasmids and fed an HFD; (■) animals injected with pLIVE-GFP plasmids and fed an HFD; and (▲) animals injected with pLIVE-GFP plasmids and fed a regular chow. In panels b, d, e and f: (■) animals injected with pLIVE-IL13 plasmids and fed an HFD; (□) animals injected with pLIVE-GFP plasmids and fed an HFD; and (■) animals injected with pLIVE-GFP plasmids and fed a regular chow. Data represent mean ± SEM (n=5). * P<0.05 compared with pGFP +HFD mice; # P<0.05 compared to pGFP + Chow mice.
IL-13 maintains high level of Ucp gene expression
Non-shivering thermogenesis mainly occurs in brown adipose tissue in cold exposure by activation of uncoupling protein 1 gene (Ucp1) in mitochondria. This process also happens in the liver with Ucp2 subtype. Higher expression of the Ucp1 gene in brown and white adipose tissues was observed in IL-13 treated animals (Figure 4a). Similarly, mRNA levels of Ucp2 in the liver is also significantly elevated in mice injected with pLIVE-mIL-13 plasmids (Figure 4b), comparing to that of HFD-fed control animals injected with pLIVE-GFP control plasmids. These results suggest that IL-13 overexpression enhanced UCP-mediated energy expenditure.
Figure 4. Impacts of mIl-13 gene transfer on expression of genes of thermogenesis.
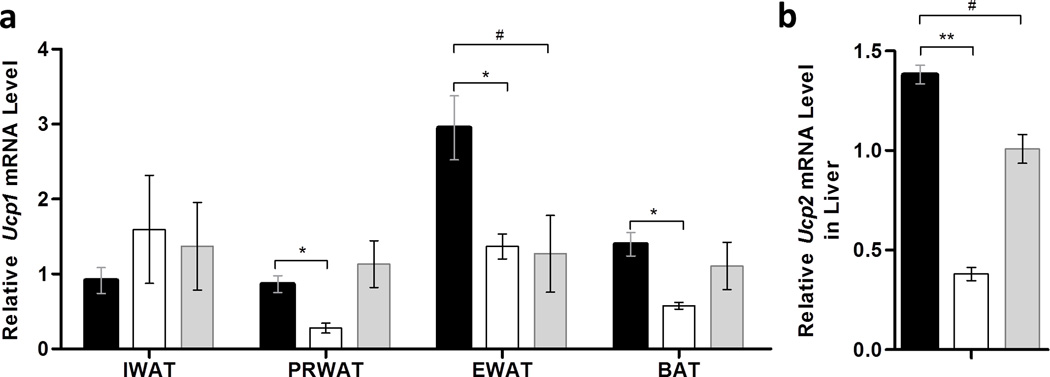
(a) Relative mRNA levels of Ucp1 in white and brown adipose tissue; (b) relative mRNA levels of Ucp2 in liver. (■) Animals injected with pLIVE-IL13 plasmids and fed an HFD; (□) animals injected with pLIVE-GFP plasmids and fed an HFD; and (■) animals injected with pLIVE-GFP plasmids and fed a regular chow. Data represent mean ± SEM (n=5). * P<0.05 compared with pGFP+HFD mice; # P<0.05 compared with pGFP+Chow mice.
Il-13 gene transfer inhibits ectopic fat accumulation in the liver
Non-alcoholic fatty liver is one complication related to HFD-induced obesity and associated with inflammation 26. We then examined the effect of IL-13 overexpression on the liver. Measurement of liver enzymes, aspartate aminotransferase (AST) and alanine aminotransferase (ALT) at the end of the 8th week of experiment showed that Il-13 gene transfer and expression did not cause a significant increase in serum concentration of these liver specific markers (Figure 5a–b). Abundance and magnitude of white vacuoles in H&E and red droplets in Red oil O staining, reflecting lipid level in the HFD-fed control animals comparing to those fed a regular chow, suggest development of fatty liver in HFD-fed control animals (Figure 5c). The lipid droplets are markedly smaller and scarce in liver sections of animals with Il-13 gene transfer, inferring inhibitory effect of IL-13 on fat accumulation in hepatocytes. Biochemical assessment of triglyceride content in the liver revealed that HFD doubled the triglyceride content of the liver in HFD-fed control mice compared to animals fed a normal chow, or HFD with Il-13 gene transfer (Figure 5d). HFD feeding greatly elevated expression of Pparγ2, Pgc1α and Cpt1a genes, while transfer of the Il-13 gene markedly repressed these elevations (Figure 5e). Control mice fed an HFD show a reduced expression of Srebp1c gene, which was restored by IL-13 overexpression (Figure 5e). In aggregate, these data demonstrate that overexpression of IL-13 gene blocked ectopic fat accumulation in the liver, accompanied by repressed expression of Pparγ2.
Figure 5. mIl-13 gene delivery prevents high-fat diet-induced fatty liver.

(a) Blood concentration of aspartate aminotransferase; (b) blood concentration of alanine aminotransferase; (c) representative images of liver sections with H&E or Oil-red O staining; (d) liver triglyceride level; and (e) relative mRNA levels of genes involved fat accumulation in the liver. (■) Animals injected with pLIVE-IL13 plasmids and fed an HFD; (□) animals injected with pLIVE-GFP plasmids and fed an HFD; and (■) animals injected with pLIVE-GFP plasmids and fed a regular chow. Data represent mean ± SEM (n=5). * P<0.05 compared with pGFP+HFD mice; # P<0.05 compared with pGFP+chow mice.
Discussion
Chronic inflammation contributes substantially to the pathogenesis of obesity and obesity-associated metabolic disorders. We have shown in our previous studies that suppressing adipose tissue inflammation by macrophage depletion 27 or overexpression of another anti-inflammatory cytokine, IL-10, blocks HFD-induced weight gain and development of insulin resistance 28. In the current study, we examined the impacts of Il-13 gene overexpression on preventing HFD-induced obesity, its associated insulin resistance and fatty liver. Our data demonstrate that hydrodynamic delivery of the Il-13 gene completely blocked HFD-induced adiposity (Figure 1), maintained insulin sensitivity (Figure 3) and prevented hepatic steatosis (Figure 5). Mechanistically, these beneficial effects were mediated, at least partly, by repressed adipose inflammation (Figure 2), reduced hepatic gluconeogenesis and enhanced adaptive thermogenesis (Figure 4).
Adipose macrophage infiltration and its subsequent adipose chronic inflammation contribute profoundly to the development of obesity and obesity-associated metabolic dysfunctions such as insulin resistance in fat and ectopic fat deposition in liver. Accordingly, suppressing this pathogenic inflammation generates a variety of metabolic benefits in treating obesity. 27, 28 Since the adipose inflammation is primarily mediated by macrophages, we concentrated on the effect of IL-13 mainly on macrophages rather than other immune cells in the present study. Monocyte chemoattractant protein-1 (MCP1) plays important roles in recruiting macrophages into adipose tissue, and overexpression of this pivotal chemokine is correlated with exaggerated adipose inflammation and insulin resistance.29 Our data shows a significant reduction in the expression of Mcp1 accompanied with lower macrophage infiltration into white adipose tissue of mice with Il-13 gene transfer (Figure 3d). Such an effect by IL-13 was previously observed in other organs like kidney and intestine.30, 31 It has been previously demonstrated that the classically activated macrophages (M1 type) is primarily involved in pathogenic inflammation while the alternatively activated macrophages (M2 type) play an important role in tissue remodeling and angiogenesis in adipose tissue.32 Activation of the IL-4/IL-13 pathway stimulates M2 macrophage polarization and represses chronic inflammation.9 As anticipated, overexpression of IL-13 in the current study increased or maintained expression of anti-inflammatory markers (Arg1, Il-4, Il-10 and Adiponectin) while completely blocking elevated expression of pro-inflammatory marker genes (F4/80, Cd68 and Mcp1) (Figure 3d). It is highly likely that the repressed adipose inflammation exerted by IL-13 overexpression may contribute substantially to the metabolic benefits observed in the present study.
The IL-13 mediated improvement in glucose homeostasis can be attributed to repressed inflammation in the adipose tissue and reduced gluconeogenesis in liver. Previous studies showed that IL-4 and IL-13 improve insulin sensitivity by tyrosine phosphorylation and activation of IRS1 through JAK1/STAT6 pathway.33, 34 It has been well appreciated that suppressing adipose inflammation is able to improve insulin sensitivity. The fact that IL13 suppresses gluconeogenesis in the liver, along with improved glucose profile and insulin sensitivity, suggests that hepatic gluconeogenesis play a crucial role in systemic glucose homeostasis and inflammation in the liver. IL-13 mediated inhibition of gluconeogenesis likely involves the subunit of IL-13Rα receptor and STAT3 that regulates Pepck and G6Pase expression in hepatocytes, supporting the notion that IL-13 applies impact on gluconeogenesis without involving other immune components.10, 34
Recent studies show that the IL-4/IL-13 pathway is involved in beige fat development in response to cold stimulation, suggesting that activating this pathway may be capable of enhancing energy expenditure.8, 11, 12 Conversely, previous studies showed that IL-13 KO animals have attenuated oxygen consumption, with no change in food intake.10 IL-4 and IL-13 were connected to non-shivering thermogenesis by stimulating the release of catecholamines from M2 macrophages. Animals kept under cold conditions had adipose infiltrated eosinophils that subsequently released IL-4/IL-13 stimulating M2 macrophage polarization and contributing to catecholamines release and maintenance of body temperature.12 This thermogenic circuit is of high significance in the context of cold. Higher expression of thermogenesis-associated protein Ucp1 in white adipose tissue and Ucp2 in liver of animals with Il-13 gene transfer (Figure 4) suggests that blockade of HFD-induced weight gain by Il-13 gene transfer may be achieved, at least in part, by enhanced energy expenditure induced by overexpression of Il-13.
In conclusion, we demonstrate in this study that overexpression of anti-inflammatory cytokine, IL-13, is effective in blocking the progression of HFD-induced obesity and its associated complications, suggesting that anti-inflammation could be an effective strategy in dealing with obesity epidemics. It should be pointed out, however, that the approach undertaken in the current study may have side effects that could limit its clinical applicability. More mechanistic studies are needed to unveil the effect of IL-13 on energy metabolism at molecular level. More animal studies are also needed to examine the effectiveness of the gene transfer approach to revers obesity, to identify the associated side effects, and to define the limitations of selected genes and their plausibility in preventing and treating obesity and its related metabolic disorders.
Supplementary Material
Acknowledgement
We would like to thank Miss Ryan Fugett for English editing of the manuscript. This work was supported in part by a grant from NIH (RO1HL098295).
Footnotes
Conflict of Interest
The authors declare no conflict interest.
Supplementary information is available on IJO’s website.
References
- 1.Caprio S, Daniels SR, Drewnowski A, Kaufman FR, Palinkas LA, Rosenbloom AL, et al. Influence of Race, Ethnicity, and Culture on Childhood Obesity: Implications for Prevention and Treatment. Obesity. 2008;16:2566–2577. doi: 10.1038/oby.2008.398. [DOI] [PubMed] [Google Scholar]
- 2.Malik VS, Willett WC, Hu FB. Global obesity: trends, risk factors and policy implications. Nat Rev Endocrinol. 2013;9:13–27. doi: 10.1038/nrendo.2012.199. [DOI] [PubMed] [Google Scholar]
- 3.Zimmet P, Alberti K, Shaw J. Global and societal implications of the diabetes epidemic. Narure. 2001;414:728–787. doi: 10.1038/414782a. [DOI] [PubMed] [Google Scholar]
- 4.Sun K, Kusminski CM, Scherer PE. Adipose tissue remodeling and obesity. The J Clin Invest. 2011;121:2094–2101. doi: 10.1172/JCI45887. [DOI] [PMC free article] [PubMed] [Google Scholar]
- 5.Nishimura S, Manabe I, Nagai R. Adipose tissue inflammation in obesity and metabolic syndrome. Discov Med. 2009;8:55–60. [PubMed] [Google Scholar]
- 6.Fujisaka S, Usui I, Bukhari A, Ikutani M, Oya T, Kanatani Y, et al. Regulatory mechanisms for adipose tissue M1 and M2 macrophages in diet-induced obese mice. Diabetes. 2009;58:2574–2582. doi: 10.2337/db08-1475. [DOI] [PMC free article] [PubMed] [Google Scholar]
- 7.Wentworth JM, Naselli G, Brown WA, Doyle L, Phipson B, Smyth GK, et al. Pro-inflammatory CD11c+CD206+ adipose tissue macrophages are associated with insulin resistance in human obesity. Diabetes. 2010;59:1648–1656. doi: 10.2337/db09-0287. [DOI] [PMC free article] [PubMed] [Google Scholar]
- 8.Wu D, Molofsky AB, Liang HE, Ricardo-Gonzalez RR, Jouihan HA, Bando JK, et al. Eosinophils sustain adipose alternatively activated macrophages associated with glucose homeostasis. Science. 2011;332:243–247. doi: 10.1126/science.1201475. [DOI] [PMC free article] [PubMed] [Google Scholar]
- 9.Sica A, Mantovani A. Macrophage plasticity and polarization: in vivo veritas. J Clin Invest. 2012;122:787–795. doi: 10.1172/JCI59643. [DOI] [PMC free article] [PubMed] [Google Scholar]
- 10.Stanya KJ, Jacobi D, Liu S, Bhargava P, Dai L, Gangl MR, et al. Direct control of hepatic glucose production by interleukin-13 in mice. J Clin Invest. 2013;123:261–271. doi: 10.1172/JCI64941. [DOI] [PMC free article] [PubMed] [Google Scholar]
- 11.Nguyen KD, Qiu Y, Cui X, Goh YP, Mwangi J, David T, et al. Alternatively activated macrophages produce catecholamines to sustain adaptive thermogenesis. Nature. 2011;480:104–108. doi: 10.1038/nature10653. [DOI] [PMC free article] [PubMed] [Google Scholar]
- 12.Qiu Y, Nguyen KD, Odegaard JI, Cui X, Tian X, Locksley RM, et al. Eosinophils and type 2 cytokine signaling in macrophages orchestrate development of functional beige fat. Cell. 2014;157:1292–1308. doi: 10.1016/j.cell.2014.03.066. [DOI] [PMC free article] [PubMed] [Google Scholar]
- 13.Cardilo-Reis L, Gruber S, Schreier SM, Drechsler M, Papac-Milicevic N, Weber C, et al. Interleukin-13 protects from atherosclerosis and modulates plaque composition by skewing the macrophage phenotype. EMBO Mol Med. 2012;4:1072–1086. doi: 10.1002/emmm.201201374. [DOI] [PMC free article] [PubMed] [Google Scholar]
- 14.Ji Yewei, Sun Shengyi, Xu Aimin, Bhargava Prerna, Yang Liu, Lam Karen SL, et al. Activation of Natural Killer T Cells Promotes M2 Macrophage Polarization in Adipose Tissue and Improves Systemic Glucose Tolerance via Interleukin-4 (IL-4)/STAT6 Protein Signaling Axis in Obesity. J Biol Chem. 2012;287:13561–13571. doi: 10.1074/jbc.M112.350066. [DOI] [PMC free article] [PubMed] [Google Scholar]
- 15.Wynn TA. IL-13 EFFECTOR FUNCTIONS. Annu Rev Immunol. 2003;21(1):425–456. doi: 10.1146/annurev.immunol.21.120601.141142. [DOI] [PubMed] [Google Scholar]
- 16.Kanneganti T-D, Dixit VD. Immunological complications of obesity. Nat Immunol. 2012;13:707–712. doi: 10.1038/ni.2343. [DOI] [PubMed] [Google Scholar]
- 17.Liu F, Song Y, Liu D. Hydrodynamics-based transfection in animals by systemic administration of plasmid DNA. Gene Ther. 1999;6:1258–1266. doi: 10.1038/sj.gt.3300947. [DOI] [PubMed] [Google Scholar]
- 18.Zhang G, Budker V, Wolff JA. High levels of foreign gene expression in hepatocytes after tail vein injections of naked plasmid DNA. Hum Gene Ther. 1999;10:1735–1737. doi: 10.1089/10430349950017734. [DOI] [PubMed] [Google Scholar]
- 19.Watanabe C, Seino Y, Miyahira H, Yamamoto M, Fukami A, Ozaki N, et al. Remodeling of hepatic metabolism and hyperaminoacidemia in mice deficient in proglucagon-derived peptides. Diabetes. 2012;61:74–84. doi: 10.2337/db11-0739. [DOI] [PMC free article] [PubMed] [Google Scholar]
- 20.Wallace TM, Levy JC, Matthews DR. Use and abuse of HOMA modeling. Diabetes care. 2004;27:1487–1495. doi: 10.2337/diacare.27.6.1487. [DOI] [PubMed] [Google Scholar]
- 21.Folch J, Lees M, Sloane-Stanley G. A simple method for the isolation and purification of total lipids from animal tissues. J Biol Chem. 1957;226:497–509. [PubMed] [Google Scholar]
- 22.Ye J. Mechanisms of insulin resistance in obesity. Front. Med. 2013;7:14–24. doi: 10.1007/s11684-013-0262-6. [DOI] [PMC free article] [PubMed] [Google Scholar]
- 23.Alkhouri N, Gornicka A, Berk MP, Thapaliya S, Dixon LJ, Kashyap S, et al. Adipocyte Apoptosis, a Link between Obesity, Insulin Resistance, and Hepatic Steatosis. J Biol Chem. 2010;285:3428–3438. doi: 10.1074/jbc.M109.074252. [DOI] [PMC free article] [PubMed] [Google Scholar]
- 24.Feng Bin, Jiao Ping, Nie Yaohui, Kim Thomas, Jun Dale, van Rooijen Nico, et al. Clodronate Liposomes Improve Metabolic Profile and Reduce Visceral Adipose Macrophage Content in Diet-Induced Obese Mice. PLoS ONE. 2011;6:e24358. doi: 10.1371/journal.pone.0024358. [DOI] [PMC free article] [PubMed] [Google Scholar]
- 25.Gastaldelli A, Baldi S, Pettiti M, Toschi E, Camastra S, Natali A, et al. Influence of obesity and type 2 diabetes on gluconeogenesis and glucose output in humans: a quantitative study. Diabetes. 2000;49:1367–1373. doi: 10.2337/diabetes.49.8.1367. [DOI] [PubMed] [Google Scholar]
- 26.Hou CH, Hung L-M, Huang J-P. Exploring the non-alcoholic fatty liver disease pathogenesis mechanisms in high fat and high fructose diet fed rat (649.3) FASEB J. 2014;28:649.3. [Google Scholar]
- 27.Bu L, Gao M, Qu S, Liu D. Intraperitoneal injection of clodronate liposomes eliminates visceral adipose macrophages and blocks high-fat diet-induced weight gain and development of insulin resistance. AAPS J. 2013;15:1001–1011. doi: 10.1208/s12248-013-9501-7. [DOI] [PMC free article] [PubMed] [Google Scholar]
- 28.Gao M, Zhang C, Ma Y, Bu L, Yan L, Liu D. Hydrodynamic delivery of mIL10 gene protects mice from high-fat diet-induced obesity and glucose intolerance. Mol Ther. 2013;21:1852–1861. doi: 10.1038/mt.2013.125. [DOI] [PMC free article] [PubMed] [Google Scholar]
- 29.Kamei N, Tobe K, Suzuki R, Ohsugi M, Watanabe T, Kubota N, et al. Overexpression of monocyte chemoattractant protein-1 in adipose tissues causes macrophage recruitment and insulin resistance. J Biol Chem. 2006;281:26602–26614. doi: 10.1074/jbc.M601284200. [DOI] [PubMed] [Google Scholar]
- 30.Farmer DG, Ke B, Shen XD, Kaldas FM, Gao F, Watson MJ, et al. Interleukin-13 protects mouse intestine from ischemia and reperfusion injury through regulation of innate and adaptive immunity. Transplantation. 2011;91:737–743. doi: 10.1097/TP.0b013e31820c861a. [DOI] [PMC free article] [PubMed] [Google Scholar]
- 31.Zhu C, Zhang A, Huang S, Ding G, Pan X, Chen R. Interleukin-13 inhibits cytokines synthesis by blocking nuclear factor-kappaB and c-Jun N-terminal kinase in human mesangial cells. J Biomed Res. 2010;24:308–316. doi: 10.1016/S1674-8301(10)60043-7. [DOI] [PMC free article] [PubMed] [Google Scholar]
- 32.Cho CH, Koh YJ, Han J, Sung HK, Jong Lee H, Morisada T, et al. Angiogenic role of LYVE-1-positive macrophages in adipose tissue. Circ Res. 2007;100:e47–e57. doi: 10.1161/01.RES.0000259564.92792.93. [DOI] [PubMed] [Google Scholar]
- 33.Jiang H, Harris MB, Rothman P. IL-4/IL-13 signaling beyond JAK/STAT. J Allergy Clin Immunol. 2000;105:1063–1070. doi: 10.1067/mai.2000.107604. [DOI] [PubMed] [Google Scholar]
- 34.Umeshita-Suyama R, Sugimoto R, Akaiwa M, Arima K, Yu B, Wada M, et al. Characterization of IL-4 and IL-13 signals dependent on the human IL-13 receptor alpha chain 1: redundancy of requirement of tyrosine residue for STAT3 activation. Int Immunol. 2000;12:1499–1509. doi: 10.1093/intimm/12.11.1499. [DOI] [PubMed] [Google Scholar]
Associated Data
This section collects any data citations, data availability statements, or supplementary materials included in this article.