

Abstract
OBJECTIVE
Education is inversely associated with coronary heart disease (CHD) risk, however the mechanisms are poorly understood. The study objectives were to evaluate the extent to which rarely measured factors (literacy, time preference, sense of control) and more commonly measured factors (income, depressive symptomatology, body mass index) in the education-CHD literature explain the associations between education and CHD risk.
METHOD
The study sample included 346 participants, aged 38–47 years (59.5% women), of the New England Family Study birth cohort. Ten-year CHD risk was calculated using the validated Framingham risk algorithm that utilizes diabetes, smoking, blood pressure, total cholesterol, HDL cholesterol, age and gender. Multivariable regression and mediation analyses were performed.
RESULTS
Regression analyses adjusting for age, race/ethnicity and childhood confounders (e.g. parental socioeconomic status, intelligence) demonstrated that relative to those with ≥college education, men and women with <high school had 73.7% (95% confidence interval (CI): 29.5, 133.0) and 48.2% (95% CI: 17.5, 86.8) higher 10-year CHD risk, respectively. Mediation analyses demonstrated significant indirect effects for reading comprehension in women (7.2%; 95% CI: 0.7, 19.4) and men (7.2%; 95% CI: 0.8, 19.1), and depressive symptoms (11.8%; 95% CI: 2.5, 26.6) and perceived constraint (6.7%, 95% CI: 0.7, 19.1) in women.
CONCLUSIONS
Evidence suggested that reading comprehension in women and men, and depressive symptoms and perceived constraint in women, may mediate some of the association between education and CHD risk. If these mediated effects are interpreted causally, interventions targeting reading, depressive symptoms, and perceived constraint could reduce educational inequalities in CHD.
Keywords: education, mediation, coronary heart disease, literacy, depression, sense of control
INTRODUCTION
As shown in a 2011 systematic review and meta-analysis, education is inversely associated with CHD risk (Manrique-Garcia, Sidorchuk, Hallqvist, & Moradi, 2011), however controversy exists whether the relationship is independent of infrequently measured confounders, and if it is, what are the underlying mechanisms (Falkstedt & Hemmingsson, 2011; Fujiwara & Kawachi, 2009; Gilman et al., 2008; Loucks et al., 2012; Madsen, Andersen, Christensen, Andersen, & Osler, 2010). For example, the contributions of several potential explanatory mechanisms are poorly understood, including literacy, time preference and sense of control. Furthermore, few studies account for prospectively assessed early life potential confounders such as childhood intelligence, chronic physical illness, body mass index (BMI) or socioeconomic position (SEP) (Loucks et al., 2012). Understanding the mechanisms helps to identify potential targets for intervention, and etiologic knowledge of how education could influence CHD.
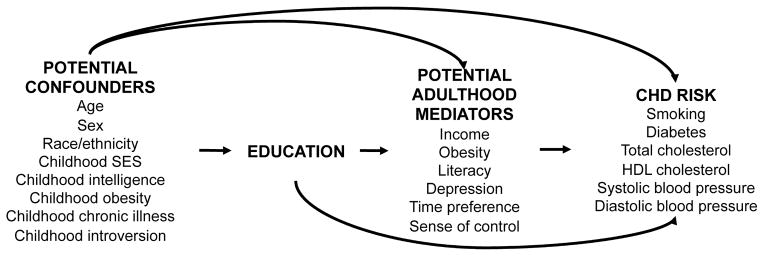
There are a number of novel potential mediating mechanisms by which education could influence CHD (Figure 1). For example, literacy is influenced by education, and may influence health through several ways, such as improved understanding of public health messages, instructions from health professionals, and ability to understand medication instructions (Baker et al., 2007; Martin et al., 2011). A second potential mechanism is “time preference”, which refers to abilities to delay gratification when costs and benefits of a behavior fall at different time points (Fuchs, 2004). For example, those with future-oriented time preference may be less likely to smoke cigarettes in order to reduce likelihood of developing CHD or other diseases in the future, compared to those with present-oriented time preference. Education may change people’s time preference to become more future-oriented, through training individuals to prepare for, and anticipate, careers they will not experience until the future. Alternatively, those with future-oriented time preference may be more likely to obtain more schooling, thereby delaying immediate gratification of wages in the hopes for higher wages and autonomy in the future (Fuchs, 2004). A third potential mechanism is sense of control, which can be operationalized as two dimensions: personal mastery (a person’s sense of efficacy or effectiveness in carrying out goals), and perceived constraints (the extent to which one believes there are obstacles or factors beyond one’s control that interfere with reaching goals (Lachman & Weaver, 1998)). Higher levels of education are associated with greater sense of control in most studies (Mirowsky & Ross, 2007). Education imparts skills, knowledge and economic returns that may lead to one having a greater sense of control over one’s life, which could then improve health behaviors (e.g. diet, smoking, medication adherence) that influence CHD risk. Further potential mechanisms include income, obesity and depression, all of which are typically associated with education and are CHD risk markers (Lorant et al., 2003; Manrique-Garcia et al., 2011; McLaren, 2007; Nemeroff & Goldschmidt-Clermont, 2012). The goal of the study was to evaluate potential mechanisms by which education may influence CHD risk. We considered the extent to which rarely measured factors (literacy, time preference, sense of control) and more commonly measured factors (income, depressive symptomatology, body mass index) in this literature may explain the association between education and CHD risk.
Figure 1.
MATERIALS AND METHODS
Sample
Study participants were from the New England Family Study (NEFS), which is comprised of 17,921 offspring of pregnant women in the Collaborative Perinatal Project (CPP) at the Providence, Rhode Island and Boston, Massachusetts sites (United States) between 1959 and 1974 (Niswander & Gordon, 1972). The current NEFS sub-study, named the EdHealth Study, was comprised of NEFS participants selected with preference for racial/ethnic minorities and having either low or high educational attainment. There were 914 participants selected, of which 898 were eligible (e.g. living, not incarcerated), and 618 participated, resulting in a 68.8% response rate. All independent and dependent variables, as well as potential mediators, were assessed during 2005–2007 at mean age 42 years. The potential childhood confounders were assessed at study visits occurring between the prenatal period and age 7 years. Of the 618 participants, we excluded 42 participants not interviewed in person (did not complete physiological assessments), and 136 participants without blood samples (e.g. due to refusal, difficulty with blood flow from veins); an additional 11 participants were excluded due to missing ≥1 Framingham risk algorithm component. We further excluded participants with ≥1 missing covariate (n=83). Accordingly, the analytic sample size was 346. The study protocol was approved by the Harvard School of Public Health institutional review board.
Independent Variable
Education was determined as self-reported highest degree completed, categorized as: “<high school” (GED or <high school), “≥high school, <college” (high school degree, schooling after high school including completing some college course work for credit, technical/trade/vocational school, associate’s degree or certificate program), and “≥college” (e.g. bachelor’s degree, graduate degree).
Dependent Variable
Ten-year CHD risk was calculated as a percentage, using the validated Framingham risk algorithm (Wilson et al., 1998). This algorithm uses Cox regression models that incorporate diabetes status, total and HDL cholesterol, systolic and diastolic blood pressure, smoking, age and gender, described in detail elsewhere (Wilson et al., 1998). The c-statistic for prediction of CHD events in the Framingham Heart Study is 0.74 in men and 0.77 in women, suggesting good predictive validity (Wilson et al., 1998). External validity tests on white and black participants perform reasonably well (D’Agostino, Grundy, Sullivan, & Wilson, 2001).
Current smoking was based on self-report (yes/no). Lipids were measured in non-fasting plasma samples at CERLab (Harvard Medical School, Boston, MA) using a Hitachi 911 analyzer, and participating in the CDC/NHLBI Lipid Standardization Program. Total cholesterol (CV=1.7%) and HDL cholesterol (CV=3.3%) were measured enzymatically, described elsewhere (Allain, Poon, Chan, Richmond, & Fu, 1974; Rifai et al., 1998). Presence of diabetes was assessed by self-report as ever having been told by a doctor or health professional that participant has diabetes (non-gestational). Five systolic and diastolic blood pressure measurements were obtained over one-minute intervals in participants seated, after 5 minutes rest, in the right arm at heart level, using automated blood pressure monitors (VSMedTech BpTru, Coquitlam, BC, Canada) demonstrated to have good validity and reliability compared with the auscultation method (Mattu, Heran, & Wright, 2004). Systolic and diastolic blood pressure values were calculated as the mean of the lowest three systolic or diastolic blood pressure readings, excluding the first recorded blood pressure.
Potential Childhood Confounders
Potential childhood confounders were obtained prenatally through age 7 years. Parental socioeconomic position was assessed, using a weighted percentile of both parents’ educational attainment, occupation, and income relative to the US population prenatally and at age 7 (Myrianthopoulos & French, 1968). Childhood chronic medical conditions were derived from physical examinations by CPP pediatricians at ages 1 and 7 years, obtained via mothers’ reports at each visit, and extracted from medical records at ages 1 and 7. Summaries of childhood health conditions were compiled by CPP pediatricians. The current study used a summary score of number of chronic physical health conditions (including abnormalities of the liver, cardiovascular conditions, hematologic conditions (e.g. anemia), lower respiratory tract abnormality (e.g. asthma), neoplastic disease, neurologic abnormality, and prolonged/recurrent hospitalization) that excluded psychological or behavioral problems, coded for analytic purposes as 0 or ≥1 medical conditions. Childhood intellectual development at age 7 was defined using the Full-Scale Intelligence Quotient (IQ) score from the Wechsler Intelligence Scale for Children, and the Wide Range Achievement Test (WRAT) (Jastak & Jastak, 1965; Wechsler, 1949). Age 7 height and weight were evaluated directly by CPP study technicians, and converted into BMI (kg/m2). Childhood BMI was included as a potential confounder due to evidence that obesity may limit upward social mobility (i.e. dampen increases in SEP across the life course) (Finkelstein, Ruhm, & Kosa, 2005).
Potential Mechanisms
Time preference was measured using a 3-item scale based on a short version of the Consideration of Future Consequences Scale, modified to simplify the language due to concerns that the scale required high literacy levels (Gurmankin Levy, Micco, Putt, & Armstrong, 2006; Strathman, Gleicher, Boninger, & Edwards, 1994). Participants were asked how strongly they agreed with the following three questions, with 7-level likert response options (1=strongly disagree, 7=strongly agree): “I only deal with things that are happening now, and assume that the future will take care of itself”; “Convenience is a big factor in the decisions I make or the actions I take”; and “I often ignore problems in my life because I think they are unlikely to become a big deal.” Scores (1–7 for each item) were averaged, with lower scores indicating more future-oriented time preference. The 3-item scale had reasonable internal consistency (Cronbach’s α=0.59) but due to modified language, did not have other assessments of validity and reliability.
Sense of control was measured using two dimensions: personal mastery and perceived constraints, both measured using items developed by Lachman and Weaver (Lachman & Weaver, 1998) as an extension of the Pearlin and Schooler Mastery Scale (Pearlin & Schooler, 1978). Response options were on a 7-point likert scale (1=strongly disagree, 7=strongly agree). Within each of the personal constraints and personal mastery scales, items were reverse scored as needed, and the mean scores were calculated, where higher scores represented higher personal constraints and higher personal mastery. Internal consistency (Cronbach’s α) was 0.84 and 0.71 for the personal constraints and personal mastery scales, respectively.
Four literacy skills were assessed. Reading comprehension, oral language (speaking), and aural language (listening) were assessed using subtests of the Woodcock Johnson III Tests of Achievement, a standardized test normed against a representative U.S. population (Martin et al., 2011; Woodcock, McGrew, & Mather, 2001). Numeracy was assessed using an eight- item scale adapted from Lipkus et al. (Lipkus, Samsa, & Rimer, 2001), described elsewhere (Martin et al., 2011). Analogously to Lipkus et al. (Lipkus et al., 2001), our group conducted a factor analysis for the numeracy items using the 8×8 matrix of tetrachoric correlations, which are used to assess the correlation among dichotomous variables. Factor analysis confirmed a one-factor solution, with all 8 items loading on the first factor (individual loadings each exceeded 0.4). The first factor accounted for 86.3% of the variance.
Adulthood height and weight were assessed by trained technicians using standardized protocols, engaged in regular quality control/quality assurance, and converted to BMI (kg/m2). Depressive symptomatology was evaluated using the established Center for Epidemiologic Studies Depression (CES-D) 10-item scale, calculated as a sum of the 10 items (range 10–40) (Kohout, Berkman, Evans, & Cornoni-Huntley, 1993). Family income was assessed via the poverty income ratio.
Analytic Methods
Multivariable-adjusted linear regression analyses evaluated associations of education with calculated 10-year CHD risk. Formal statistical tests of product terms between education and sex demonstrated significant effect modification (p=0.02), consequently analyses were performed separately for males and females. Analyses used generalized estimating equations to account for clustering by family.
We assessed whether literacy, sense of control, time preference, income, body mass index or depressive symptomatology were potential mediators of the association between education and 10-year CHD risk using a multiple mediation model. This model simultaneously estimates associations between each mediator and the education exposure, along with change in the outcome (10-year CHD risk) associated with the mediator in the fully adjusted model, and calculates an indirect effect using the product of coefficients method described elsewhere (Hayes, 2009; Preacher & Hayes, 2008; Valeri & Vanderweele, 2013). The indirect effect is the reduction in the association of the exposure on the outcome due to the potential mediator. Examining the indirect effect provides evidence of whether education may exert effects uniquely through any of the potential mediators. Confidence intervals were estimated by using bias-corrected bootstrapping procedure with 5000 resamples (Hayes, 2009; Preacher & Hayes, 2008). Analyses were conducted using SAS version 9.1.3 (SAS Institute, Cary, NC).
RESULTS
A comparison between included (n=346) vs. excluded (n=272) participants found that included were slightly younger (42.2 vs. 42.8 years, respectively; p<0.001), more likely to be white race/ethnicity (74% vs. 81%, respectively; p=0.03), and had higher reading comprehension (12.9 vs.11.8 correct answers, respectively; p=0.008) and numeracy (5.6 vs. 5.3 correct answers; p=0.03)). There were no significant differences (p>0.05) between included and excluded participants for gender, education, systolic blood pressure, diastolic blood pressure, total cholesterol, HDL cholesterol, smoking, diabetes, or childhood covariates (parental SEP, childhood intelligence, chronic illness, BMI).
Descriptive statistics demonstrated that a number of childhood factors were associated with later life educational attainment including measures of cognitive function (WRAT score and FSIQ scores), parental socioeconomic position, and in men only, race/ethnicity (Tables 1 and 2). Furthermore, education was associated with 10-year estimated CHD risk, smoking and diabetes in both men and women, and HDL cholesterol, systolic blood pressure, and diastolic blood pressure in women only (Tables 1 and 2). With respect to potential mediators, education was associated with poverty:income ratio and all literacy measures (oral, aural, numeracy, reading comprehension) in both men and women, as well as with adulthood BMI, depressive symptomatology and sense of control (perceived constraints) in women (Tables 1 and 2).
Table 1.
Women: descriptive characteristics showing the outcome variables, potential confounders and potential mediators by education level. Estimates represent means or percentages (95% confidence intervals).
| <High School (n=33) | ≥High School, <College (n=118) | ≥College (n=56) | Overall (n=207) | |
|---|---|---|---|---|
| Outcome, Framingham Score Components | ||||
| 10-year CHD risk, % | 4.6 (3.1, 6.1)* | 2.4 (2.0, 2.8) | 2.0 (1.6, 2.4) | 2.7 (2.3, 3.0) |
| Smoker, % | 54.5 (36.4, 71.9)* | 30.0 (21.6, 38.8)* | 10.7 (4.0, 21.9) | 28.5 (22.5, 35.2) |
| HDL cholesterol, mg/dL | 43.6 (39.3, 47.9)* | 56.8 (53.4, 60.2) | 57.8 (53.6, 62.1) | 55.0 (52.5, 57.4) |
| Total cholesterol, mg/dL | 185.5 (168.8, 202.1) | 192.1 (185.7, 198.6) | 199.0 (188.8, 209.3) | 192.9 (187.7, 198.2) |
| Systolic blood pressure, mmHg | 116.5 (110.5, 122.5)* | 112.1 (109.2, 115.0)* | 106.6 (103.0, 110.2) | 111.3 (109.1, 113.5) |
| Diastolic blood pressure, mmHg | 77.6 (73.3, 81.9)* | 73.5 (71.5, 75.4)* | 70.4 (67.9, 73.0) | 73.3 (71.8, 74.8) |
| Diabetes, % | 12.1 (3.4, 28.2)* | 9.3 (4.8, 16.1)* | 1.8 (1.0, 9.6) | 7.7 (4.5, 12.3) |
| Potential Confounders | ||||
| Age, y | 42.3 (41.6, 42.9) | 41.9 (41.6, 42.2) | 42.0 (41.5, 42.5) | 42.0 (41.8, 42.2) |
| Race/ethnicity, % white | 63.6 (45.1, 79.6) | 88.1 (80.9, 93.4) | 76.8 (63.6, 87.0) | 81.2 (75.2, 86.3) |
| Childhood WRAT standardized arithmetic, score | 91.9 (88.4, 95.5)* | 100.8 (99.1, 102.5) | 101.4 (99.3, 103.5) | 99.5 (98.2, 101.8) |
| Childhood WRAT standardized reading, score | 96.1 (89.6, 102.7)* | 105.9 (103.2, 108.7)* | 111.9 (106.9, 116.9) | 106.0 (103.6, 108.4) |
| Childhood WRAT standardized spelling, score | 92.2 (86.7, 97.6)* | 102.9 (100.1, 105.1)* | 107.1 (102.6, 111.5) | 102.3 (100.3, 104.3) |
| Childhood FSIQ, score | 89.7 (85.2, 94.1)* | 101.4 (99.3, 103.5)* | 105.8 (102.6, 109.0) | 100.7 (99.0, 102.4) |
| Childhood BMI, kg/m2 | 15.9 (15.2, 16.5) | 16.1 (15.8, 16.4) | 16.4 (15.8, 16.9) | 16.1 (15.9, 16.4) |
| Childhood chronic medical conditions, % | 27.3 (13.3, 45.5) | 11.0 (6.0, 18.1) | 19.6 (10.2, 32.4) | 15.9 (11.2, 21.7) |
| Parental SEP index | 32.1 (25.5, 38.6) | 56.8 (53.1, 60.5) | 63.8 (57.9, 69.7) | 54.7 (51.6, 57.9) |
| Potential Adulthood Mediators | ||||
| Depressive symptomatology, CES-D score | 21 (18, 23)* | 15 (15, 16) | 14 (13, 15) | 16 (15, 17) |
| BMI, kg/m2 | 31.4 (28.3, 34.5)* | 28.2 (26.7, 29.7) | 27.4 (25.5, 29.3) | 28.5 (27.4, 29.6) |
| Poverty income ratio | 2.5 (1.5, 3.4)* | 4.3 (3.8, 4.7)* | 5.4 (4.6, 6.1) | 4.3 (3.9, 4.6) |
| Time preference, score | 3.6 (3.1, 4.2) | 3.4 (3.1, 3.6) | 3.1 (2.7, 3.4) | 3.3 (3.1, 3.5) |
| Sense of control: | ||||
| Perceived constraints, score | 2.7 (2.2, 3.2)* | 2.5 (2.3, 2.7)* | 2.0 (1.8, 2.3) | 2.4 (2.2, 2.6) |
| Perceived mastery, score | 6.1 (5.8, 6.4) | 6.0 (5.8, 6.1) | 6.2 (6.0, 6.4) | 6.0 (5.9, 6.1) |
| Literacy: | ||||
| Oral, score | 5.8 (4.5, 7.1)* | 7.9 (7.1, 8.7) | 8.7 (7.4, 10.0) | 7.8 (7.1, 8.4) |
| Aural, score | 5.0 (3.8, 6.2)* | 8.7 (7.9, 9.5)* | 10.1 (8.8, 11.4) | 8.5 (7.9, 9.2) |
| Numeracy, score | 3.7 (3.0, 4.3)* | 5.2 (4.9, 5.5)* | 6.1 (5.8, 6.5) | 5.2 (5.0, 5.4) |
| Reading comprehension, score | 7.8 (6.3, 9.3)* | 12.1 (11.3, 12.8)* | 15.0 (13.9, 16.1) | 12.2 (11.5, 12.8) |
BMI, Body Mass Index; CES-D, Center for Epidemiologic Studies Depression; FSIQ, Full Scale Intelligence Quotient; HDL, High Density Lipoprotein; SEP, Socioeconomic Position; WRAT, Wide Range Achievement Test.
p<0.05 for group vs. ≥College
Table 2.
Men: descriptive characteristics showing the outcome variables, potential confounders and potential mediators by education level. Estimates represent means or percentages (95% confidence intervals).
| <High School (n=22) | ≥High School, <College (n=73) | ≥College (n=44) | Overall (n=139) | |
|---|---|---|---|---|
| Outcome, Framingham Score Components | ||||
| 10-year CHD risk, % | 7.8 (6.1, 9.4)* | 7.1 (6.2, 8.0)* | 5.8 (4.8, 6.8) | 6.8 (6.2, 7.4) |
| Smoker, % | 50.0 (28.2, 71.8)* | 19.2 (10.9, 30.1) | 13.6 (5.2, 27.4) | 22.3 (15.7, 30.1) |
| HDL cholesterol, mg/dL | 40.0 (34.7, 45.4) | 41.2 (38.4, 44.0) | 42.4 (38.9, 45.9) | 41.4 (39.4, 43.4) |
| Total cholesterol, mg/dL | 202.0 (187.6, 216.4) | 204.5 (195.7, 213.2) | 197.1 (182.6, 211.6) | 201.7 (195.0, 208.5) |
| Systolic blood pressure, mmHg | 119.9 (115.9, 124.0) | 120.9 (117.2, 124.6) | 117.2 (114.0, 120.5) | 119.6 (117.3, 121.8) |
| Diastolic blood pressure, mmHg | 79.3 (76.6, 82.0) | 79.8 (77.0, 82.6) | 77.7 (75.2, 80.3) | 79.1 (73.4, 80.8) |
| Diabetes, % | 0.0* | 5.5 (1.5, 13.4) | 4.6 (1.0, 15.5) | 4.3 (1.6, 9.2) |
| Potential Confounders | ||||
| Age, y | 42.6 (41.9, 43.4) | 42.5 (42.1, 42.9) | 42.4 (41.9, 43.0) | 42.5 (42.2, 42.8) |
| Race/ethnicity, % white | 68.2 (45.1, 86.1)* | 82.2 (71.4, 90.2) | 86.4 (72.7, 94.8) | 81.3 (73.8, 87.4) |
| Childhood WRAT standardized arithmetic, score | 93.0 (88.1, 97.8)* | 99.4 (97.2, 101.6)* | 105.2 (103.0, 107.5) | 100.2 (98.6, 101.9) |
| Childhood WRAT standardized reading, score | 95.3 (87.3, 103.2)* | 102.5 (99.1, 105.8)* | 113.4 (106.9, 119.9) | 104.8 (101.7, 107.9) |
| Childhood WRAT standardized spelling, score | 91.5 (86.2, 96.8)* | 98.6 (95.6, 101.5)* | 108.2 (102.3, 114.0) | 100.5 (97.8, 103.2) |
| Childhood FSIQ, score | 95.3 (88.6, 102.0)* | 103.2 (100.1, 106.2)* | 112.8 (109.3, 116.2) | 105.0 (102.6, 107.3) |
| Childhood BMI, kg/m2 | 16.1 (15.6, 16.6) | 16.0 (15.7, 16.3) | 16.2 (15.7, 16.7) | 16.1 (15.8, 16.3) |
| Childhood chronic medical conditions, % | 22.7 (7.8, 45.4) | 12.3 (5.8, 22.1) | 20.5 (9.8, 35.3) | 16.6 (10.7, 23.8) |
| Parental SEP index | 39.6 (32.6, 46.6)* | 53.6 (48.5, 58.7)* | 60.9 (53.4, 68.3) | 53.7 (49.8, 57.5) |
| Potential Adulthood Mediators | ||||
| Depressive symptomatology, CES-D score | 17 (14, 20) | 15 (14, 17) | 15 (13, 16) | 15 (14, 16) |
| BMI, kg/m2 | 30.9 (28.8, 32.9) | 31.1 (29.2, 33.0) | 29.9 (27.7, 32.1) | 30.7 (29.4, 31.9) |
| Poverty income ratio | 4.1 (2.7, 5.5)* | 4.8 (4.2, 5.4)* | 6.3 (5.5, 7.0) | 5.2 (4.7, 5.6) |
| Time preference, score | 3.3 (2.7, 4.0) | 3.6 (3.3, 3.9) | 3.5 (3.1, 3.9) | 3.5 (3.3, 3.8) |
| Sense of control: | ||||
| Perceived constraints, score | 2.3 (1.8, 2.8) | 2.5 (2.2, 2.7) | 2.4 (2.1, 2.7) | 2.4 (2.3, 2.6) |
| Perceived mastery, score | 6.0 (5.6, 6.4) | 6.1 (5.9, 6.2) | 5.8 (5.4, 6.1) | 6.0 (5.8, 6.1) |
| Literacy: | ||||
| Oral, score | 6.3 (5.0, 7.6)* | 7.3 (6.5, 8.2)* | 10.8 (9.4, 12.1) | 8.3 (7.6, 9.0) |
| Aural, score | 6.2 (4.9, 7.5)* | 7.4 (6.5, 8.2)* | 8.8 (7.4, 10.2) | 7.6 (7.0, 8.3) |
| Numeracy, score | 5.5 (4.9, 6.1)* | 5.8 (5.5, 6.1)* | 7.3 (7.0, 7.5) | 6.2 (6.0, 6.5) |
| Reading comprehension, score | 11.1 (9.3, 13.0)* | 13.3 (12.3, 14.3)* | 16.2 (15.3, 17.1) | 13.9 (13.2, 14.6) |
BMI, Body Mass Index; CES-D, Center for Epidemiologic Studies Depression; FSIQ, Full Scale Intelligence Quotient; HDL, High Density Lipoprotein; SEP, Socioeconomic Status; WRAT, Wide Range Achievement Test.
p<0.05 for group vs. ≥College
In multivariable-adjusted analyses, models that adjusted for age, race/ethnicity and potential childhood confounders (parental socioeconomic index, age 7 intelligence, childhood chronic illnesses and age 7 BMI) demonstrated that men and women with less than high school education had 73.7% (95% CI: 29.5, 133.0) and 48.2% (95% CI: 17.5, 78.6) higher 10-year CHD risk compared to those with at least a college degree, respectively (Table 3). In women, formal tests for mediation provided evidence of significant indirect effects for reading comprehension (7.2%; 95% CI: 0.7, 19.4), depressive symptoms (11.8%; 95% CI: 2.5, 26.6) and perceived constraint (6.7%, 95% CI: 0.7, 19.1) (Table 4), suggesting these factors explain some of the association between education and CHD risk. As an example for interpreting indirect effects, for the case of reading comprehension, the mediation estimate can be interpreted as of the total effect of 73.7% increase in CHD risk for women with less than high school education vs. those with at least a college degree, 7.2% may be mediated through reading comprehension while the remaining 66.5% (i.e. 73.7% minus 7.2%) may occur through other mechanisms. In men, mediation tests provided evidence of significant indirect effects of education through reading comprehension (indirect effect: 7.2%; 95% CI: 0.8, 19.1) (Table 4). In both men and women, there was less evidence for mediation by other factors such as adulthood BMI, income, perceived mastery, time preference, aural language, oral language or numeracy (Table 4).
Table 3.
Multivariable adjusted associations of education with 10-year estimated CHD risk. Effect estimates (i.e. [(exp(β)-1)×100]) represent % change in 10-year CHD risk for specific education category (i.e. “<high school” or “≥high school, <college”) vs. referent education category (i.e. ≥college). Numerical values in parentheses represent 95% confidence intervals.
| <High School | ≥High School, <College | |
|---|---|---|
| Females (n=207) | ||
| Total Effect Models | ||
| Model 1: Age, race | 109.7 (56.2, 181.5)* | 22.0 (3.7, 43.7)* |
| Model 2: Model 1 + childhood confounders§ | 73.7 (29.5, 133.0)* | 18.9 (1.3, 39.7)* |
| Direct Effect Models | ||
| Model 3: Model 2 + BMI, CES-D, income | 70.0 (23.1, 134.7)* | 18.9 (3.5, 36.5)* |
| Model 4: Model 2 + perceived constraints | 69.2 (26.2, 126.9)* | 16.0 (−0.8, 35.6) |
| Model 5: Model 2 + perceived mastery | 70.1 (26.6, 128.7)* | 17.7 (0.6, 37.6)* |
| Model 6: Model 2 + time preference | 75.0 (30.8, 134.0)* | 19.2 (1.7, 38.9)* |
| Model 7: Model 2 + aural literacy | 75.0 (26.6, 142.1)* | 19.0 (1.3, 39.8)* |
| Model 8: Model 2 + oral literacy | 74.2 (29.8, 133.7)* | 19.1 (1.3, 40.1)* |
| Model 9: Model 2 + numeracy | 67.8 (23.6, 128.0)* | 17.1 (−0.4, 37.9) |
| Model 10: Model 2 + reading comprehension | 71.2 (25.1, 134.3)* | 18.5 (0.8, 39.3)* |
| Full Model (all variables) | 68.3 (17.4, 141.3)* | 16.3 (1.2, 33.7)* |
|
| ||
| Males (n=139) | ||
| Total Effect Models | ||
| Model 1: Age, race | 40.6 (10.7, 78.6)* | 24.4 (3.1, 50.1)* |
| Model 2: Model 1 + childhood confounders§ | 48.2 (17.5, 86.8)* | 31.2 (7.5, 60.1)* |
| Direct Effect Models | ||
| Model 3: Model 2 + BMI, CES-D, income | 45.5 (14.2, 85.3)* | 29.6 (5.8, 58.8)* |
| Model 4: Model 2 + perceived constraints | 48.5 (17.2, 88.3)* | 30.8 (7.1, 59.6)* |
| Model 5: Model 2 + perceived mastery | 48.2 (17.5, 87.0)* | 31.1 (7.7, 59.5)* |
| Model 6: Model 2 + time preference | 49.4 (18.4, 88.5)* | 31.5 (7.9, 60.2)* |
| Model 7: Model 2 + aural literacy | 50.7 (20.0, 89.3)* | 33.9 (8.8, 64.8)* |
| Model 8: Model 2 + oral literacy | 46.9 (16.4, 85.4)* | 29.4 (5.9, 58.0)* |
| Model 9: Model 2 + numeracy | 46.1 (15.7, 84.6)* | 29.2 (5.2, 58.7)* |
| Model 10: Model 2 + reading comprehension | 41.6 (13.4, 76.9)* | 28.7 (5.6, 56.8)* |
| Full Model (all variables) | 43.7 (13.6, 81.9)* | 30.5 (5.6, 61.4)* |
Childhood confounders include parental socioeconomic index, age 7 intelligence, childhood chronic illness, childhood introversion, age 7 body mass index.
BMI, body mass index; CES-D, Center for Epidemiologic Studies Depression Scale.
p<0.05 for group vs. referent (≥College) point estimate (β=0).
Table 4.
Mediation tests evaluating indirect effects of education on 10-year estimated CHD risk, stratified by gender. Point estimates (indirect effects= [(exp(β)-1)×100]) represent % change in relative 10-year risk for specific education category vs. referent education category, due to the addition of the mediator into the model. Numerical values in parentheses represent 95% confidence intervals.
| Women (n=207) | Men (n=139) | |||
|---|---|---|---|---|
|
| ||||
| <High School | ≥High School, <College | <High School | ≥High School, <College | |
| Poverty income ratio | −4.8 (−14.6, 1.0) | −2.8 (−9.4, 0.4) | −1.1 (−11.7, 5.4) | −0.8 (−7.8, 3.9) |
| Body mass index | 15.4 (−0.4, 33.5) | 4.2 (−6.9, 13.1) | 0.3 (−1.2, 5.6) | 0.7 (−0.7, 5.4) |
| Depressive symptoms | 11.8 (2.5, 26.6)* | 3.1 (0.4, 8.8)* | −0.8 (−8.7, 1.5) | 0.2 (−2.8, 0.9) |
| Sense of Control | ||||
| Perceived mastery | 1.8 (−1.0, 10.4) | 2.1 (−0.3, 8.5) | −0.7 (−8.4, 1.9) | 0.9 (−6.7, 2.4) |
| Perceived constraint | 6.7 (0.7,19.1)* | 4.7 (0.8,11.3)* | 0.8 (−1.3, 7.7) | 0.2 (−1.1, 3.5) |
| Time preference | 1.8 (−1.6, 10.0) | 1.3 (−0.7, 6.3) | −0.6 (−7.7, 2.0) | 0.0 (−2.0, 2.7) |
| Literacy | ||||
| Aural | −0.8 (−6.0, 2.6) | −0.3 (−4.1, 1.0) | 0.0 (−3.0, 3.8) | −0.0 (−2.9, 2.0) |
| Oral | −0.6 (−6.4, 2.1) | −0.1 (−3.7, 2.4) | −0.8 (−9.3, 7.5) | −0.1 (−7.8, 6.7) |
| Numeracy | 5.4 (−2.1, 15.3) | 2.8 (−1.1, 8.3) | 5.4 (−1.4,18.6) | 6.0 (−2.8,17.1) |
| Reading comprehension | 7.2 (0.7, 19.4)* | 0.3 (−4.5, 1.0) | 7.2 (0.8,19.1)* | 5.1 (0.5,13.9) |
All models are adjusted for age, race/ethnicity, and childhood confounders (parental socioeconomic index, age 7 intelligence, childhood chronic illness, childhood introversion, age 7 body mass index).
p<0.05 for group vs. referent (≥College) point estimate (β=0).
DISCUSSION
This study’s findings suggested that reading comprehension in women and men, and depressive symptoms and perceived constraint in women, explain part of the association between education and CHD risk.
Prior Literature
While studies showed associations of education with the potential factors explored in this study (i.e. literacy, sense of control, time preference, BMI, depressive symptomatology, income) (Guthrie, Butler, & Ward, 2009; Kutner, Greenberg, Jin, & Paulsen, 2006; Lorant et al., 2003; McLaren, 2007; Mirowsky & Ross, 2007), and associations of these factors with CVD risk (Baker et al., 2007; Manrique-Garcia et al., 2011; Martin et al., 2011; Nemeroff & Goldschmidt-Clermont, 2012; Surtees, Wainwright, Luben, Khaw, & Day, 2006), there has been little exploration of whether these factors may mediate or confound the relation between education and CVD risk.
With regard to literacy, a study using structural equation modeling suggested functional health literacy was a mediator between socioeconomic position and perceptions of the importance of various behaviors that influence cancer risk (e.g. smoking, diet, physical activity, overweight) (Adams et al., 2013). Our study found evidence of mediation between education and CHD risk for reading comprehension, and less evidence for numeracy, aural and oral literacy as mediators. Very little is known about contributions of individual literacy components as mediators. Reading comprehension may be the most important literacy factor linking education to CHD risk, but findings should be replicated.
Sense of control is another potential mediator. A prospective study of 3,888 participants showed associations between education and incident CHD were reduced by 27% after adjusting for sense of control (Bosma et al., 2005). In another study, associations between education and incident mortality were reduced by 54% after adjusting for perceived control (Bosma, Schrijvers, & Mackenbach, 1999). These findings supported ours showing evidence of mediation for perceived constraint in women. Prior studies did not show gender-specific findings, although the 2005 study (Bosma et al., 2005) found no significant effect modification by gender. Studies to date have not reported findings separately for perceived constraint vs. perceived mastery (Bosma et al., 2005). It may be that perceived constraint is a more important mediator between education and CHD risk as shown in the current study, but these results should be replicated.
With regard to time preference, there has been little evidence in the few studies to date that time preference may be an explanatory mechanism between education and health, with health measured via health behaviors (e.g. smoking, obesity) and self-rated health, and time preference assessed using closed-ended intertemporal choices to elicit time preference for monetary outcomes or the Zimbardo Time Perspective Inventory (Guthrie et al., 2009; van der Pol, 2011). This is consistent with our findings. The field is still new, and potential for findings remain, perhaps with more sophisticated assessments of health outcomes and time preference, and larger sample sizes.
Depressive symptomatology is a potential mediator. A large number of prospective studies demonstrated that depression is positively associated with CHD risk (Frasure-Smith & Lesperance, 2010; Nicholson, Kuper, & Hemingway, 2006). With regard to potential mediation of the association between education and CHD by depression, a study in NHANES I showed a 9% reduction in effect size in the relation between education and incident CHD after further adjustment for depressive symptomatology (Thurston, Kubzansky, Kawachi, & Berkman, 2006). The current study results add to the literature evidence that depressive symptomatology may be a mediator between education and CHD risk, particularly in women. The observed indirect effect of 11.8% through depressive symptomatology represents 16% of the total effect (i.e. 11.8% indirect effect / 73.7% total effect = 16.0% of the total effect). This small to medium indirect effect size is expected, given the large number of potential mediators. With regard to adulthood BMI, little is known about the role specifically of BMI as a mediator between education and CVD risk. Findings in this study do not show significant evidence of adulthood BMI as a mediator between education and CHD risk. Evidence for income as a potential mediator in a previous study on 22,688 US participants showed that further adjustment for income reduced the strength of effect between education and incident CVD events by 8% (Albert, Glynn, Buring, & Ridker, 2006). This suggests that impacts of education on CVD may be somewhat independent of income, similar to findings in this study.
Strengths and Limitations
There are several limitations. Firstly, the CHD risk algorithm is not as accurate a measure of CHD as the measurement of CHD events themselves. However, given the relatively young age of the participants (38–47 years), it is too early in the life course to evaluate associations with CHD events in this study. Educational attainment may have an effect on a wide range of CHD risk factors. Consequently by utilizing a validated CHD prediction algorithm that encompasses a variety of CHD risk factors, it allows for evaluation of a number of risk factors that may be simultaneously influenced by education. A second limitation is that the mediators and outcome were measured simultaneously, as such these analyses could not rule out associations between the exposure, mediators and outcome being due to reverse causation. Furthermore, the relatively small sample size (n=346) likely resulted in more imprecise estimates and increased the chances of random error compared to what would be possible with larger sample sizes. Finally, other potential mechanisms were not explored in this study such use of preventive medical care, diet, and physical activity (Sundquist, Winkleby, & Pudaric, 2001), and could be the focus of future research.
Strengths of the study include accurate measurement of biological measures (including cholesterol, blood pressure, and BMI), using substantial internal and external quality control protocols. Furthermore, the birth cohort study design offered a unique ability to statistically account for directly assessed uncommonly measured prior common causes such as childhood intelligence, socioeconomic position, and chronic illness.
Conclusion
This study provided evidence that reading comprehension in women and men, and depressive symptoms and perceived constraint in women, may explain some of the association between education and CHD risk. Findings from this study should improve etiologic knowledge about the potential mechanisms by which education could influence CHD risk. If these mediated effects are interpreted causally, evidence-based interventions targeting reading (e.g. reading comprehension courses), depressive symptoms (e.g. counseling, medication), and perceived constraint could reduce educational inequalities in CHD. Other plausible interventions may include addressing education itself through improvements in quality and/or quantity of education. Education interventions that have been shown to impact health are lacking, although there have been some compelling randomized controlled trials on the quality of early childhood education (Campbell et al., 2014; Muennig, Schweinhart, Montie, & Neidell, 2009), and natural experiments on the quantity of grade school education (Albouy & Lequien, 2009; Lleras-Muney, 2005).
References
- Adams RJ, Piantadosi C, Ettridge K, Miller C, Wilson C, Tucker G, Hill CL. Functional health literacy mediates the relationship between socio-economic status, perceptions and lifestyle behaviors related to cancer risk in an Australian population. Patient Educ Couns. 2013;91(2):206–212. doi: 10.1016/j.pec.2012.12.001. [DOI] [PubMed] [Google Scholar]
- Albert MA, Glynn RJ, Buring J, Ridker PM. Impact of traditional and novel risk factors on the relationship between socioeconomic status and incident cardiovascular events. Circulation. 2006;114(24):2619–2626. doi: 10.1161/CIRCULATIONAHA.106.660043. [DOI] [PubMed] [Google Scholar]
- Albouy V, Lequien L. Does compulsory education lower mortality? J Health Econ. 2009;28(1):155–168. doi: 10.1016/j.jhealeco.2008.09.003. S0167-6296(08)00126-4 [pii] [DOI] [PubMed] [Google Scholar]
- Allain CC, Poon LS, Chan CS, Richmond W, Fu PC. Enzymatic determination of total serum cholesterol. Clin Chem. 1974;20(4):470–475. [PubMed] [Google Scholar]
- Baker DW, Wolf MS, Feinglass J, Thompson JA, Gazmararian JA, Huang J. Health literacy and mortality among elderly persons. Arch Intern Med. 2007;167(14):1503–1509. doi: 10.1001/archinte.167.14.1503. [DOI] [PubMed] [Google Scholar]
- Bosma H, Schrijvers C, Mackenbach JP. Socioeconomic inequalities in mortality and importance of perceived control: cohort study. BMJ. 1999;319(7223):1469–1470. doi: 10.1136/bmj.319.7223.1469. [DOI] [PMC free article] [PubMed] [Google Scholar]
- Bosma H, Van Jaarsveld CH, Tuinstra J, Sanderman R, Ranchor AV, Van Eijk JT, Kempen GI. Low control beliefs, classical coronary risk factors, and socio-economic differences in heart disease in older persons. Soc Sci Med. 2005;60(4):737–745. doi: 10.1016/j.socscimed.2004.06.018. [DOI] [PubMed] [Google Scholar]
- Campbell F, Conti G, Heckman JJ, Moon SH, Pinto R, Pungello E, Pan Y. Early childhood investments substantially boost adult health. Science. 2014;343(6178):1478–1485. doi: 10.1126/science.1248429. [DOI] [PMC free article] [PubMed] [Google Scholar]
- D’Agostino RB, Grundy S, Sullivan LM, Wilson P. Validation of the Framingham Coronary Heart Disease prediction scores - Results of a multiple ethnic groups investigation. JAMA. 2001;286(2):180–187. doi: 10.1001/jama.286.2.180. [DOI] [PubMed] [Google Scholar]
- Falkstedt D, Hemmingsson T. Educational level and coronary heart disease: a study of potential confounding from factors in childhood and adolescence based on the Swedish 1969 conscription cohort. Ann Epidemiol. 2011;21(5):336–342. doi: 10.1016/j.annepidem.2010.12.005. S1047-2797(11)00024-X [pii] [DOI] [PubMed] [Google Scholar]
- Finkelstein EA, Ruhm CJ, Kosa KM. Economic causes and consequences of obesity. Annu Rev Public Health. 2005;26:239–257. doi: 10.1146/annurev.publhealth.26.021304.144628. [DOI] [PubMed] [Google Scholar]
- Frasure-Smith N, Lesperance F. Depression and cardiac risk: present status and future directions. Heart. 2010;96(3):173–176. doi: 10.1136/hrt.2009.186957. hrt.2009.186957 [pii] [DOI] [PubMed] [Google Scholar]
- Fuchs VR. Reflections on the socio-economic. correlates of health. J Health Econ. 2004;23(4):653–661. doi: 10.1016/j.jhealeco.2004.04.004. [DOI] [PubMed] [Google Scholar]
- Fujiwara T, Kawachi I. Is education causally related to better health? A twin fixed-effect study in the USA. Int J Epidemiol. 2009;38(5):1310–1322. doi: 10.1093/ije/dyp226. dyp226 [pii] [DOI] [PubMed] [Google Scholar]
- Gilman SE, Martin LT, Abrams DB, Kawachi I, Kubzansky L, Loucks EB, Buka SL. Educational attainment and cigarette smoking: a causal association? Int J Epidemiol. 2008;37(3):615–654. doi: 10.1093/ije/dym250. [DOI] [PMC free article] [PubMed] [Google Scholar]
- Gurmankin Levy A, Micco E, Putt M, Armstrong K. Value for the future and breast cancer-preventive health behavior. Cancer Epidemiol Biomarkers Prev. 2006;15(5):955–960. doi: 10.1158/1055-9965.EPI-05-0169. 15/5/955 [pii] [DOI] [PubMed] [Google Scholar]
- Guthrie LC, Butler SC, Ward MM. Time perspective and socioeconomic status: a link to socioeconomic disparities in health? Soc Sci Med. 2009;68(12):2145–2151. doi: 10.1016/j.socscimed.2009.04.004. S0277-9536(09)00220-2 [pii] [DOI] [PMC free article] [PubMed] [Google Scholar]
- Hayes AF. Beyond Baron and Kenny: Statistical Mediation Analysis in the New Millennium. Communication Monographs. 2009;76(4):408–420. [Google Scholar]
- Jastak JF, Jastak SR. Wide Range Achievement Test: Manual of Instructions. Wilmington, DE: Guidance Associates; 1965. [Google Scholar]
- Kohout FJ, Berkman LF, Evans DA, Cornoni-Huntley J. Two shorter forms of the CES-D (Center for Epidemiological Studies Depression) depression symptoms index. J Aging Health. 1993;5(2):179–193. doi: 10.1177/089826439300500202. [DOI] [PubMed] [Google Scholar]
- Kutner M, Greenberg E, Jin Y, Paulsen C. The Health Literacy of America’s Adults: Results from the 2003 National Assessment of Adult Literacy. Washington, D.C: U.S. Department of Educaiton, National Center for Education Statistics; 2006. [Google Scholar]
- Lachman ME, Weaver SL. The sense of control as a moderator of social class differences in health and well-being. J Pers Soc Psychol. 1998;74(3):763–773. doi: 10.1037//0022-3514.74.3.763. [DOI] [PubMed] [Google Scholar]
- Lipkus IM, Samsa G, Rimer BK. General performance on a numeracy scale among highly educated samples. Med Decis Making. 2001;21(1):37–44. doi: 10.1177/0272989X0102100105. [DOI] [PubMed] [Google Scholar]
- Lleras-Muney A. The relationship between education and adult mortality in the United States. Rev Economic Studies. 2005;72:189–221. [Google Scholar]
- Lorant V, Deliege D, Eaton W, Robert A, Philippot P, Ansseau M. Socioeconomic inequalities in depression: a meta-analysis. Am J Epidemiol. 2003;157(2):98–112. doi: 10.1093/aje/kwf182. [DOI] [PubMed] [Google Scholar]
- Loucks EB, Buka SL, Rogers ML, Liu T, Kawachi I, Kubzansky LD, Gilman SE. Education and coronary heart disease risk associations may be affected by early-life common prior causes: a propensity matching analysis. Ann Epidemiol. 2012;22(4):221–232. doi: 10.1016/j.annepidem.2012.02.005. [DOI] [PMC free article] [PubMed] [Google Scholar]
- Madsen M, Andersen AM, Christensen K, Andersen PK, Osler M. Does educational status impact adult mortality in Denmark? A twin approach. Am J Epidemiol. 2010;172(2):225–234. doi: 10.1093/aje/kwq072. kwq072 [pii] [DOI] [PMC free article] [PubMed] [Google Scholar]
- Manrique-Garcia E, Sidorchuk A, Hallqvist J, Moradi T. Socioeconomic position and incidence of acute myocardial infarction: a meta-analysis. J Epidemiol Community Health. 2011;65(4):301–309. doi: 10.1136/jech.2009.104075. [DOI] [PubMed] [Google Scholar]
- Martin LT, Schonlau M, Haas A, Derose KP, Rudd R, Loucks EB, Buka SL. Literacy skills and calculated 10-year risk of coronary heart disease. J Gen Intern Med. 2011;26(1):45–50. doi: 10.1007/s11606-010-1488-5. [DOI] [PMC free article] [PubMed] [Google Scholar]
- Mattu GS, Heran BS, Wright JM. Overall accuracy of the BpTRU--an automated electronic blood pressure device. Blood Press Monit. 2004;9(1):47–52. doi: 10.1097/00126097-200402000-00009. 00126097-200402000-00009 [pii] [DOI] [PubMed] [Google Scholar]
- McLaren L. Socioeconomic status and obesity. Epidemiol Rev. 2007;29:29–48. doi: 10.1093/epirev/mxm001. [DOI] [PubMed] [Google Scholar]
- Mirowsky J, Ross CE. Life course trajectories of perceived control and their relationship to education. Am J Sociol. 2007;112(5):1339–1382. [Google Scholar]
- Muennig P, Schweinhart L, Montie J, Neidell M. Effects of a prekindergarten educational intervention on adult health: 37-year follow-up results of a randomized controlled trial. Am J Pub Health. 2009;99(8):1431–1437. doi: 10.2105/AJPH.2008.148353. [DOI] [PMC free article] [PubMed] [Google Scholar]
- Myrianthopoulos NC, French KS. An application of the U.S. Bureau of the Census socioeconomic index to a large, diversified patient population. Soc Sci Med. 1968;2(3):283–299. doi: 10.1016/0037-7856(68)90004-8. [DOI] [PubMed] [Google Scholar]
- Nemeroff CB, Goldschmidt-Clermont PJ. Heartache and heartbreak--the link between depression and cardiovascular disease. Nat Rev Cardiol. 2012;9(9):526–539. doi: 10.1038/nrcardio.2012.91. [DOI] [PubMed] [Google Scholar]
- Nicholson A, Kuper H, Hemingway H. Depression as an aetiologic and prognostic factor in coronary heart disease: a meta-analysis of 6362 events among 146 538 participants in 54 observational studies. Eur Heart J. 2006;27(23):2763–2774. doi: 10.1093/eurheartj/ehl338. [DOI] [PubMed] [Google Scholar]
- Niswander K, Gordon M. The Women and their Pregnancies: The Collaborative Perinatal Study of the National Institute of Neurological Diseases and Stroke. Washington D.C: National Institutes of Health; 1972. [Google Scholar]
- Pearlin LI, Schooler C. The structure of coping. J Health Soc Behav. 1978;19(1):2–21. [PubMed] [Google Scholar]
- Preacher KJ, Hayes AF. Asymptotic and resampling strategies for assessing and comparing indirect effects in multiple mediator models. Behav Res Methods. 2008;40(3):879–891. doi: 10.3758/brm.40.3.879. [DOI] [PubMed] [Google Scholar]
- Rifai N, Cole TG, Iannotti E, Law T, Macke M, Miller R, Wiebe DA. Assessment of interlaboratory performance in external proficiency testing programs with a direct HDL-cholesterol assay. Clin Chem. 1998;44(7):1452–1458. [PubMed] [Google Scholar]
- Strathman A, Gleicher F, Boninger DS, Edwards CS. The Consideration of Future Consequences - Weighing Immediate and Distant Outcomes of Behavior. J Personal Soc Psychol. 1994;66(4):742–752. [Google Scholar]
- Sundquist J, Winkleby MA, Pudaric S. Cardiovascular disease risk factors among older black, Mexican-American, and white women and men: an analysis of NHANES III, 1988–1994. Third National Health and Nutrition Examination Survey. J Am Geriatr Soc. 2001;49(2):109–116. doi: 10.1046/j.1532-5415.2001.49030.x. [DOI] [PubMed] [Google Scholar]
- Surtees PG, Wainwright NW, Luben R, Khaw KT, Day NE. Mastery, sense of coherence, and mortality: evidence of independent associations from the EPIC-Norfolk Prospective Cohort Study. Health Psychol. 2006;25(1):102–110. doi: 10.1037/0278-6133.25.1.102. [DOI] [PubMed] [Google Scholar]
- Thurston RC, Kubzansky LD, Kawachi I, Berkman LF. Do depression and anxiety mediate the link between educational attainment and CHD? Psychosom Med. 2006;68(1):25–32. doi: 10.1097/01.psy.0000195883.68888.68. [DOI] [PubMed] [Google Scholar]
- Valeri L, Vanderweele TJ. Mediation Analysis Allowing for Exposure-Mediator Interactions and Causal Interpretation: Theoretical Assumptions and Implementation With SAS and SPSS Macros. Psychol Methods. 2013 doi: 10.1037/a0031034. [DOI] [PMC free article] [PubMed] [Google Scholar]
- van der Pol M. Health, education and time preference. Health Econ. 2011;20(8):917–929. doi: 10.1002/hec.1655. [DOI] [PubMed] [Google Scholar]
- Wechsler D. Wechsler Intelligence Scale For Children; Manual. New York: Psychological Corp; 1949. [Google Scholar]
- Wilson PW, D’Agostino RB, Levy D, Belanger AM, Silbershatz H, Kannel WB. Prediction of coronary heart disease using risk factor categories. Circulation. 1998;97(18):1837–1847. doi: 10.1161/01.cir.97.18.1837. [DOI] [PubMed] [Google Scholar]
- Woodcock RW, McGrew KS, Mather N. Technical Manual: Woodcock- Johnson III. Itasca, IL: Riverside Publishing; 2001. [Google Scholar]