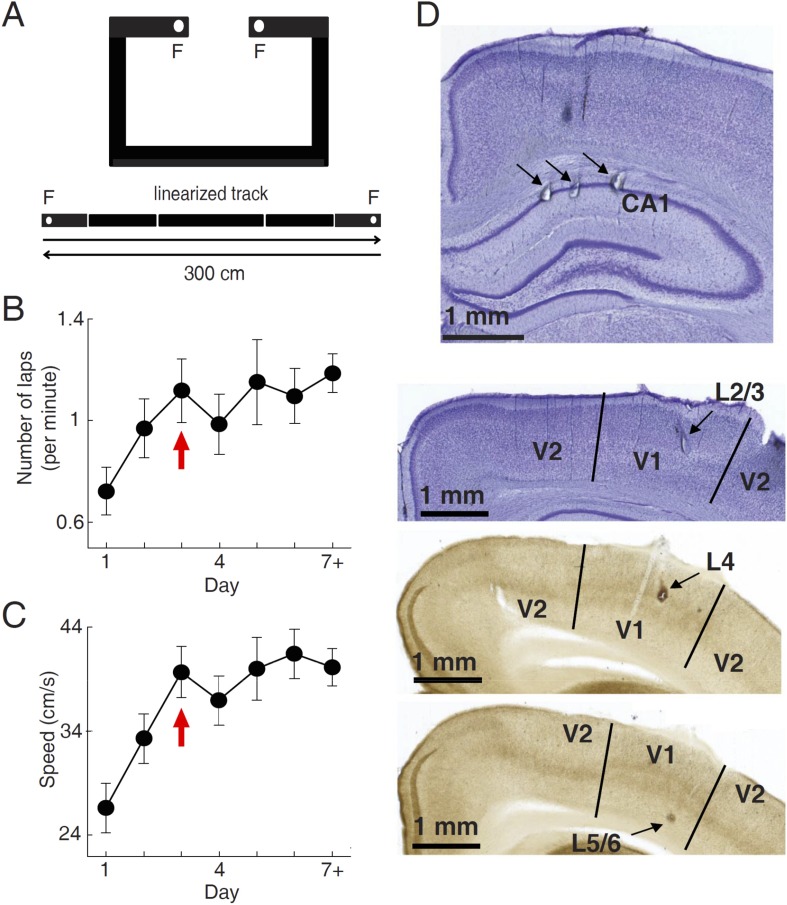
Figure 1. Behavioral task and recording sites.
(A) A C-shaped track where rats ran back and forth for food rewards. Bottom: two linearized trajectories, each 300 cm long. Vertical white lines: corners of the track. F: food wells. (B, C) The mean number of laps per minute (B) and mean running speed (C) on each day of track running, averaged over all trajectories and all animals. The number for Day 7 + included those days ≥ Day 7. Arrows: the day when the mean number of lap and speed were stabilized. Number of trajectories: N = 30, 26, 22, 22, 18, 16, 26 for Day 1 to Day 7+, respectively. (D) Nissl- (top 2 sections) and AChE-stained (bottom 2 sections) coronal brain sections to show recording sites (arrows) in the hippocampal CA1, and those in different layers of V1 (L2/3, L4 and L5/6). V2: the secondary visual cortex.

