(
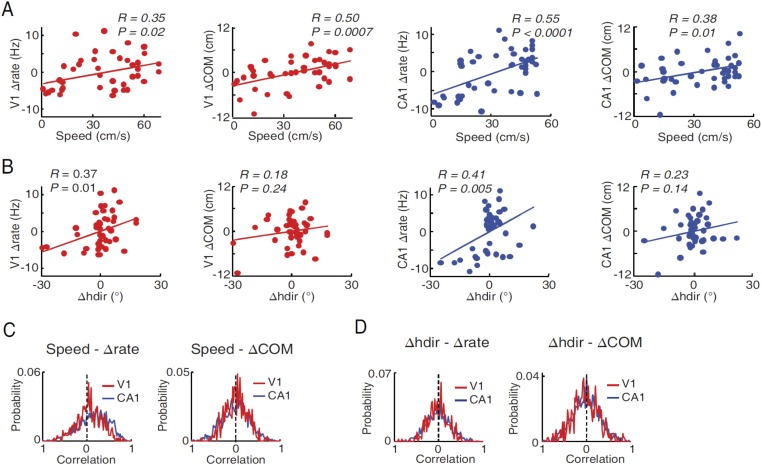
A) Correlations between lap-by-lap speed and Δrate and between lap-by-lap speed and ΔCOM for example V1 and CA1 cells (the same as in
Figure 6—figure supplement 1, panel B). Solid line: linear regression. R, P: Pearson's correlation and the associated p-value. Overall, speed was significantly correlated (p < 0.05) with Δrate in 25% (N = 107 out of 428) of V1 location-responsive cells and 41% (N = 619 out of 1510) of CA1 place cells, and with ΔCOM in 14% (N = 60) of V1 location-responsive cells and 25% (N = 378) of CA1 place cells. (
B) Same as A, but between head direction fluctuation (Δhdir) and Δrate and between Δhdir and ΔCOM for the same V1 and CA1 cells in
A. Δhdir was significantly correlated with Δrate in 12% (N = 51) of location-responsive V1 cells and in 21% (N = 317) of CA1 place cells, and with ΔCOM in 23% (N = 98) of location-responsive V1 cells and in 23% (N = 347) of CA1 place cells. (
C) Distributions of speed-Δrate and speed-ΔCOM correlation values for all CA1 place cells and location-responsive V1 cells. Dashed lines: 0 correlation. The speed-Δrate distribution was skewed to the positive side for both V1 (0.064 ± 0.014; p < 0.0001, t-test compared with 0) and CA1 cells (0.16 ± 0.009, p < 0.0001), indicating that at the population level both V1 and CA1 cells increased their firing rates as speed increased. The speed-ΔCOM distribution was slightly but significantly skewed toward a positive mean for V1 (0.029 ± 0.011, p = 0.014), but not for CA1 cells (0.010 ± 0.008, p = 0.18), suggesting that, as speed increased, V1 cells' firing locations tended to move slightly forward along the animal's movement direction. (
D) Same as (
C), but for Δhdir-Δrate and Δhdir-ΔCOM distributions. The Δhdir–Δrate distribution was centered near 0 for both V1 (−0.0052 ± 0.011, p = 0.44) and CA1 (0.0057 ± 0.0073, p = 0.64) cells, indicating no systematic relationship between firing rate and head direction at the population level, even though each individual cell could increase or decrease firing rate as head direction was changed from left to right or vice versa. This result is expected if we assume that the V1 or CA1 cells as a group should not show any preferred head direction, even through individual V1 cells are tuned to particular directions. The Δhdir - ΔCOM distribution was similarly centered near 0 for both V1 (0.009 ± 0.015, p = 0.53) and CA1 (0.003 ± 0.008, p = 0.68) (right).

