

Abstract
Longan (Dimocarpus longan Lour.) is an important tropical fruit tree crop. Accurate varietal identification is essential for germplasm management and breeding. Using longan transcriptome sequences from public databases, we developed single nucleotide polymorphism (SNP) markers; validated 60 SNPs in 50 longan germplasm accessions, including cultivated varieties and wild germplasm; and designated 25 SNP markers that unambiguously identified all tested longan varieties with high statistical rigor (P<0.0001). Multiple trees from the same clone were verified and off-type trees were identified. Diversity analysis revealed genetic relationships among analyzed accessions. Cultivated varieties differed significantly from wild populations (Fst=0.300; P<0.001), demonstrating untapped genetic diversity for germplasm conservation and utilization. Within cultivated varieties, apparent differences between varieties from China and those from Thailand and Hawaii indicated geographic patterns of genetic differentiation. These SNP markers provide a powerful tool to manage longan genetic resources and breeding, with accurate and efficient genotype identification.
Introduction
Longan (Dimocarpus longan Lour; 2n=2x=30) is a tropical perennial crop in the Sapindaceae (soapberry) family. Longan is indigenous to southern China and Southeast Asia, but is now a commonly cultivated fruit in more than 20 countries.1,2 World production of longan reached 2.35 million tons in 20092 and the top five longan producers (China, Thailand, Vietnam, India and South Africa) jointly account for 90% of global production. Among them, China has been the largest longan producer in terms of both cultivation area (470 000 ha) and total production (610 000 tons).2 Thanks to increasing popularity in non-Asian countries, longan cultivation is now expanding in tropical and subtropical countries throughout the world, including Australia, Israel and the United States.
Longan was domesticated in China more than 2000 years ago.3–5 There are several hundred longan cultivars worldwide, most of which are landraces and farmer varieties. China alone has more than 300 varieties maintained in the national longan germplasm collection.3,5 Wild longan populations still exist in Hainan, Guangdong, Guangxi and Yunnan provinces of China, as well as in northern Vietnam and Myanmar.1,4,5 Despite the large number of longan varieties in various collections, only a small number of varieties are commercially grown worldwide.1,6 Although they are sensitive to low temperatures, many traditional longan varieties have a chilling requirement for flowering and thus are not suitable for tropical regions.4,6
Like many tropical perennial tree crops, longan germplasm is maintained as living trees in field genebanks and varieties are subject to vegetative propagation during the process of germplasm exchange. But records and labels of the varieties have not always been properly maintained and accessions often arrive bearing limited information about their correct identity. The rate of mislabeling is substantial in longan germplasm collections, which restricts the sharing of information and materials among longan researchers and hampers the use of longan germplasm in breeding programs.5,7
Genotypes can be difficult to distinguish morphologically and accurate identification of longan varieties using molecular markers has been advocated to improve the efficiency of longan germplasm management and utilization.5,7,8 However, published research on molecular characterization of longan germplasm has so far been limited, and reported studies used mostly dominant markers including RAPD,9–11 AFLP,7,12,13 SCAR,14 SCTP15 and SRAP.16,17 Several studies have been done using inter-simple sequence repeat fingerprinting, which does not require specific sequence knowledge.18–20 Cross-species amplification of lychee SSR markers have been reported in longan21 as well as in other Sapindaceae species.22 In addition, a set of 384 putative SSR markers were developed and these markers are being verified.23 While Single nucleotide polymorphisms (SNP) markers have been widely used in plant germplasm management and breeding of fruit tree crops,24,25 this most powerful tool has not been available for longan.23
SNPs are the most abundant class of polymorphisms in plant genomes.26,27 Compared to SSR markers, SNP analysis can be done without requiring DNA separation by size and therefore, can be automated in high throughput assay formats. The diallelic nature of SNPs offers much lower error rate in allele calling and raises the level of consistency between laboratories.26,27 These advantages have resulted in SNPs increasingly becoming the markers of choice for accurate genotype identification and diversity analysis in perennial crops, as recently demonstrated in cacao (Theobroma cacao),28 grapevine (Vitis vinifera),29 pummelo (Citrus maxima),30 strawberry (Fragaria spp.)31 and tea (Camellia sinensis).32 Like other perennial horticulture crops, DNA fingerprinting using a small set of SNP markers is in great demand by the longan community for a broad range of research and field applications. These applications include, but are not limited to, identification of mislabeled accessions, parentage and sibship analysis for quality control in breeding and seeds programs, and characterization of farmer selections to support the production of high-value varieties for premium market.
Recently Lai and Lin33 developed a substantial amount of transcriptome data for somatic embryogenesis from longan cultivar Honghezi using cultured embryos at different developmental stages, and identified numerous unigenes expressed in embryogenic tissues. In addition, significant amount of lychee transcriptome data has been developed.34,35 The objectives of the present study were to develop SNP markers through the data mining of transcriptome data from longan and lychee and assess their potential application for longan varietal identification. The results reported herein represent the first validation study of SNPs in longan and demonstrate the utility of a transcriptome as an approach for de novo SNP identification in species lacking available genomic resources. These SNP markers, as well as the genotyping method, will be particularly useful for varietal identification, germplasm management and longan breeding programs.
Materials and methods
Mining of putative SNPs from transcriptome sequences
Transcriptome sequences of Dimocarpus longan Lour. (SRR412534) were obtained from the NCBI SRA Database (http://www.ncbi.nlm.nih.gov/sra/). We used NGSQCToolkit (v2.3, Platel RK, 2012) with stringent criteria (high-quality paired reads with 90% bases above Q20 level were retained) to remove the low-quality paired-end reads or reads containing adaptors36. The resultant 2.63×10⁹ clean and high-quality reads (90 bp in length) with a total of 4.73 Gbp nucleotides were retained for further analysis. The software Trinity was used to produce a transcript containing 50 612 sequences. To obtain more potential polymorphism, 47 594 mRNA nucleotide sequences of affinis species lychee (Litchi chinensis Sonn.) were downloaded from NCBI GenBank (3 April 2014). Redundant entries of lychee were examined and excluded using the CD-HIT program with a 95% sequence similarity threshold.37 The FASTA-formatted files of longan and lychee sequences were merged into a single dataset for further data mining. Putative EST-SNPs were detected using the QualitySNP program.38 Only clusters that included at least 4 nucleotide sequences, with a confidence score over two, were accepted. In order to meet the requirements and constraints for primer design, all candidates for SNP markers with less than 50 nucleotides between two neighboring SNPs were removed. A subset of 60 identified SNP sequences was then chosen for design and manufacture of primers to assay for SNPs in longan plant.
Validation of putative SNPs
To evaluate the putative SNP markers for suitability of varietal identification, we used a nanofluidic genotyping system and validated the SNPs for 68 samples, representing 50 cultivated and wild longan accessions (Table 1). The cultivated germplasm samples were from the USDA-ARS Tropical Crops Germplasm Repository in Hilo Hawaii, whereas the wild trees were collected from Mangshi City in Yunnan, China. Healthy young leaf samples of these accessions were harvested and dried in silica gel. DNA was extracted from dried longan leaves with the DNeasy® Plant Mini kit (Qiagen Inc., Valencia, CA, USA), which is based on the use of silica as an affinity matrix. The dry leaf tissue was placed in a 2-mL microcentrifuge tube with one ¼-inch ceramic sphere and 0.15 g garnet matrix (Lysing Matrix A; MP Biomedicals. Solon, OH, USA). The leaf samples were disrupted by high-speed shaking in a TissueLyser II (Qiagen Inc.) at 30 Hz for 1 min. Lysis solution (DNeasy® kit buffer AP1 containing 25 mg mL−1 polyvinylpolypyrrolidone), along with RNase A, was added to the powdered leaf samples and the mixture was incubated at 65 °C, as specified in the kit instructions. The remainder of the extraction method followed manufacturer’s suggestions. DNA was eluted from the silica column with two washes of 50 µL Buffer AE, which were pooled, resulting in 100 µL DNA solution. Using a NanoDrop spectrophotometer (Thermo Scientific, Wilmington, DE, USA), DNA concentration was determined by absorbance at 260 nm. DNA purity was estimated by the 260∶280 ratio and the 260∶230 ratio.
Table 1. List of longan germplasm accessions used in SNP genotyping.
| Code | Accession code | Accession name | Source of introduction | Tree stand |
|---|---|---|---|---|
| 1 | HDIM2 | Tiger Eye | Hawaii, USA | F2-WB-T1; F2-WB-T2 |
| 2 | HDIM3 | Sak Ip | Guangxi, China | FI-R8-T13 |
| 3 | HDIM4 | Fuk Yan | Guangxi, China | FI-R10-T2; FI-R10-T3; |
| 4 | HDIM5 | Tai Wu Yuen | Guangxi, China | FI-R8-T14 |
| 5 | HDIM7 | E Daew | Chiang Rai, Thailand | F2-R27-T6; FI-R10-T8 |
| 6 | HDIM8 | Haew | Chiang Rai, Thailand | F2-R27-T5; FI-R10-T9 |
| 7 | HDIM9 | Sri Chompoo | Bangkok, Thailand | F2-R27-T4; FI-R10-T10 |
| 8 | HDIM10 | N 95-4 | Malaysia | F2-R27-T3 |
| 9 | HDIM11 | Selection 7803 | Hawaii, USA | FI-R8T15; FI-R8-T3 |
| 10 | HDIM13 | N 95-8 | N/A | FI-R8-T6 |
| 11 | HDIM14 | Ponyai | Hawaii, USA | FI-R8-T1 |
| 12 | HDIM15 | Kohala | Hawaii, USA | FI-R8-T2 |
| 13 | HDIM16 | Ikeda | Hawaii, USA | FI-R8-T9 |
| 14 | HDIM17 | N 94-44 | Hawaii, USA | FI-R8-T7 |
| 15 | HDIM19 | N 95-2 | N/A | FI-R8-T10 |
| 16 | HDIM20 | Egami | Hawaii, USA | FI-R14-T6; FI-R15-T2; FI-R15-T5; FI-R16-T3; FI-R14-T1; FI-R16-T4; FI-R8-T5 |
| 17 | HDIM21 | Chu Leon | Guangxi, China | FI-R8-T12 |
| 18 | HDIM22 | Chaer Jum | Guangxi, China | FI-R10-T1 |
| 19 | HDIM23 | Biew Kiew | Hawaii, USA | FI-R14-T2; FI-R15-T4; FI-R15-T3; FI-R16-T1; FI-R14-T5; FI-R16-T6 |
| 20 | HDIM26 | Biew Kiew | Hawaii, USA | FI-R10-T5; FI-R10-T7 |
| 21 | HDIM24 | E Wai | Hawaii, USA | FI-R14-T3; FI-R14-T4 |
| 22 | HDIM25 | Diamond River | Hawaii, USA | FI-R10-T4 |
| 23 | N/A | Sri Chompoo | Bangkok, Thailand | F2-WB |
| 24 | N/A | NO2 13 Shorter | N/A | FI-R2-11 |
| 25 | N/A | NO2 13 Taller | N/A | F1-R1-T9 |
| 26-50 | N/A | N/A | Mangshi, Yunnan, China | Yunnan-01, Yunnan-03, Yunnan-07, Yunnan-09, Yunnan-10, Yunnan-11, Yunnan-16, Yunnan-18, Yunnan-19, Yunnan-20, Yunnan-22, Yunnan-23, Yunnan-24, Yunnan-25 Yunnan-29, Yunnan-30, Yunnan-32, Yunnan-34, Y unnan-36, Yunnan-40, Yunnan-41, Yunnan-42, Yunnan-43, Yunnan-47, Yunnan-48 |
Sixty putative SNP sequences were submitted to the Assay Design Group at Fluidigm Corporation (South San Francisco, CA, USA) for design and manufacture of primers for a SNPtypeTM genotyping panel. The assays were based on competitive allele-specific PCR and enable bi-allelic scoring of SNPs at specific loci (KBioscience Ltd, Hoddesdon, UK). The Fluidigm SNPtypeTM Genotyping Reagent Kit was used according to the manufacturer’s instructions.35,36 Using these primers, the isolated DNAs were subjected to Specific Target Amplification36 in order to enrich the SNP sequences of interest. Genotyping was performed on a nanofluidic 96.96 Dynamic ArrayTM IFC (Integrated Fluidic Circuit; Fluidigm Corp.). This chip automatically assembles PCR reactions, enabling simultaneous testing of up to 96 samples with 96 SNP markers. The use of a 96.96 Dynamic Array IFC for SNP genotyping of human samples was described by Wang et al.39 End-point fluorescent images of the 96.96 IFC were acquired on an EP1TM imager (Fluidigm Corp.). The data were analyzed with Fluidigm Genotyping Analysis Software.40
Data analysis
Key descriptive statistics for measuring the informativeness of the SNP markers were calculated, including minor allele frequency, observed heterozygosity, expected heterozygosity, Shannon’s information index and inbreeding coefficient. The program GenAlEx 6.541,42 was used for computation. For genotype identification, pairwise multilocus matching was applied among individual samples using the same program. DNA samples that were fully matched at the genotyped SNP loci were declared the same genotype (or clones). Statistical rigor was assessed for match declaration using the probability of identity (PID) that two individuals may share the same multilocus genotype by chance.39 In computing PID, it was assumed that all individual genotypes were siblings (PID-sib), which was defined as the probability that two sibling individuals drawn at random from a population have the same multilocus genotype.43,44 The overall PID-sib is the upper limit of the possible ranges of PID in a population, and thus, provides the most conservative number of loci required to resolve all individuals, including relatives.43 The computation was carried out using the program GenAlEx 6.5.41,42
Distance-based multivariate analysis was used to assess the relationship among the individual varieties, as well as their relationship with the wild germplasm. Pairwise genetic distances as defined by Peakall et al.45 were computed using the DISTANCE procedure implemented in GenAlEx 6.5. The same program was then used to perform Principal Coordinates Analysis (PCoA), based on the pairwise distance matrix. Both distance and covariance were standardized.
A model-based clustering algorithm implemented in the STRUCTURE software program46 was applied to the SNP data. This algorithm attempted to identify genetically distinct subpopulations based on allele frequencies. The admixture model was applied and the number of clusters (K-value), indicating the number of subpopulations the program attempted to find, was set from 1 to 10. The analyses were carried out without assuming any prior information about the genetic group or geographic origin of the samples. Ten independent runs were assessed for each fixed number of clusters (K), each consisting of 1×10⁶ iterations after a burn-in of 2×10⁶ iterations. The ΔK value was used to detect the most probable number of clusters and the computation was performed using the online program STRUCTURE HARVESTER.47,48 Of the 10 independent runs, the one with the highest Ln Pr (X|K) value (log probability or log likelihood) was chosen and represented as bar plots.
To analyze the genetic diversity in the wild and cultivated longan germplasm groups, the intrapopulation genetic diversity was measured by gene diversity (Hs),49 observed heterozygosity (Ho) and FIS50 using GenAlex 6.5.41,42 The difference between wild and cultivated longan germplasm was measured using Fst, as implemented in the same program. In addition, analysis of molecular variance (AMOVA) was used to compare the size of molecular variance in wild and cultivated longan germplasm.
Results
SNP discovery
A total of 80 186 mRNA nucleotide sequences from longan and lychee were gathered as previously described. CAP3 program was used to assembly sequences into 10 001 contigs and 55 961 singlets with an average size of 2.42 sequences per contig under default parameter, among which putative SNPs were detected in only 141 contigs using the QualitySNP program. All of these selected clusters included a minimum of six EST sequences. In total, we obtained 1560 putative SNPs, including 70 C/T, 84A/G, 24 A/T, 21 A/C, 21 T/G, 20 C/G, 1320 Indel and 2 high tri-allelic polymorphisms. To select high quality SNPs for validation, candidate SNP sites with at least 50 bp before and after the site were filtered. We calculated the number of all sequences in a cluster and the number containing the SNP type in this cluster. We then selected 60 SNPs for validation by genotyping a test panel of longan varieties, including both cultivated varieties and wild populations. Among the 60 SNPs, 33 were from longan, 17 were from lychee and the remaining 10 SNPs were found in both longan and lychee.
Frequency of SNP markers and descriptive statistics
Out of the chosen 60 SNP markers, 52 were successful in genotyping. The failure of the remaining eight SNPs was likely due to the sequence complexity or the presence of polymorphisms within the flanking sequences. However, among the successful SNPs, 27 were monomorphic across the 68 longan samples (i.e. only one SNP variant was identified in all individuals). These monomorphic markers may have resulted from errors in transcriptome sequencing, which then led to incorrect identification of SNP. It is also possible that some of these SNPs may correspond to rare alleles that were not present in the analyzed longan varieties.
A total of 25 polymorphic SNPs were retained for further analysis. These 25 SNPs were reliably scored across the validation panel and thus, were considered true SNPs. Out of the 25 polymorphic SNPs, 22 were longan SNPs and 3 were SNPs shared by both longan and lychee. In contrast, the lychee SNPs were either non-amplified or failed in generating polymorphism in the test panel. The flanking sequences and SNPs of the 25 selections are listed in Table 2. The minor allele frequencies of these SNPs ranged from 0.061 to 0.458 with an average of 0.307. The mean information index was 0.584, ranging from 0.230 to 0.690. The observed heterozygosity ranged from 0.100 to 0.875 with an average of 0.406, whereas the mean expected heterozygosity was 0.400 ranging from 0.115 to 0.497 (Table 3).
Table 2. The flanking sequences and SNPs of the 25 polymorphic markers.
| No. | SNP ID | Species | Flanking sequences and SNPs |
|---|---|---|---|
| 1 | Dl 475 | Longan | ATAATGGTCTTCGCAAGGGAGTTATATTATTCCTATCAATATGTGCATC[C/G]TTTGAGTTCCTATGTTTTCTGCTGTATGCATTTTTCTTCCCTAAACTGCCA |
| 2 | Dl 477 | Longan | GGGGAGGGAAACTGGAAGGCTGTGGTAATTGGCATTTCTGTTGCTGTTA[C/T]TGTGGTAGGATTATGTCTCATAATTTTGATCTTGGGTATCCTCTACTGGAG |
| 3 | Dl 479 | Longan | CTGTCCACCACATGTACTACATGTAGATGGTTTTGTCCCTGGTTTTGCA[C/G]CTGAACCATTGCAAGTCCCACAGCTTTCAAGACGTGTTATCTCAATCTCTT |
| 4 | Dl 480 | Longan | TACTTCCTGAATTAGAAACAGGACTACATGATGTGGAAGAGTGGAAAAC[T/C]AGTTGCAATTCACTTTAACATGCTGGCTATTAAATTTCAAAATTTGGTGAG |
| 5 | Dl 483 | Longan | TGACTTTCATTGTTACACTTCGCTAATTGTCTCCAATGACAGTGACAAA[T/G]AGATCACCAGGGAATCCCTGTGGAAATTAGAGAATTATTATCATTTAGTAT |
| 6 | Dl 486 | Longan | CAGTGACAAAGAGATCACCAGGGAATCCCTGTGGAAATTAGAGAATTAT[G/T]ATCATTTAGTATTGTTTTTGTCCAACTTCTTAATCCTACTGTCAACTGCAT |
| 7 | Dl 488 | Longan | TTAACATGCTGGCTATTAAATTTCAAAATTTGGTGAGTAGTATGATGTG[T/G]GATTCTAAAATTGATGAAATCTTTTATTGAAAAGGTGGCTTTAGGGTAACA |
| 8 | Dl 489 | Longan | TATCAAAACACAGCCCGTGCTGTGGAGAAGCTTACAATGGACGAGCTGC[C/T]AGCCTCTATGCTGGCGCTCCTTGCTATGAAGACTTTCGATGAGCAATGCAA |
| 9 | Dl 494 | Longan | TTTAAGCTGTATATATGAATTAAAAAAATAAGAGCAATTTCCGCAGGTT[T/G]TTACATTTGCCAACCATACCAAGAAATTTTATGTTTAAAAAGTAAAGAAAG |
| 10 | Dl 496 | Longan | CCCACATCGTGTTCAACAATCTAGGTTGCCTTGTGTTTGTGGTGGTACA[G/A]ATGGGTGGTCTCCATCTCCATTTTTGTTGGATTTTTGTGGTTGTAGGGTGT |
| 11 | Dl 499 | Longan | TTAACATGCTGGCTATTAAATTTCAAAATTTGGTGAGTAGTATGATGTG[G/T]GATTCTAAAATTGATGAAATCTTTTATTGAAAAGGTGGCTTTAGGGTAACA |
| 12 | Dl 503 | Longan | AAAAAAATAAGAGCAATTTCCGCAGGTTGTTACATTTGCCAACCATACC[C/A]AGAAATTTTATGTTTAAAAAGTAAAGAAAGAAAATAACAAGAAGCATGTTT |
| 13 | Dl 504 | Longan | GCAACCAGTCTCTCCTGAGATGGTTATCTTTTACATAACTCAGGACACT[T/C]AGAGACATCCATTACTTCCTGAATTAGAAACAGGACTACATGATGTGGAAG |
| 14 | Dl 505 | Longan | TCAGCGTTTGCTTGATGTAACTGAGGCTGTTGTTACGAATTCTGAACCG[G/C]AGAAGAGTTCCCCAGTTAAAGCCTCCAAGAAAGTGGAGCGCAACTATTCAG |
| 15 | Dl 507 | Longan | CCAGTGTGAAGTGATTCAGCGTTTGCTTGATGTAACTGAGGCTGTTGTT[A/G]CGAATTCTGAACCGGAGAAGAGTTCCCCAGTTAAAGCCTCCAAGAAAGTGG |
| 16 | Dl 508 | Longan | CTTTTGTGGTATTGTCCACTGTGTGTAACAAGTTCGGTTAGTCGGATTT[C/T]GAATATGTAAATGAAGAATTAATACAGGAGGTGCTTGTATATAAATTGATA |
| 17 | Dl 509 | Longan | AATGTGGTCTTTAAGTGGAGAAGATTTTTACTTCATGTGCATGGAGATA[T/C]TCTACAGAGGTGGAACCAGAAACGAGCAAGTAAGTGCGCCTGGTATTCTTC |
| 18 | Dl 511 | Longan | AGGGAAATCATCTTGTAAGTGATGGAGAATTTTAGGCTTGGAATGATGC[G/A]TGCGAAGCAACATATCGACAGTATTGGGCATTGGTTATTGGCTCTCCCAAG |
| 19 | Dl 515 | Longan | AGGTTGTTACATTTGCCAACCATACCAAGAAATTTTATGTTTAAAAAGT[T/A]AAGAAAGAAAATAACAAGAAGCATGTTTTTTCCTTCATTGGCGACCAGTTT |
| 20 | Dl 517 | Longan | CTGATAAAGCTGGTCTCCCTAAGCAACCAGTCTCTCCTGAGATGGTTAT[T/C]TTTTACATAACTCAGGACACTTAGAGACATCCATTACTTCCTGAATTAGAA |
| 21 | Dl 518 | Longan | AGGGGTTACAGTGACCTCCATTTCGTTACCTTGAGTATGCTGCTGACCA[C/G]TTGGTGGTTGCTCTGCATTCCCCATTAAATTCCATTTCTGCCCGCCCTGAT |
| 22 | Dl 520 | Longan | TACTTCCTGAATTAGAAACAGGACTACATGATGTGGAAGAGTGGAAAAC[C/T]AGTTGCAATTCACTTTAACATGCTGGCTATTAAATTTCAAAATTTGGTGAG |
| 23 | Dl 544 | Longan & Lychee | GCAACCAGTCTCTCCTGAGATGGTTATCTTTTACATAACTCAGGACACT[C/T]AGAGACATCCATTACTTCCTGAATTAGAAACAGGACTACATGATGTGGAAG |
| 24 | Dl 554 | Longan & Lychee | CCTACATCGCCGGGTTGCTGACCGGCAGGCCGAATTCGAAGGCTACTGG[A/G]CCTAATGGAGAGACCCTTGATGCTAAAGAAGCCAGTCGAAGGGCTGGTTTT |
| 25 | Dl 556 | Longan & Lychee | TGCAGCCTAAAGAAGGGCTTGCTCTAGTGAATGGGACAGCTGTGGGTTC[T/C]GGCTTGGCTTCTATGGTTCTTTTCGAGGCCAACATTCTTGCTGTGTTATCT |
Table 3. Minor allele frequency, information index, heterozygosity and inbreeding coefficient of the 25 SNP loci scored on 50 longan accessions.
| SNP ID | Minor allele frequency | Information index | Observed heterozygosity | Expected heterozygosity | Inbreeding coefficient |
|---|---|---|---|---|---|
| Dl 475 | 0.396 | 0.671 | 0.375 | 0.478 | 0.216 |
| Dl 477 | 0.410 | 0.677 | 0.100 | 0.484 | 0.793 |
| Dl 479 | 0.357 | 0.652 | 0.714 | 0.459 | −0.556 |
| Dl 480 | 0.344 | 0.644 | 0.200 | 0.452 | 0.557 |
| Dl 483 | 0.420 | 0.680 | 0.840 | 0.487 | −0.724 |
| Dl 486 | 0.290 | 0.602 | 0.340 | 0.412 | 0.174 |
| Dl 488 | 0.418 | 0.680 | 0.388 | 0.487 | 0.203 |
| Dl 489 | 0.194 | 0.492 | 0.102 | 0.313 | 0.674 |
| Dl 494 | 0.216 | 0.522 | 0.250 | 0.339 | 0.262 |
| Dl 496 | 0.458 | 0.690 | 0.875 | 0.497 | −0.762 |
| Dl 499 | 0.220 | 0.527 | 0.400 | 0.343 | −0.166 |
| Dl 503 | 0.061 | 0.230 | 0.122 | 0.115 | −0.065 |
| Dl 504 | 0.220 | 0.527 | 0.400 | 0.343 | −0.166 |
| Dl 505 | 0.438 | 0.685 | 0.875 | 0.492 | −0.778 |
| Dl 507 | 0.380 | 0.664 | 0.240 | 0.471 | 0.491 |
| Dl 508 | 0.420 | 0.680 | 0.680 | 0.487 | −0.396 |
| Dl 509 | 0.316 | 0.624 | 0.633 | 0.433 | −0.463 |
| Dl 511 | 0.410 | 0.677 | 0.260 | 0.484 | 0.463 |
| Dl 515 | 0.330 | 0.634 | 0.620 | 0.442 | −0.402 |
| Dl 517 | 0.120 | 0.367 | 0.240 | 0.211 | −0.136 |
| Dl 518 | 0.250 | 0.562 | 0.500 | 0.375 | −0.333 |
| Dl 520 | 0.280 | 0.593 | 0.560 | 0.403 | −0.389 |
| Dl 544 | 0.120 | 0.367 | 0.240 | 0.211 | −0.136 |
| Dl 554 | 0.410 | 0.677 | 0.100 | 0.484 | 0.793 |
| Dl 556 | 0.190 | 0.486 | 0.100 | 0.308 | 0.675 |
| Mean | 0.307 | 0.584 | 0.406 | 0.400 | −0.007 |
Cultivar identification
SNP profiles of the multiple trees from the same longan cultivar showed that genotyping results were highly consistent (Table 4). ‘Clonality’ for multiple trees within each cultivar was confirmed in varieties ‘Tiger Eye’ (HDIM 2), ‘Fuk Yan’ (HDIM 4), ‘E Daew’ (HDIM 7), ‘Haew’ (HDIM 8), ‘Sri Chompoo’ (HDIM 9), ‘Selection 7803’ (HDIM 11), ‘Egami’ (HDIM 20), ‘Biew Kiew’ (HDIM 23) and ‘Biew Kiew’ (HDIM 26). The multilocus matching also detected an off-type in the cultivar ‘E Wai’ (HDIM 24), where two different genotypes were found in this cultivar. The probability that two longan varieties will have the same genotype at the 25 SNP loci is approximately 1 in 100 000 for the tested longan varieties, as computed by the mutlilocus matching procedure implemented in GenAlex 6.5.41,42
Table 4. Examples of DNA fingerprints based on the full array of 25 SNPs for longan tree genotype identification.
| a. Examples of confirmed identical genotype for multiple trees in same cultivar | ||||||||||||||||||||||||||
|---|---|---|---|---|---|---|---|---|---|---|---|---|---|---|---|---|---|---|---|---|---|---|---|---|---|---|
| Cultivar | Tree code | 475 | 477 | 479 | 480 | 483 | 486 | 488 | 489 | 494 | 496 | 499 | 503 | 504 | 505 | 507 | 508 | 509 | 511 | 515 | 517 | 518 | 520 | 544 | 554 | 556 |
| Tiger Eye | F2-WB-T1 | C G | T T | C C | C T | G G | G T | G T | C T | T T | G A | T T | A A | C T | C C | G G | C C | C C | G A | A A | C T | C C | C T | C T | A A | T T |
| Tiger Eye | F2-WB-T2 | C G | T T | C C | C T | G G | G T | G T | C T | T T | G A | T T | A A | C T | C C | G G | C C | C C | G A | A A | C T | C C | C T | C T | A A | T T |
| Fuk Yan | FI-R10-T2 | C G | T T | C C | C T | G T | T T | G G | C T | G T | G G | G T | A C | T T | G G | A G | C C | C T | A A | A T | C T | C G | C T | T T | A A | T T |
| Fuk Yan | FI-R10-T3 | C G | T T | C C | C T | G T | T T | G G | C T | G T | G G | G T | A C | T T | G G | A G | C C | C T | A A | A T | C T | C G | C T | T T | A A | T T |
| Egami | FI-R8-T5 | C G | C T | C C | C C | G T | T T | G T | C T | G T | G G | T T | A C | C C | C G | A G | C C | C T | A A | A T | C T | C C | C C | C C | A A | T T |
| Egami | FI-R14-T1 | C G | C T | C C | C C | G T | T T | G T | C T | G T | G G | T T | A C | C C | C G | A G | C C | C T | A A | A T | C T | C C | C C | C C | A A | T T |
| Egami | FI-R14-T6 | C G | C T | C C | C C | G T | T T | G T | C T | G T | G G | T T | A C | C C | C G | A G | C C | C T | A A | A T | C T | C C | C C | C C | A A | T T |
| Egami | FI-R15-T2 | C G | C T | C C | C C | G T | T T | G T | C T | G T | G G | T T | A C | C C | C G | A G | C C | C T | A A | A T | C T | C C | C C | C C | A A | T T |
| Egami | FI-R15-T5 | C G | C T | C C | C C | G T | T T | G T | C T | G T | 0 0 | T T | A C | C C | C G | A G | C C | C T | A A | A T | C T | C C | C C | C C | A A | T T |
| Egami | FI-R16-T3 | C G | C T | C C | C C | G T | T T | 0 0 | C T | G T | G G | T T | A C | C C | C G | A G | C C | C T | A A | A T | C T | C C | C C | C C | A A | T T |
| Egami | FI-R16-T4 | C G | C T | C C | C C | G T | T T | G T | C T | G T | G G | T T | A C | C C | C G | A G | C C | C T | A A | A T | C T | C C | C C | C C | A A | T T |
| b. Example of homonymous mislabeling (off-type—trees with same cultivar name but different SNP genotypes) | ||||||||||||||||||||||||||
|---|---|---|---|---|---|---|---|---|---|---|---|---|---|---|---|---|---|---|---|---|---|---|---|---|---|---|
| Cultivar | Tree code | 475 | 477 | 479 | 480 | 483 | 486 | 488 | 489 | 494 | 496 | 499 | 503 | 504 | 505 | 507 | 508 | 509 | 511 | 515 | 517 | 518 | 520 | 544 | 554 | 556 |
| E Wai | FI-R14-T3 | C C | C T | C C | C C | G T | T T | 0 0 | C C | T T | A A | T T | A C | C T | C G | A G | C C | C C | A A | A T | T T | C C | C C | T T | A A | T T |
| E Wai | FI-R14-T4 | C G | T T | C C | C C | G T | T T | G T | C C | G T | G G | T T | A C | C C | C G | A G | C C | C T | A A | A T | C T | C C | C C | C C | A A | T T |
Genetic diversity in cultivated and wild longan germplasm
After excluding the duplicated samples, the genetic relationships among the 50 longan germplasm accessions (25 wild accessions and 25 cultivated genotypes) are presented in the principal coordinates analysis plot (Figure 1). Each of the accessions has a unique SNP profile. The 50 accessions fall into two clearly different clusters without overlapping. The first cluster includes all the cultivated germplasm and the second one includes all wild germplasm from Yunnan, China. Within the cultivated germplasm, there is significant difference in two subclusters according to the PCoA. The first subcluster was comprised mainly of the varieties from Southern China, including ‘Chu Leon’, ‘Tai Wu Yuen’, ‘Sak Ip’, ‘Fuk Yan’, as well as the Hawaii cultivar ‘Ikeda’ (HDIM 16). The second subcluster included all Thai varieties, as well as the other varieties from Hawaii. The only exception is the Chinese cultivar ‘Chaer Jum’ (HDIM 22), which falls into the Thailand/Hawaii subcluster.
Figure 1.

PCoA plot of 50 longan accessions including 25 cultivated varieties from USDA longan collection in Hilo, Hawaii and 24 wild trees collected from Mangshi, Yunnan Province, China. The plane of the first three main PCO axes accounted for 61.0% of total variation. First axis=41.1% of total information, the second=11.9% and the third=8.0%.
Population stratification of the 50 varieties, based on ΔK value computed by STRUCTURE HARVESTER,48 revealed two clusters as the most probable number of K (Figures 2 and 3) and this partitioning was fully compatible with the principle coordinate analysis (Figure 1). All the wild germplasm were assigned to one Bayesian cluster, whereas the cultivated germplasm were grouped in another single Bayesian cluster. The only exception is accession ‘No 2-13 (taller)’, which appeared as a hybrid genotype between the cultivated and wild longan groups. To further illuminate the diversity within the cultivated germplasm, the clustering result at K=3 is also presented in Figure 3. The wild germplasm remained as a single cluster at K=3, but the cultivated longan were split into two subclusters, revealing the difference between the Chinese and Thailand/Hawaii accessions. In addition, several hybrid-like accessions that combined both Chinese and Thailand parentage were observed at K=3. These include ‘Ponyai’, ‘Diamond River’ and the aforementioned ‘No 2–13 taller’, which showed significant contribution from Yunnan wild germplasm (Figures 3 and 4).
Figure 2.

Plot of ΔK (filled circles, solid line) calculated as the mean of the second-order rate of change in likelihood of K divided by the standard deviation of the likelihood of K, m|L ″(K)|/s[L(K)].
Figure 3.

Inferred clusters in the longan varieties using STRUCTURE, where K is the potential number of genetic clusters that may exist in the overall analyzed longan accessions. Each vertical line represents one individual multilocus genotype. Individuals with multiple colors have admixed genotypes from multiple clusters. Each color represents the most likely ancestry of the cluster from which the genotype or partial genotype was derived. Clusters of individuals are represented by colors.
Figure 4.
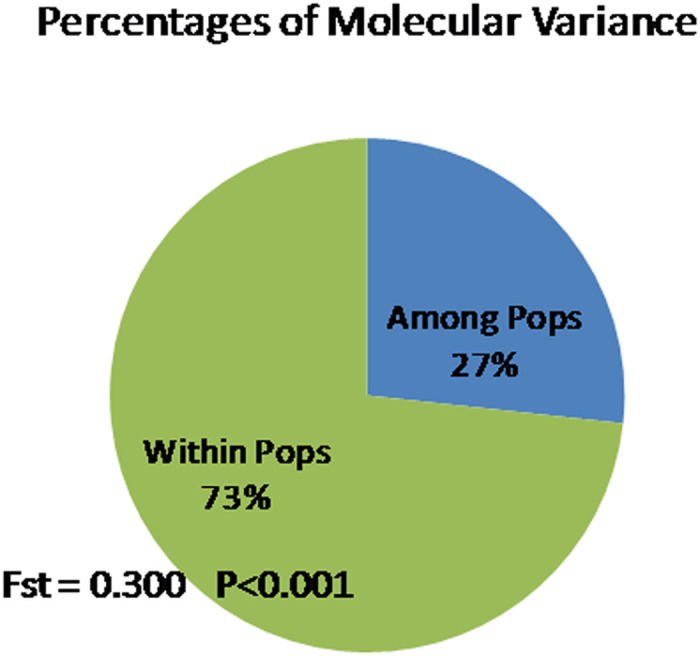
Partition of total molecular variance between the cultivated and the wild germplasm groups using AMOVA. Number of permutations=9999.
The key descriptive statistics for the SNP loci are presented in Table 3, and the level of genetic diversity in cultivated and wild longan germplasm is presented in Table 5 and in Figure 4. Between the cultivated and the wild germplasm groups, gene diversity (expected heterozygosity), observed heterozygosity and inbreeding coefficient were all comparable. However, significant population differentiation was found by the contingency table test of Weir and Cockerham51 (Fst=0.300, P<0.001). AMOVA showed that both the within-collection and the between-collection variations were highly significant (P<0.001). Twenty-seven percent of the total molecular variance was due to difference between the two germplasm groups, whereas 73% was partitioned within collections. The estimated molecular variance was 191.6 in the wild population and 235.7 in the cultivated germplasm groups (Table 5).
Table 5. Comparison of genetic diversity (gene diversity, observed heterozygosity and molecular variance) in cultivated and wild longan germplasm.
| Gene diversity | Observed heterozygosity | Molecular variance | |
|---|---|---|---|
| Cultivated varieties (n=25) | 0.361 | 0.396 | 235.7 |
| Wild population (n=25) | 0.288 | 0.416 | 191.6 |
Discussion
Genomic research in longan has been scarce and advanced molecular tools to support germplasm management are not available. Developing SNP markers from transcriptome sequences has been considered an efficient strategy for nonmodel species.52,53 In the present study, we identified 60 SNP markers based on the transcriptome sequences of embryos at various development stages to validate using a diverse panel of cultivated and wild germplasm. In spite of the fact that the transcriptome sequences were derived from the embryos of a single cultivar (Honghezi),33 we were able to obtain a moderate rate of success for marker validation, which indicates that a high percentage of success would be achieved if the transcriptome sequences were based on multiple genotypes. This approach for SNP marker development, therefore, can serve as a fast alternative for species lacking abundant genomic resources. As shown in the present study, even a small set of SNP markers can significantly improve the accuracy and efficiency in germplasm management.
Longan genotype identification
Unambiguous identification of genotypes is a concern for longan germplasm management, breeding and propagation of planting materials.7,8 In the present study, it has been demonstrated that a set of only 25 SNP markers was effective for the assessment of genetic identity of longan germplasm. Results from multiple trees of the same cultivar showed 100% concordance, demonstrating that the nanofluidic system is a reliable platform for generating longan DNA fingerprints with high accuracy. However, because a major fraction of the germplasm maintained in the USDA longan collection was directly or indirectly introduced from China, Thailand and other Asia countries, the reference standards need to be established based on the ‘original living trees’ of these accessions in China and Thailand. For example, there were two genotypes labeled as ‘E Wai’ (FI-R14-T3 and FI-R14-T4), but determination of the authentic result could not be made without knowing the genotype of the original reference tree. Therefore, assessment of genetic identity in this study was limited to duplicate identification.
Genetic diversity in wild and cultivated longan
The level of genetic diversity in the wild population is lower than in the cultivated germplasm group, as reflected by gene diversity and molecular variance. This result could be explained by the fact that the wild germplasm came from a single population collected from a single location in Yunnan, China. In contrast, the cultivated germplasm comprised varieties originally from Thailand, China and possibly other Asian countries. Nonetheless, the PCoA and the Bayesian clustering analysis both clearly separated the analyzed longan accessions into wild and cultivated clusters. This difference was further quantified by AMOVA, where a significant genetic difference (Fst=0.300; P<0.001) was found. The large difference indicates that, in spite of the available wild germplasm in southwest China, little has been integrated in the longan cultigens so far. The present result thus supports the notion that there remains a large amount of untapped genetic diversity in the primary gene pool of longan, including southwest China.4,5,54,55 It also supports the observation of Lin et al.7 who reported relatively low levels of genetic variation in the Chinese varieties of longan and hypothesized that the Chinese longan varieties might have suffered a bottleneck during domestication. Wild longan populations have been reported in several regions in southern China, including Guangxi,56 Hainan57 and Yunnan.58 Wild longan fruits differed from cultivated ones morphologically, including small fruit size, warty fruit skin, thin pulp and large seed.5 These wild longan germplasm potentially harbor new genes/alleles for agronomic traits, such as resistance/tolerance to biotic and abiotic stresses. Introgression of the wild germplasm would effectively broaden the genetic background of the cultivated longan. Moreover, given the severe genetic erosion in southwest China due to the rapidly diminishing forests, it is urgent to develop ex situ and in situ conservation plans to ensure proper maintenance of the wild populations.
Within the 25 cultivated germplasm, PCoA and Bayesian approach (K=3) both separated the Chinese germplasm from Thai and Hawaiian varieties, which illustrated the geographic differentiation between Chinese and Thailand longan germplasm. The majority of the Hawaii varieties showed closer approximation with the Thai varieties, indicating parentage or ancestry of Thai germplasm. This result is compatible with Lin et al.7 which showed the Thai cultivar ‘Miaoqiao’ was different from the 40 Chinese varieties. The same result was reported by Zhong et al.,59 who analyzed 95 longan accessions from China and Thailand. Their result showed that the 95 germplasm accessions could be divided into two groups (i.e., longan from China and longan from Thailand). The difference is also compatible with the assessment of Crane et al.6 where they suggested that the higher chilling requirement of traditional Chinese varieties limited longan production in tropical regions, whereas the varieties from Thailand do not have this problem. Nonetheless, Bayesian clustering analysis (K=3), also revealed two hybrid type varieties (‘Pongyan’ and ‘Diamond River’), which appeared to be admixed progenies derived from both Thai and Chinese longan parental varieties. In addition, cultivar ‘Chaer Jum’ and ‘No 2–13 taller’ were found to have significant contribution from the wild germplasm. However, so far we have insufficient information about the cultivated longan germplasm from Yunnan to assess the parentage of these cultivated longan germplasm. This information gap will be filled with ongoing research on molecular characterization of longan germplasm in China and Southeast Asia.
In conclusion, we conducted a pilot study on the development of SNP markers for longan and employed them for varietal genotyping, using a nanofluidic array. This technology enabled us to generate high quality SNP profiles for the purpose of longan varietal identification and genebank management. Our result also revealed significant genetic difference in wild and cultivated longan germplasm. To our knowledge, this is the first study to apply SNP markers in longan. New efforts to develop more SNP markers are underway, in order to make a comprehensive assessment of genetic diversity in longan and map quantitative traits loci for important agronomic traits in this crop. This information will be useful for verification of longan varieties and thus, has a significant potential for practical application.
Acknowledgments
We would like to give special thanks to Carol R. Mayo-Riley for sampling the cultivated longan germplasm and the Dehong Forestry Research Institute, Yunnan Forestry Bureau for collecting the leaf samples from the wild trees. We also thank Stephen Pinney for assisting in the SNP genotyping. This work was partially supported by the National Natural Science Foundation of China (31100248). References to a company and/or product by the USDA are only for the purposes of information and do not imply approval or recommendation of the product to the exclusion of others that may also be suitable.
The authors declare no conflict of interest.
References
- Menzel CM, Waite GK. Litchi and Longan: Botany, Production and Uses. Trowbridge: Cromwell Press, 2005. [Google Scholar]
- Food and Agriculture Organization. Tropical fruits compendium. Committee on commodity problems, Intergovernmental group on bananas and tropical fruits. Fifth Session; 3–5 May 2011; Yaoundé, Cameroon. Available at http://www.fao.org/docrep/meeting/022/am481t.pdf (accessed 20 September 2014).
- Liu XH, Ma CL. Production and research of longan in China. Acta Hort., 558 2001: 73–82.
- Choo WK. Longan Production in Asia. RAP Publication: 2000/20. Bangkok: FAO, 2000. Available at http://www.fao.org/docrep/003/X6908E/x6908e00.htm.
- Wu YL, Yi GJ, Zhou BR et al. The advancement of research on litchi and longan germplasm resources in China. Sci Hort 2007; 114: 143–150. [Google Scholar]
- Crane JH, Balerdi CF, Sargent SA et al. Longan growing in the Florida Home Landscape. Fact Sheet HS-49 2005. Gainesville, FL: Horticultural Sciences Department, Florida Cooperative Extension Service, Institute of Food and Agricultural Sciences, University of Florida, 2005. [Google Scholar]
- Lin T, Lin Y, Ishiki K. Genetic diversity of Dimocarpus longan in China revealed by AFLP markers and partial rbcL gene sequences. Sci Hort 2005; 103: 489–498. [Google Scholar]
- Lai ZX, Chen CL, Chen ZG. Progress in biotechnology research in longan. Acta Hort, 2001; 58: 137–141.
- Sitthiphrom S, Anuntalabhochai S, Dum-Ampai N et al. Investigation of genetic relationships and hybrid detection in longan by high annealing temperature RAPD. Acta Hort 2005; 665: 161–170. [Google Scholar]
- Yonemoto Y, ChowdhuryA K, Kato H et al. Cultivars identification and their genetic relationships in Dimocarpus longan subspecies based on RAPD markers. Sci Hort 2006; 109: 147–152. [Google Scholar]
- Mei ZQ, Fu SY, Yu HQ et al. Genetic characterization and authentication of Dimocarpus longan Lour. using an improved RAPD technique. Genet Mol Res 2014; 13: 1447–1455. [DOI] [PubMed] [Google Scholar]
- Yi GJ, Tan WP, Huo HQ et al. Studies on the genetic diversity and relationship of longan cultivars by AFLP analysis. Acta Hort Sin 2003; 30: 272–276. Chinese. [Google Scholar]
- Peng HX, Li DB, Zhu JH et al. Genetic diversity of longan in Guangxi assessed by AFLP markers. Acta Hort Sin 2008; 35: 1511–1516. Chinese. [Google Scholar]
- Yang L, Fu S, Khan MA et al. Molecular cloning and development of RAPD-SCAR markers for Dimocarpus longan variety authentication. Springerplus 2013; 2: 501. [DOI] [PMC free article] [PubMed] [Google Scholar]
- Chen H, He XH, Luo C et al. Analysis on the genetic diversity of 24 longan (Dimocarpus longan) accessions by SCoT markers. Acta Hort Sin 2010; 37: 1651–1654. Chinese. [Google Scholar]
- Guo YS, Liu CJ, Zhao YH et al. Construction of a molecular genetic linkage map for longan based on RAPD, ISSR, SRAP and AFLP markers. Acta Hort 2010; 863: 141–148. [Google Scholar]
- Zhou J, Fu JX, Wu ZX et al. Genetic diversity in litchi and longan germplasm as determined by SRAP markers. Acta Hort 2011; 918: 799–805. [Google Scholar]
- Zeng LH, Hong ZT, Lin WZ et al. ISSR analysis of germplasm in longan. J Fujian Agric Forestry Univ 2009; 38: 238–242. Chinese. [Google Scholar]
- Chiang KK, Wen IC, Lee WY et al. Genetic diversity analysis using ISSR marker on longan (Dimocarpus longan Lour.) germplasm. J Taiwan Agric Res 2010; 59: 185–196. [Google Scholar]
- Dina MB, Sugiyatno A, Supriyanto A. Genetic diversity of local accessions of Dimocarpus longan revealed by ISSR markers. Bulet Plasma Nutfah 2011; 17: 25–28. [Google Scholar]
- Fu JX, Wang Y, Zhou J et al. Genetic diversity of germplasm resources of Litchi and Longan using SSR analysis, In Proc. XXVIIIth IHC–IIIrd IS on Plant Genetic Resources Ed.: K.E. Hummer. Acta Hort 2011; 918: 363–370. [Google Scholar]
- Ekué MRM, Gailing O, Finkeldey R. Transferability of simple sequence repeat (SSR) markers developed in Litchi chinensis to Blighia sapida (Sapindaceae). Plant Mol Biol Rep 2009; 27: 570–574. [DOI] [PMC free article] [PubMed] [Google Scholar]
- Arias RS, Borrone JW, Tondo CL et al. Genomics of tropical fruit tree crops. In: Schnell R J, Priyadarshan P M (ed.) Genomics of Tree Crops. New York: Springer Science, 2012: 209–239. [Google Scholar]
- Awais Khan M, Korban SS. Association mapping in forest trees and fruit crops. J Exp Bot 2012; 63: 4045–4060. [DOI] [PubMed] [Google Scholar]
- van Nocker S, Gardiner SE. Breeding better cultivars, faster: applications of new technologies for the rapid deployment of superior horticultural tree crops. Hort Res 2014; 1: 1. [DOI] [PMC free article] [PubMed] [Google Scholar]
- Buckler ES, Thornsberry J. Plant molecular diversity and applications to genomics. Curr Opin Plant Biol 2002; 5: 107–111. [DOI] [PubMed] [Google Scholar]
- Rafalski A. Applications of single nucleotide polymorphisms in crop genetics. Curr Opin Plant Biol 2002; 5: 94–100. [DOI] [PubMed] [Google Scholar]
- Fang WP, Meinhardt LW, Mischke S et al. Accurate determination of genetic identity for a single cacao bean, using molecular markers with a nanofluidic system, ensures cocoa authentication. J Agric Food Chem 2014; 62: 481–487. [DOI] [PubMed] [Google Scholar]
- Cabezas JA, Ibanez J, Lijavetzky D et al. A 48 SNP set for grapevine cultivar identification. BMC Plant Biol 2011; 11: 153. [DOI] [PMC free article] [PubMed] [Google Scholar]
- Wu B, Zhong GY, Yue JQ et al. Identification of pummelo cultivars by using a panel of 25 selected SNPs and 12 DNA segments. PLoS ONE 2014; 9: e94506. [DOI] [PMC free article] [PubMed] [Google Scholar]
- Longhi S, Giongo L, Buti M et al. Molecular genetics and genomics of the Rosoideae: state of the art and future perspectives. Hort Res 2014; 1: 1. [DOI] [PMC free article] [PubMed] [Google Scholar]
- Fang W, Meinhardt LW, Tan H et al. Varietal identification of tea (Camellia sinensis) using nanofluidic array of single nucleotide polymorphism (SNP) markers. Hort Res 2014; 1: 14035. [DOI] [PMC free article] [PubMed] [Google Scholar]
- Lai ZX, Lin YL. Analysis of the global transcriptome of longan (Dimocarpus longan Lour.) embryogenic callus using Illumina paired-end sequencing. BMC Genomics 2013; 14: 561. [DOI] [PMC free article] [PubMed] [Google Scholar]
- Li C, Wang Y, Huang X et al. De novo assembly and characterization of fruit transcriptome in Litchi chinensis Sonn. and analysis of differentially regulated genes in fruit in response to shading. BMC Genomics 2013; 14: 552. [DOI] [PMC free article] [PubMed] [Google Scholar]
- Zhang HN, Yong Z, Wei YZ et al. Transcriptomic analysis of floral initiation in litchi (Litchi chinensis Sonn.) based on de novo RNA sequencing. Plant Cell Rep 2004; 33: 1723–1735. [DOI] [PubMed] [Google Scholar]
- Platel RK, Jain M. NGS QC Toolkit: a toolkit for quality control of next generation sequencing data. PLoS ONE 2012; 7: e30619. [DOI] [PMC free article] [PubMed] [Google Scholar]
- Li WZ, Godzik A. Cd-hit: a fast program for clustering and comparing large sets of protein or nucleotide sequences. Bioinformatics 2006; 22: 1658–1659. [DOI] [PubMed] [Google Scholar]
- Tang JF, Vosman B, Voorrips RE et al. QualitySNP: a pipeline for detecting single nucleotide polymorphisms and insertions/deletions in EST data from diploid and polyploid species. BMC Bioinformatics 2006; 7: 438–453. [DOI] [PMC free article] [PubMed] [Google Scholar]
- Wang J, Lin M, Crenshaw A et al. High-throughput single nucleotide polymorphism genotyping using nanofluidic Dynamic Arrays. BMC Genomics 2009; 10: 561. [DOI] [PMC free article] [PubMed] [Google Scholar]
- Fluidigm. Fluidigm SNP Genotyping User Guide Rev H1, PN 68000098. South San Francisco, CA: Fluidigm Corporation, 2011. [Google Scholar]
- Peakall R, Smouse PE. Genalex 6: genetic analysis in Excel. Population genetic software for teaching and research. Mol Ecol Notes 2006; 6: 288–295. [DOI] [PMC free article] [PubMed] [Google Scholar]
- Peakall R. Smouse PE. GenAlEx 6.5: genetic analysis in Excel. Population genetic software for teaching and research—an update. Bioinformatics 2012; 8: 2537–2539. [DOI] [PMC free article] [PubMed] [Google Scholar]
- Waits LP, Luikart G, Taberlet P. Estimating the probability of identity among genotypes in natural populations: cautions and guidelines. Mol Ecol 2001; 10: 249–256. [DOI] [PubMed] [Google Scholar]
- Evett IW, Weir BS. Interpreting DNA Evidence: Statistical Genetics for Forensic Scientists. Sunderland, MA: Sinauer, 1998. [Google Scholar]
- Peakall R, Smouse PE, Huff DR. Evolutionary implications of allozyme and RAPD Variation in diploid populations of dioecious buffalograss Buchloe dactyloides. Mol Ecol 1995; 4: 135–147. [Google Scholar]
- Pritchard JK, Stephens M, Donnelly P. Inference of population structure using multilocus genotype data. Genetics 2000; 155: 945–959. [DOI] [PMC free article] [PubMed] [Google Scholar]
- Evanno G, Regnaut S, Goudet J et al. Detecting the number of clusters of individuals using the software STRUCTURE: a simulation study. Mol Ecol 2005; 14: 2611–2620. [DOI] [PubMed] [Google Scholar]
- Earl DA, vonHoldt BM. STRUCTURE HARVESTER: a website and program for visualizing STRUCTURE output and implementing the Evanno method. Conserv Genet Resources 2012; 4: 359–361. [Google Scholar]
- Nei M. Molecular Evolutionary Genetics. New York: Columbia University Press, 1987: 512. [Google Scholar]
- Wright S. The interpretation of population structure by F-statistics with special regard to systems of mating. Evolution 1965; 19: 395–420. [Google Scholar]
- Weir BS, Cockerham CC. Estimating F-statistics for the analysis of population structure. Evolution 1984; 38: 1358–1370. [DOI] [PubMed] [Google Scholar]
- Mutz KO, Heilkenbrinker A, Lonne M et al. Transcriptome analysis using next-generation sequencing. Curr Opin Biotechnol 2013; 24: 22–30. [DOI] [PubMed] [Google Scholar]
- Strickler SR, Bombarely A, Mueller LA. Designing a transcriptome next-generation sequencing project for a nonmodel plant species. Am J Bot 2012; 99: 257–266. [DOI] [PubMed] [Google Scholar]
- Pan LM, Zhu JH, Peng HX et al. [Research advances in relatives of longan in China.] Guangxi Agric Sci 2008; 06. Chinese.
- Zhuang YM, Ke GW, Zeng WX et al. Longan. In: Liang YG (ed.) Fruits in Tropical and South Subtropical China. Beijing: China Agriculture Press, 1998: 97–107. [Google Scholar]
- Qian GZ, Hu YQ. [Wild mountain longan in Guangxi.] J Guangxi Agric Sci 1996; 1: 32. Chinese. [Google Scholar]
- Xue RH. [The group of wild longan found in Hainan Island.] China Fruits 1981; 1: 21–23. Chinese. [Google Scholar]
- Li YQ. [An investigation on wild longan (Dimocarpus longana Lour.) in Yunnan.] Acta Hort Sin 1985; 12: 223–227. Chinese. [Google Scholar]
- Zhong FL, Pan DM, Guo ZX et al. RAPD analysis of longan germplasm resources. Chin Agric Sci Bull 2007; 23: 558–563. [Google Scholar]