

Abstract
After the sequencing of citrus genomes, gene function annotation is becoming a new challenge. Gene coexpression analysis can be employed for function annotation using publicly available microarray data sets. In this study, 230 sweet orange (Citrus sinensis) microarrays were used to construct seven coexpression networks, including one condition-independent and six condition-dependent (Citrus canker, Huanglongbing, leaves, flavedo, albedo, and flesh) networks. In total, these networks contain 37 633 edges among 6256 nodes (genes), which accounts for 52.11% measurable genes of the citrus microarray. Then, these networks were partitioned into functional modules using the Markov Cluster Algorithm. Significantly enriched Gene Ontology biological process terms and KEGG pathway terms were detected for 343 and 60 modules, respectively. Finally, independent verification of these networks was performed using another expression data of 371 genes. This study provides new targets for further functional analyses in citrus.
Introduction
Gene coexpression network analysis is an attractive method for gene function annotation, which has been used in many model organisms, including yeast, mouse, human, Arabidopsis, and grapevine1–5. In the gene coexpression network, nodes represent genes and edges represent significant correlations between the expression patterns of connected genes6. After network construction, highly connected genes are clustered into modules. Genes within one module tend to participate in similar biological processes. Therefore, the function of unannotated genes could be hypothesized based on “guilt-by-association” principle7.
After the sequencing of citrus genomes8, gene function annotation is becoming a new challenge. For citrus, large amounts of data from microarray and RNA-seq experiments are available in public databases9–13. These data make it possible to construct gene coexpression networks for citrus. Several papers on citrus gene coexpression networks have been published14–17. Most of these studies focused on specific areas and used small data sets. Only one study used 297 citrus microarrays, and covered the general area and several specific areas17. However, a limitation of this study was that probe sets were used to construct gene coexpression networks, not the genes, which were used in many coexpression studies18–20. There are also some protein–protein interaction (PPI) networks, but these networks were inferred based on PPI networks of Arabidopsis21–23.
In this study, we first made a customized Chip Definition File (CDF) by AffyProbeMiner to transfer probes to gene locus. Then, seven gene coexpression networks were constructed by RMTGeneNet using all or part of 230 citrus microarrays. These networks were partitioned into modules, and the functional coherence of modules was assessed by Gene Ontology (GO) and KEGG pathway enrichment analyses. Finally, RNA-seq data of 371 genes were used to test the validity of these networks.
Materials and methods
Data collection and preprocessing
The sweet orange (Citrus sinensis) microarray data used in this study were downloaded from National Center for Biotechnology Information (NCBI) Gene Expression Omnibus (GEO)24. A total of 231 CEL files were obtained from the platform GPL5731. The raw CEL data were preprocessed with RMA normalization using affy package of R 3.1.025. One sample (GSM825502) that failed more than one test of arrayQualityMetrics26 was removed and a total of 230 samples remained for network construction (Table S1). Based on hierarchical cluster analysis, these 230 microarrays (called “all data”) were classified into “citrus canker” (30 arrays) and “HLB” (36 arrays), or “leaves” (63 arrays), “flavedo” (40 arrays), “albedo” (31 arrays), and “flesh” (43 arrays). These sub-data sets were also used for networks construction. To map the microarray probes to citrus genes, a customized CDF was generated by AffyProbeMiner27 using C. x clementina v1.0 annotation as the reference8. Probes mapping to multiple citrus loci and probe sets containing less than five members were discarded. Data about the NICCE networks were downloaded from http://citrus.adelaide.edu.au/nicce/home.aspx.
Coexpression network construction and topological analysis
The coexpression networks were constructed using the RMTGeneNet package28. A minimum of 25 input microarrays is required for this application. First, a gene expression correlation matrix was constructed using pair-wise Pearson correlation coefficients (PCC). Then, a threshold was determined according to the transition of nearest neighbor spacing distribution from the Gaussian distribution to Poisson distribution (p = 0.001). Coexpression networks were visualized using the Cytoscape 2.8.329, and all topological analyses were performed using the NetworkAnalyzer package30 for Cytoscape 2.8.3.
Module clustering and functional enrichment analysis
The Markov Cluster (MCL) Algorithm31, an efficient graph clustering algorithm based on the simulation of random walk, was used to partition the network into modules. The inflation parameter (I) was scanned from 1.2 to 5.0 with increments of 0.2. Area fraction, mass fraction, and efficiency were used to determine the inflation parameter for MCL. The GO terms and Arabidopsis homologs for C. x clementina genes were downloaded from Phytozome v1032. The KEGG annotations of Arabidopsis genes were obtained through KEGGREST of Bioconductor33. GO biological process term enrichment analysis was carried out using topGO package of Bioconductor33. KEGG pathway enrichment was performed in R 3.1.0. Terms enriched with a Fisher’s test p-value <0.05 were considered.
Genome synteny analysis and network validation
To use the RNA-seq data of the C. sinensis annotation project (CAP)34, synteny analysis between C. sinensis genome and C. x clementina genome was conducted locally using the similar method developed for the Plant Genome Duplication Database35,36. First, BLASTP37 was conducted using all C. sinensis proteins to search for potential anchors (E < 1e−10, top 5 matches) in the C. x clementina genome. Afterwards, MCscan was employed to identify homologous regions38. Finally, syntenic blocks were evaluated by ColinearScan39. Alignments with an E value < 1e−10 were considered as significant matches. The expression data of 371 C. sinensis genes were downloaded from CAP and the correlation coefficients between them were calculated using R 3.1.0.
Results
Network construction
As shown in Figure 1, 231 Affymetrix citrus microarrays were downloaded from the NCBI GEO. After quality check, 230 high-quality microarrays (Table S1) were chosen for downstream analyses. Based on the hierarchical cluster analysis (Figure S1), these microarrays were first distributed into seven organ groups: flower, stem, leaves, fruit, seed, roots, and epicotyls. In the fruit group, they were further divided into flavedo, albedo, flesh, and vascular core (also called central core) subgroup. The data from albedo and vascular core were first clustered together and then clustered with data from other parts of fruit. This is reasonable considering that albedo and vascular core are composed of a colorless, spongy network of parenchymatous cells. These data sets were combined into one group, and labeled “albedo”, because neither was large enough for RMTGeneNet analysis. Five groups (flower, stem, seed, roots, and epicotyls), which had fewer microarrays than the minimum requirement of RMTGeneNet (Table 1), were not included for condition-dependent coexpression analysis. Within groups, microarrays of the same treatment were clustered together. Two major diseases of citrus40, citrus canker and HLB, constituted 38.3% of the experiments (citrus canker: 30, HLB: 58), or 81.5% of the experiments if controls were not included. Other treatments were not included for network construction because of insufficient numbers of microarrays. For citrus canker, all microarrays are included in the leaves group. However, HLB data covered five groups (stem, leaves, fruit, seed, and roots). Only 36 microarrays in the fruit group were used for constructing “HLB” coexpression network. Therefore, these 230 microarrays (called “all data”) were divided into sub-data sets of “citrus canker”, “HLB”, “leaves”, “flavedo”, “albedo”, and “flesh” based on their experimental conditions or organ types. Data from these seven groups were analyzed individually to construct coexpression networks.
Figure 1.
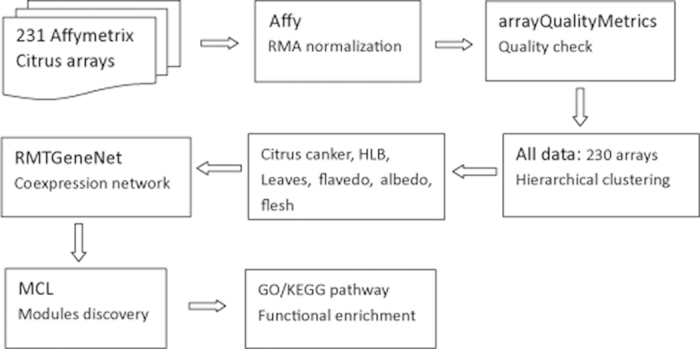
Work flow used for networks construction and clustering in the present study.
Table 1. Composition of the 230 microarrays according to the experiment conditions and organs.
| Epicotyls | Root | Stem | Leaves | Flower | Peel | Flavedo | Albedo | Vascular core | Flesh | Seed | Total | |
|---|---|---|---|---|---|---|---|---|---|---|---|---|
| Citrus canker | 0 | 0 | 0 | 30 | 0 | 0 | 0 | 0 | 0 | 0 | 0 | 30 |
| Huanglongbing | 0 | 3 | 3 | 12 | 0 | 0 | 12 | 0 | 12 | 12 | 4 | 58 |
| Other treatments | 12 | 0 | 0 | 2 | 0 | 0 | 6 | 0 | 0 | 0 | 0 | 20 |
| Control | 0 | 3 | 3 | 19 | 9 | 12 | 22 | 12 | 7 | 31 | 4 | 122 |
| Total | 12 | 6 | 6 | 63 | 9 | 12 | 40 | 12 | 19 | 43 | 8 | 230 |
The Affymetrix citrus microarray contains 30 217 probe sets and 341 730 probes. In order to map the probes to citrus gene loci, a customized CDF was generated by AffyProbeMiner27 using C. x clementina v1.0 annotation as the reference8. After removing ambiguous probes mapping to multiple gene loci and probe sets with less than 5 probes, 158 557 probes belonging to 12 005 gene loci were kept in the customized CDF. Therefore, the expression of 48.9% citrus genes (12 005/24 533) can be tested accurately using the Affymetrix citrus microarray. According to the study of NICCE network, 47.6% (14 020/29 445) C. sinensis genes can be tested by this citrus microarray17. Similar results were also found in maize that only 56.5% genes could be detected by maize microarrays41.
The coexpression networks were constructed using the RMTGeneNet28, which first calculated pair-wise Pearson Correlation Coefficients (PCC) for all genes and then identified a threshold for cutting PCC values using Random Matrix Theory. The PCC thresholds for these coexpression networks are shown in Table 2, ranging from 0.882 for “all data” to 0.968 for “HLB”. At these relatively stringent thresholds, only the top 0.24% to 1.06% of all possible edges was retained. The nodes of these networks range from 1137 to 2263, accounting for 9.47%–18.85% measurable genes of the citrus microarray.
Table 2. Topological characteristics of seven coexpression networks.
| Arrays | RT | Nodes | Edges | AD | ND | NCC | NBC | EBC | APL | DE | CC | |
|---|---|---|---|---|---|---|---|---|---|---|---|---|
| All data | 230 | 0.882 | 1391 | 10 220 | 14.69 | 0.011 | 104 | 1046 | 9878 | 7.62 | 1.13 | 0.40 |
| HLB | 36 | 0.968 | 1400 | 5036 | 7.19 | 0.005 | 91 | 1040 | 4379 | 6.76 | 1.58 | 0.29 |
| Citrus canker | 30 | 0.938 | 1841 | 5565 | 6.05 | 0.003 | 211 | 1265 | 5174 | 8.79 | 1.50 | 0.23 |
| Leaves | 63 | 0.911 | 2263 | 11 535 | 10.19 | 0.005 | 158 | 1862 | 11 247 | 10.75 | 1.47 | 0.33 |
| Flavedo | 40 | 0.964 | 1425 | 2467 | 3.46 | 0.002 | 123 | 1133 | 2289 | 9.63 | 2.10 | 0.20 |
| Albedo | 31 | 0.947 | 1592 | 3725 | 4.68 | 0.003 | 162 | 996 | 2644 | 6.66 | 1.80 | 0.20 |
| Flesh | 43 | 0.948 | 1137 | 2431 | 4.28 | 0.004 | 90 | 911 | 2290 | 7.59 | 1.86 | 0.20 |
| Total | 6256 | 37 633 |
RT, RMT threshold; AD, average degree; ND, network density; NCC, number of connected components; NBC, nodes of biggest components; EBC, edges of biggest components; APL, average path length; DE, degree exponent; CC, clustering coefficient.
Network topology
Figure 2 displays the coexpression network of “all data” using Cytoscape 2.8.329. Although these networks have different numbers of nodes and edges, they have similar topological characteristics (Table 2). All these networks are composed of a major component and other small components. All nodes within one component are directly or indirectly connected. Nodes in the major components account for 62.56% to 82.28% of that in corresponding networks. The average path length of these networks ranges from 6.66 to 10.75, implying the small-world properties. The nodes degree of these networks fits to a power law distribution with the degree exponent (r) ranging from 1.13 to 2.10, indicating that these networks are scale free. These networks demonstrate modular and hierarchical characteristics with the average clustering coefficient ranging from 0.20 to 0.40, which is more than 36 times higher than that of same size random networks (data not shown). Table S2 provides a list of all edges in these networks. Taken together, these seven networks contain 37 633 edges among 6256 nodes (genes, Table S3), which account for 52.11% measurable genes of the microarray or 25.50% total genes in C. x clementina v1.0 genome. Table 3 shows the intersections between nodes and edges of these networks. Generally, the intersections among them are relatively low. In total, 3304 nodes (52.81%) and 34 860 edges (92.63%) were found only in one network. The intersection among “leaves”, “all data”, and “citrus canker” network is relatively higher than that between other networks.
Figure 2.
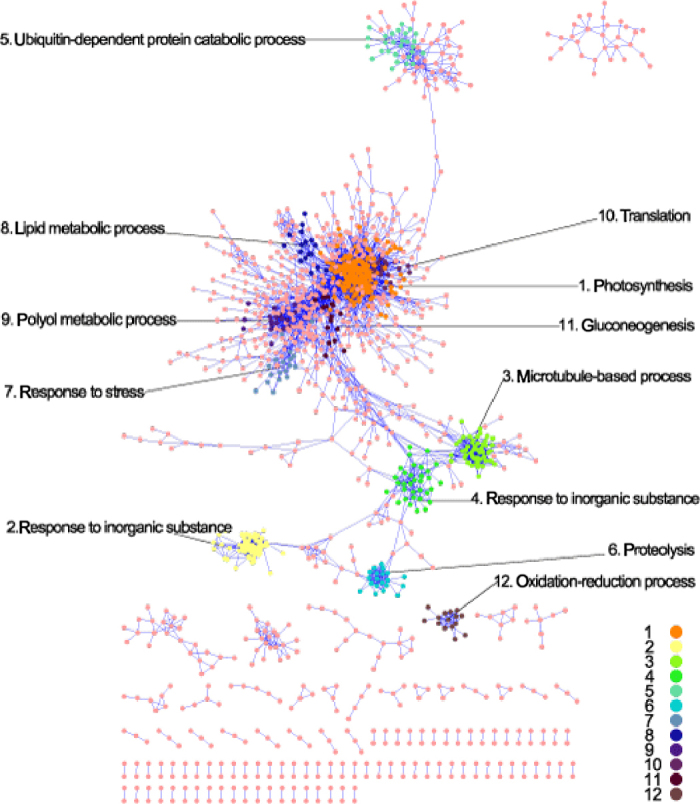
Layout of the citrus “all data” coexpression network. The most overrepresented GO terms were shown for the 12 largest color-coded modules.
Table 3. Intersection between edges/nodes (upper/lower triangular) of networks.
| All data | HLB | Citrus canker | Leaves | Flavedo | Albedo | Flesh | |
|---|---|---|---|---|---|---|---|
| All data | 206 (1.35%) | 574 (3.64%) | 1305 (6%) | 158 (1.25%) | 45 (0.32%) | 28 (0.22%) | |
| HLB | 334 (11.97%) | 26 (0.25%) | 29 (0.18%) | 14 (0.19%) | 28 (0.32%) | 15 (0.2%) | |
| Citrus canker | 482 (14.91%) | 308 (9.5%) | 1271 (7.43%) | 15 (0.19%) | 10 (0.11%) | 3 (0.04%) | |
| Leaves | 665 (18.2%) | 274 (7.48%) | 925 (22.54%) | 59 (0.42%) | 21 (0.14%) | 9 (0.06%) | |
| Flavedo | 278 (9.87%) | 257 (9.1%) | 276 (8.45%) | 361 (9.79%) | 70 (1.13%) | 32 (0.65%) | |
| Albedo | 262 (8.78%) | 267 (8.92%) | 269 (7.84%) | 317 (8.22%) | 565 (18.73%) | 40 (0.65%) | |
| Flesh | 144 (5.7%) | 238 (9.38%) | 178 (5.98%) | 217 (6.38%) | 410 (16%) | 382 (14%) |
Network clustering and functional enrichment
MCL algorithm was used to identify sets of nodes (i.e. coexpression module) that are more densely connected with each other than with the remaining nodes of the network4. The inflation parameter (I), the most important parameter of MCL, was chosen according to area fraction, mass fraction, and efficiency. In the present study, more than 80% of the entire edge masses could be captured only using less than 3% of the network area (Table 4). A total of 2338 modules were detected in these seven networks (Table S4), with 525 of them containing five or more nodes. The size of biggest modules in these networks ranges from 47 to 200. Functional enrichment analyses of these 525 modules were performed using terms from the GO biological process and KEGG pathway (Tables S5 and S6). Only terms enriched within a module with a Fisher’s p-value of 0.05 or less were considered. Only 343 modules in these networks had some degree of GO enrichment. Some GO terms were commonly enriched in these networks, such as gene expression (GO: 0010467), translation (GO: 0006412), and photosynthesis (GO: 0015979). However, the gene numbers associated with these common GO terms varied among networks. For example, 33 and 28 genes were associated with photosynthesis (GO: 0015979) in the “all data” and “leaves” network, respectively. However, zero and five genes were related to photosynthesis in the “albedo” and “flesh” network, respectively. A total of 132 GO terms (28.5%) were enriched exclusively in one network, such as polysaccharide catabolic process (GO: 0000272) and trehalose metabolic process (GO: 0005991) in “citrus canker” network.
Table 4. Network clustering and functional enrichment of modules.
| Inflation | Efficiency | Mass fraction (%) | Area fraction (%) | Modules | M5 | SBM | GO | KEGG | |
| All data | 2 | 0.52 | 83.63 | 2.85 | 285 | 55 | 200 | 39 | 7 |
| HLB | 1.8 | 0.45 | 80.93 | 1.38 | 267 | 72 | 90 | 47 | 9 |
| Citrus canker | 1.8 | 0.56 | 85.90 | 0.81 | 447 | 88 | 103 | 58 | 9 |
| Leaves | 1.8 | 0.46 | 82.00 | 1.40 | 432 | 87 | 144 | 57 | 17 |
| Flavedo | 1.6 | 0.48 | 86.92 | 0.75 | 287 | 86 | 47 | 58 | 12 |
| Albedo | 1.8 | 0.54 | 83.03 | 0.84 | 402 | 73 | 102 | 37 | 3 |
| Flesh | 1.6 | 0.44 | 84.90 | 1.67 | 218 | 64 | 108 | 47 | 3 |
| Total | 2338 | 525 | 343 | 60 |
M5, number of modules containing more than five nodes; SBM, size of biggest module; GO, KEGG: number of modules with significantly enriched GO biological process terms, KEGG pathways.
Because a small portion of all nodes (25.15%, 1574/6256) was annotated with KEGG orthology identifiers in the C. x clementina annotation file, their homologs in Arabidopsis were used for KEGG enrichment. A total of 60 modules were detected with significantly enriched KEGG pathways, and 36 KEGG pathways were enriched in at least one module. Some pathways were commonly enriched in these networks, such as Ribosome (ath03010), and photosynthesis (ath00195). A clear correspondence was observed between GO and KEGG enrichment analyses.
Predominant function of selected modules
Four modules were presented below to illustrate the correspondence of these modules with defined biological functions and methods that can be used to explore functional modules from these gene coexpression networks.
(1) Citrus lateral organ boundaries 1 in “citrus canker“ network
The guide-gene approach is commonly used to explore functional modules from gene coexpression networks. A lateral organ boundaries 1 (CsLOB1) gene has recently been identified as a citrus canker disease susceptibility gene in sweet orange42. The precise function of CsLOB1 is still not clear. Using its homolog in C. x clementina (Ciclev10033956m) as a guide, 25 coexpressed genes were identified in module 1 of the “citrus canker” network (Figure 3). Six of them were involved in cell wall metabolism: Ciclev10005888m (plant pectin methylesterase inhibitor superfamily protein), Ciclev10016123m (xyloglucan endotransglucosylase/hydrolase 5), Ciclev10021623m (expansin B2), Ciclev10007670m (proline-rich extensin-like receptor kinase), Ciclev10014994m (glycosyl hydrolase), and Ciclev10019941m (pectin lyase-like superfamily protein). Similar results were reported in the NICCE networks17. Interestingly, three minichromosome maintenance family genes (Ciclev10007588m, Ciclev10027769m, and Ciclev10019324m) were coexpressed with Ciclev10033956m, implying the functions of LOB1 in DNA replication. Another candidate target of TAL effectors, CsSWEET1 (Ciclev10002276m)42, was also included in module 1 of the “citrus canker” network. It encodes a sugar transporter for pathogen nutrition and is linked to Ciclev10033956m through three nodes (the shortest path).
Figure 3.

Graph showing coexpressed genes of the C. clementina homolog of citrus LOB1 (Ciclev10033956m) and SWEET1 (Ciclev10002276m) in canker-module 1.
(2) Module 25 in “citrus canker network” (canker-module 25): plant hormone signal transduction
Canker-module 25 was selected based on functional enrichment analyses. It has 10 nodes, 14 edges and a density of 0.311 (Figure 4). The highest ranked (lowest p value) GO term of this module was response to oxidative stress (GO: 0006979, p = 0.05). The highest ranked KEGG pathway of this module was plant hormone signal transduction (ath04075, p = 0.00024). Increased ethylene production was reported in citrus leaves inoculated with Xanthomonas campestris pv. citri (Hasse) Dye (Xc), a strain of bacteria that causes citrus canker43. However, the ethylene signal transduction pathway is not clear in citrus. Three nodes in this module, Ciclev10019132m (ERS1, ethylene response sensor 1), Ciclev10021170m (MAP kinase kinase) and Ciclev10005820m (ERF1, ethylene response factor 1), may be involved in the ethylene signal transduction. The hub gene of this module is Ciclev10019132m (ERS1). In Arabidopsis, ethylene signal is first perceived by endoplasmic reticulum localized receptor (including ERS1) and then transduced to ERF and downstream targets through MAPK cascades44,45. A jasmonic acid-amido synthetase gene (Ciclev10019459m) and a protein phosphatase 2C gene (Ciclev10004981m) were also included in this module, implying the cross-talk among ethylene, JA and ABA signaling pathways. Other genes may also be involved in plant hormone signal transduction, such as Ciclev10024032m (cysteine-rich receptor-like protein kinase) and Ciclev10001726m (peroxidase gene). Therefore, canker-module 25 is likely to carry on the functions of plant hormone signal transduction. Unannotated genes in this module would be hypothesized to be related to plant hormone signal transduction.
Figure 4.
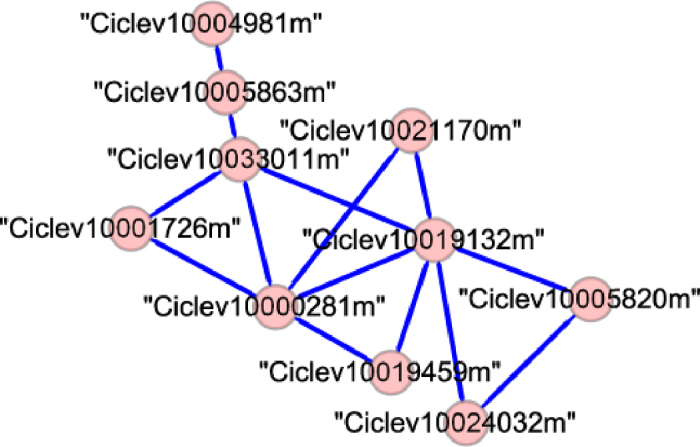
Genes and edges in canker-module 25.
(3) Module 19 in “flesh” network (flesh-module 19): fruit ripening
Flesh-module 19 was also selected based on functional enrichment analyses. It has 11 nodes, 11 edges, and a density of 0.2 (Figure 5). The highest ranked KEGG pathway of this module was the citrate cycle (TCA cycle) (ath00020, p = 0.00026). The citrate cycle is the major pathway for the synthesis of citric acid, the most abundant organic acid in citrus46. At least three nodes of this module were related to the citrate cycle: Ciclev10008189m (dihydrolipoamide succinyltransferase gene), Ciclev10025308m (dihydrolipoamide acetyltransferase gene), and Ciclev10013692m (acyl-activating enzyme 5 gene). Two nodes were involved in the biosynthesis of the polyphenol compounds: Ciclev10019346m (UDP-glycosyltransferase gene) and Ciclev10011175m (phenylalanine ammonia lyase gene). One node, Ciclev10028195m (glucose-1-phosphate adenylyltransferase gene) was involved in glycogen biosynthesis. All these nodes were linked by Ciclev10006509m, which encodes a subunit of a RUB (Related to Ubiquitin)-activating enzyme. The proteins encoded by these genes may be subject to similar post-translational modifications.
Figure 5.
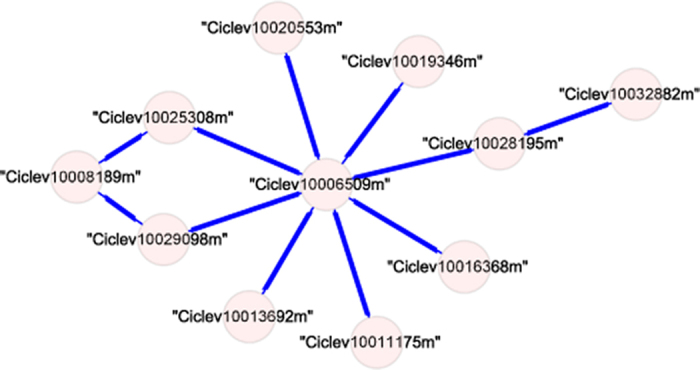
Genes and edges in flesh-module 19.
(4) Module 6 in “HLB” network (HLB-module 6): programmed cell death
HLB-module 6 has 28 nodes, 75 edges, and a density of 0.198 (Figure 6). This module was selected because 13 of these 28 genes (46.43%) were only included in “HLB” network. Seventeen genes were assigned to specific GO terms. The highest ranked GO term of this module was programmed cell death (PCD, GO: 0012501, p = 0.005). PCD is widely observed in plants in response to pathogenic infection. At least eight genes in this module were related to PCD. Bcl-2-associated athanogene gene (Ciclev10018596m) plays a critical role in PCD47. It can suppress PCD via its interaction with Hsc70 and Hsp40 (Ciclev10000372m)48. However, the up-regulation of genes involved in the ubiquitin-proteasome system can activate PCD49. Ciclev10008240m (polyubiquitin 10) and Ciclev10005221m (RING finger E3 ubiquitin ligases) are parts of the ubiquitin-proteasome system. Other genes related to PCD include: Ciclev10005800m (myosin heavy chain-related), Ciclev10032432m (sphingoid base hydroxylase), Ciclev10021281m (LAG1 longevity assurance homolog 3), and Ciclev10032631m (Glutaredoxin family protein). Their functions in HLB still need to be determined.
Figure 6.

Genes and edges in HLB-module 6.
Comparison with NICCE network
When this manuscript was being prepared, a citrus gene coexpression network (called “NICCE network” in this study) based on publicly available microarray data sets was reported17. There are several differences between the NICCE networks and networks in this study.
First, probe sets, rather than genes, were used to construct the NICCE networks. In the 30 217 nodes of the NICCE networks, 5960 (19.7%) nodes were not mapped to any citrus transcripts; 9336 (30.9%) nodes belonged to the “one probe set per transcript” group. 5775 transcripts (38.2%) were represented by the remaining 14 921 (49.4%) probe sets (Table S7). Therefore, 5.9% of the edges of NICCE networks were between probe sets of the same transcript/gene. Probe sets representing the same transcript were expected to have similar expression levels and appear in the same cluster of one network. However, this is not the case in the NICCE networks. One example (Cs1g07330.1) was shown in Table S8.
Second, when constructing the NICCE networks, PCC values between probe sets were transformed into highest reciprocal ranks (HRR), and the top 100 HRR for a given probe set was considered. This leads to most PCC values between nodes of NICCE networks being very low. Cs5g33560 was given as an example in the website of NICCE (http://citrus.adelaide.edu.au/nicce/home.aspx). However, the PCC values between Cs5g33560 and its coexpressed genes in condition-independent network range from 0.68 to 0.39. More attention should be paid to assess gene pairs with low PCC values.
Third, only sweet orange microarrays were used in this study, and they were classified into six condition-dependent data sets: citrus canker, HLB, leaves, flavedo, albedo, and flesh. In the NICCE networks, 297 microarrays from different species of citrus (including mandarin, sweet orange, lemon, and pummelo) were used, and they were classified into four condition-dependent data sets: sweet orange, fruit, leaf, and stress17.
In order to compare our networks with the NICCE networks, C. x clementina gene IDs from our networks were transformed to C. sinensis gene IDs. C. sinensis orthologs were not identified for 1504 C. x clementina genes in our networks. Therefore, only 26 191 edges in our networks were used in the comparison with the NICCE networks, whose nodes were also transformed to C. sinensis gene IDs. Only 3868 edges were found in common between the two networks. About 85% of edges in our networks were not included in the NICCE networks. This may be due to different classification methods for microarray data sets. Most edges (72.84%) in our networks were exclusively found in condition-dependent networks.
Validation of coexpression networks using RNA-seq data
To confirm the coexpression networks in this study, 500 edges among 371 genes were randomly selected from the “all data” network. The expression of these genes was examined using another gene expression data set (Table S9) in CAP34. The correlation coefficients (r) between them were computed. The distribution of these correlation coefficients was highly skewed, as shown in Figure 7. For 353 edges (70.6%), r values were higher than the PCC thresholds that were used to construct the “all data” networks (0.882). R values of 385 edges (77.0%) were higher than 0.8. These results suggest that the coexpression networks in this study are reliable.
Figure 7.
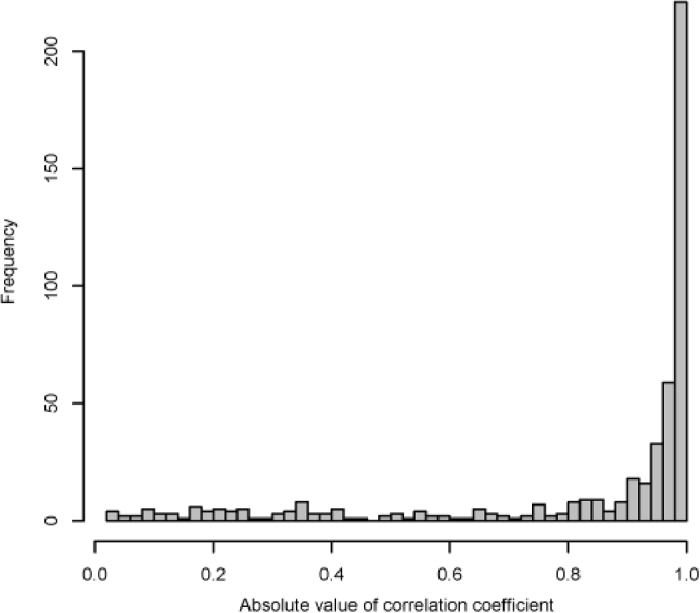
Distribution of absolute value of correlation coefficients.
Discussion
In this study, 230 citrus microarrays from a diverse collection of experiments were used to construct seven coexpression networks. The nodes of these networks range from 1137 to 2263, accounting for 9.47%–18.85% measurable genes of the citrus microarray. This is consistent with Ficklin’s work on rice20, which also employed the RMT method to select a threshold for rice coexpression network. 10% of the measurable genes on rice microarray were included in their network. The percentage is relatively low compared with other studies using empirical thresholds. For example, in the Arabidopsis coexpression network, the PCC cutoff value was set to 0.75 and 38% measurable genes were retained4. RMT method was taken from the field of particle physics and had been used to construct gene coexpression networks for Escherichia coli, yeast, human, Arabidopsis, rice, and maize20,28,50,51. It has been demonstrated to be a reliable method for generating networks across a wide range of data sets50. It should be mentioned that after combining the seven coexpression networks, the nodes captured in our study reached 52.11% of the measurable genes of the microarray.
Both condition-independent and condition-dependent analyses were employed to ensure that coexpressed genes in special conditions were not lost. 77.77% nodes and 72.84% edges in our networks were exclusively found in condition-dependent networks. Function analysis of modules yielded similar results. 66.31% enriched GO terms were identified only in condition-dependent networks, such as programmed cell death in “citrus canker”, “HLB”, and “albedo” network. Condition-independent analysis was considered to be suitable for identifying globally coexpressed genes7, such as genes in photosynthesis, ribosome and DNA metabolism. In this study, we found that condition-independent analysis was not sufficient to identify all the genes in these pathways. For example, 159 ribosome genes could be measured in the citrus microarray (Table S10). Thirty-seven ribosome genes were included in the condition-independent network (“all data”). This number is much smaller compared with 147 ribosome genes in “leaves” network. It has been demonstrated that gene coexpression analysis using too many microarray samples could result in the loss of information52. Therefore, condition-dependent analysis is necessary even for identifying globally coexpressed genes.
According to the present annotation of the C. x clementina genome, 2485 and 4682 (39.72% and 74.84%) genes in these networks were not assigned to a specific GO and KEGG pathway term, respectively8. The function of these genes could be predicted based on well-annotated genes within the same module. For example, 28 genes were included in HLB-module 6. Eleven of them were not labeled with a specific GO term, and only four genes were assigned to a specific KEGG pathway. Based on the above analysis, HLB-module 6 is likely to carry on the functions of programmed cell death. Unannotated genes in this module could be hypothesized to be related to programmed cell death. In addition to gene function prediction, gene coexpression analysis is also helpful for hypothesis generation and testing7. For example, several genes encoding transcription factors were also included in HLB-module 6, such as ERF and KH domain-containing putative RNA-binding protein. It has been demonstrated in Arabidopsis that a KH domain-containing putative RNA-binding protein is critical for HSF and HSP regulation53. Therefore, it would be reasonable to hypothesize that those transcription factors can regulate the expression of other genes within the same module.
Acknowledgments
This work was supported by a grant from the Citrus Research and Development Foundation (CRDF-724).
The authors declare no conflict of interest.
References
- Wu LF, Hughes TR, Davierwala AP, Robinson MD, Stoughton R, Altschuler SJ. Large-scale prediction of Saccharomyces cerevisiae gene function using overlapping transcriptional clusters. Nat Genet 2002; 31: 255–265. [DOI] [PubMed] [Google Scholar]
- Lee HK, Hsu AK, Sajdak J, Qin J, Pavlidis P. Coexpression analysis of human genes across many microarray data sets. Genome Res 2004; 14: 1085–1094. [DOI] [PMC free article] [PubMed] [Google Scholar]
- Fuller TF, Ghazalpour A, Aten JE, Drake TA, Lusis AJ, Horvath S. Weighted gene coexpression network analysis strategies applied to mouse weight. Mamm Genome 2007; 18: 463–472. [DOI] [PMC free article] [PubMed] [Google Scholar]
- Mao LY, Hemert JLv, Dash S, Dickerson JA. Arabidopsis gene co-expression network and its functional modules. BMC Bioinformatics 2009; 10: 346. [DOI] [PMC free article] [PubMed] [Google Scholar]
- Liang Y-H, Cai B, Chen F et al. Construction and validation of a gene co-expression network in grapevine (Vitis vinifera. L.). Hort Res 2014; 1: 14040. [DOI] [PMC free article] [PubMed] [Google Scholar]
- Aoki K, Ogata Y, Shibata D. Approaches for extracting practical information from gene co-expression networks in plant biology. Plant Cell Physiol 2007; 48: 381–390. [DOI] [PubMed] [Google Scholar]
- Usadel B, Obayashi T, Mutwil M et al. Co-expression tools for plant biology: opportunities for hypothesis generation and caveats. Plant Cell Environ 2009; 32: 1633–1651. [DOI] [PubMed] [Google Scholar]
- Wu GA, Prochnik S, Jenkins J et al. Sequencing of diverse mandarin, pummelo and orange genomes reveals complex history of admixture during citrus domestication. Nat Biotechnol 2014; 32: 656–662. [DOI] [PMC free article] [PubMed] [Google Scholar]
- Aritua V, Achor D, Gmitter FG, Albrigo G, Wang N. Transcriptional and microscopic analyses of citrus stem and root responses to Candidatus Liberibacter asiaticus infection. PLoS One 2013; 8: e73742. [DOI] [PMC free article] [PubMed] [Google Scholar]
- Febres VJ, Khalaf A, Gmitter FG, Moore GA. Evaluating gene expression responses of citrus to two types of defense inducers using a newly developed citrus agilent microarray. Acta Hortic 2012; 929: 59–64. [Google Scholar]
- Fan J, Chen C, Yu Q et al. Comparative transcriptional and anatomical analyses of tolerant rough lemon and susceptible sweet orange in response to ‘Candidatus Liberibacter asiaticus’ infection. Mol Plant Microbe Interact 2012; 25: 1396–1407. [DOI] [PubMed] [Google Scholar]
- Khalaf AA, Gmitter FG Jr., Conesa A, Dopazo J, Moore GA. Fortunella margarita transcriptional reprogramming triggered by Xanthomonas citri subsp. citri. BMC Plant Biol 2011; 11: 159. [DOI] [PMC free article] [PubMed] [Google Scholar]
- Fan J, Chen C, Yu Q, Brlansky RH, Li Z-G, Gmitter FG Jr. Comparative iTRAQ proteome and transcriptome analyses of sweet orange infected by “Candidatus Liberibacter asiaticus”. Physiol Plantarum 2011; 143: 235–245. [DOI] [PubMed] [Google Scholar]
- Khalaf AA, Gmitter FG, Brlansky RH, Fan J, Moore GA. Gene expression profiling of two citrus cultivars in response to huanglongbing (HLB) using the Agilent Citrus custom microarray Chip. Phytopathology 2010; 100: S61. [Google Scholar]
- Zheng Z, Zhao Y. Transcriptome comparison and gene coexpression network analysis provide a systems view of citrus response to ‘Candidatus Liberibacter asiaticus’ infection. BMC Genomics 2013; 14: 27. [DOI] [PMC free article] [PubMed] [Google Scholar]
- Martinelli F, Uratsu SL, Albrecht U et al. Transcriptome profiling of citrus fruit response to Huanglongbing disease. PloS One 2012; 7: 16. [DOI] [PMC free article] [PubMed] [Google Scholar]
- Wong DCJ, Sweetman C, Ford CM. Annotation of gene function in citrus using gene expression information and co-expression networks. BMC Plant Biol 2014; 14: 186. [DOI] [PMC free article] [PubMed] [Google Scholar]
- Atias O, Chor B, Chamovitz DA. Large-scale analysis of Arabidopsis transcription reveals a basal co-regulation network. BMC Syst Biol 2009; 3: 22. [DOI] [PMC free article] [PubMed] [Google Scholar]
- Childs KL, Davidson RM, Buell CR. Gene coexpression network analysis as a source of functional annotation for rice genes. PLoS One 2011; 6: e22196. [DOI] [PMC free article] [PubMed] [Google Scholar]
- Ficklin SP, Luo F, Feltus FA. The association of multiple interacting genes with specific phenotypes in rice using gene coexpression networks. Plant Physiol 2010; 154: 13–24. [DOI] [PMC free article] [PubMed] [Google Scholar]
- Ding Y, Chang J, Guo J et al. Prediction and functional analysis of the sweet orange protein-protein interaction network. BMC Plant Biol 2014; 14: 213. [DOI] [PMC free article] [PubMed] [Google Scholar]
- Ibanez AM, Martinelli F, Reagan RL et al. Transcriptome and metabolome analysis of citrus fruit to elucidate puffing disorder. Plant Sci 2014; 217: 87–98. [DOI] [PubMed] [Google Scholar]
- Martinelli F, Reagan RL, Uratsu SL et al. Gene regulatory networks elucidating Huanglongbing disease mechanisms. PLoS One 2013; 8: 12. [DOI] [PMC free article] [PubMed] [Google Scholar]
- Barrett T, Wilhite SE, Ledoux P et al. NCBI GEO: archive for functional genomics data sets-update. Nucleic Acids Res 2013; 41: D991–D995. [DOI] [PMC free article] [PubMed] [Google Scholar]
- Gautier L, Cope L, Bolstad BM, Irizarry RA. Affy – analysis of Affymetrix GeneChip data at the probe level. Bioinformatics 2004; 20: 307–315. [DOI] [PubMed] [Google Scholar]
- Kauffmann A, Gentleman R, Huber W. ArrayQualityMetrics – a bioconductor package for quality assessment of microarray data. Bioinformatics 2009; 25: 415–416. [DOI] [PMC free article] [PubMed] [Google Scholar]
- Liu H, Zeeberg BR, Qu G et al. AffyProbeMiner: a web resource for computing or retrieving accurately redefined Affymetrix probe sets. Bioinformatics 2007; 23: 2385–2390. [DOI] [PubMed] [Google Scholar]
- Gibson SM, Ficklin SP, Isaacson S, Luo F, Feltus FA, Smith MC. Massive-scale gene co-expression network construction and robustness testing using random matrix theory. PLoS One 2013; 8:e55871. [DOI] [PMC free article] [PubMed] [Google Scholar]
- Smoot ME, Ono K, Ruscheinski J, Wang P-L, Ideker T. Cytoscape 2.8: new features for data integration and network visualization. Bioinformatics 2011; 27: 431–432. [DOI] [PMC free article] [PubMed] [Google Scholar]
- Doncheva NT, Assenov Y, Domingues FS, Albrecht M. Topological analysis and interactive visualization of biological networks and protein structures. Nat Protoc 2012; 7: 670–685. [DOI] [PubMed] [Google Scholar]
- Enright AJ, Van Dongen S, Ouzounis CA. An efficient algorithm for large-scale detection of protein families. Nucleic Acids Res 2002; 30: 1575–1584. [DOI] [PMC free article] [PubMed] [Google Scholar]
- Goodstein DM, Shu S, Howson R et al. Phytozome: a comparative platform for green plant genomics. Nucleic Acids Res 2012; 40: D1178–D1186. [DOI] [PMC free article] [PubMed] [Google Scholar]
- Gentleman RC, Carey VJ, Bates DM et al. Bioconductor: open software development for computational biology and bioinformatics. Genome Biol 2004; 5: R80. [DOI] [PMC free article] [PubMed] [Google Scholar]
- Wang J, Chen D, Lei Y et al. Citrus sinensis annotation project (CAP): a comprehensive database for sweet orange genome. PLoS One 2014; 9: e87723. [DOI] [PMC free article] [PubMed] [Google Scholar]
- Lee T-H, Tang H, Wang X, Paterson AH. PGDD: a database of gene and genome duplication in plants. Nucleic Acids Res 2013; 41: D1152–D1158. [DOI] [PMC free article] [PubMed] [Google Scholar]
- Du D, Cheng T, Pan H, Yang W, Wang J, Zhang Q. Genome-wide identification, molecular evolution and expression analyses of the phospholipase D gene family in three Rosaceae species. Sci Hortic (Amsterdam) 2013; 153: 13–21. [Google Scholar]
- McGinnis S, Madden TL. BLAST: at the core of a powerful and diverse set of sequence analysis tools. Nucleic Acids Res 2004; 32: W20–W25. [DOI] [PMC free article] [PubMed] [Google Scholar]
- Wang Y, Tang H, DeBarry JD et al. MCScanX: a toolkit for detection and evolutionary analysis of gene synteny and collinearity. Nucleic Acids Res 2012; 40: e49. [DOI] [PMC free article] [PubMed] [Google Scholar]
- Wang X, Shi X, Li Z et al. Statistical inference of chromosomal homology based on gene colinearity and applications to Arabidopsis and rice. BMC Bioinformatics 2006; 7: 447. [DOI] [PMC free article] [PubMed] [Google Scholar]
- Stover E, Stange RR Jr., McCollum TG, Jaynes J, Irey M, Mirkov E. Screening antimicrobial peptides in vitro for use in developing transgenic citrus resistant to Huanglongbing and citrus canker. J Am Soc Hortic Sci 2013; 138: 142–148. [Google Scholar]
- Sekhon RS, Briskine R, Hirsch CN et al. Maize gene atlas developed by RNA sequencing and comparative evaluation of transcriptomes based on RNA sequencing and microarrays. PLoS One 2013; 8: 11. [DOI] [PMC free article] [PubMed] [Google Scholar]
- Hu Y, Zhang JL, Jia HG et al. Lateral organ boundaries 1 is a disease susceptibility gene for citrus bacterial canker disease. Proc Natl Acad Sci U S A 2014; 111: E521–E529. [DOI] [PMC free article] [PubMed] [Google Scholar]
- Dutta S, Biggs RH. Regulation of ethylene biosynthesis in citrus leaves infected with Xanthomonas campestris pv. citri. Physiol Plantarum 1991; 82: 225–230. [Google Scholar]
- Ouaked F, Rozhon W, Lecourieux D, Hirt H. A MAPK pathway mediates ethylene signaling in plants. EMBO J 2003; 22: 1282–1288. [DOI] [PMC free article] [PubMed] [Google Scholar]
- Hall AE, Findell JL, Schaller GE, Sisler EC, Bleecker AB. Ethylene perception by the ERS1 protein in Arabidopsis. Plant Physiol 2000; 123: 1449–1458. [DOI] [PMC free article] [PubMed] [Google Scholar]
- Yu KQ, Xu Q, Da XL, Guo F, Ding YD, Deng XX. Transcriptome changes during fruit development and ripening of sweet orange (Citrus sinensis). BMC Genomics 2012; 13: 10. [DOI] [PMC free article] [PubMed] [Google Scholar]
- Fang S, Li L, Cui B, Men S, Shen Y, Yang X. Structural insight into plant programmed cell death mediated by BAG proteins in Arabidopsis thaliana. Acta Crystallogr D 2013; 69: 934–945. [DOI] [PubMed] [Google Scholar]
- Luders J, Demand J, Papp O, Hohfeld J. Distinct isoforms of the cofactor BAG-1 differentially affect Hsc70 chaperone function. J Biol Chem 2000; 275: 14817–14823. [DOI] [PubMed] [Google Scholar]
- Serrano I, Gu Y, Qi D, Dubiella U, Innes RW. The Arabidopsis EDR1 protein kinase negatively regulates the ATL1 E3 ubiquitin ligase to suppress cell death. Plant Cell 2014; 26: 4532–4546. [DOI] [PMC free article] [PubMed] [Google Scholar]
- Luo F, Yang Y, Zhong J et al. Constructing gene co-expression networks and predicting functions of unknown genes by random matrix theory. BMC Bioinformatics 2007; 8: 299. [DOI] [PMC free article] [PubMed] [Google Scholar]
- Ficklin SP, Feltus FA. Gene coexpression network alignment and conservation of gene modules between two grass species: maize and rice. Plant Physiol 2011; 156: 1244–1256. [DOI] [PMC free article] [PubMed] [Google Scholar]
- Cosgrove EJ, Gardner TS, Kolaczyk ED. On the choice and number of microarrays for transcriptional regulatory network inference. BMC Bioinformatics 2010; 11: 454. [DOI] [PMC free article] [PubMed] [Google Scholar]
- Guan QM, Wen CL, Zeng HT, Zhu JH. A KH domain-containing putative RNA-binding protein is critical for heat stress-responsive gene regulation and thermotolerance in Arabidopsis. Mol Plant 2013; 6: 386–395. [DOI] [PubMed] [Google Scholar]
Associated Data
This section collects any data citations, data availability statements, or supplementary materials included in this article.