

Abstract
The computational composite scheme purposely set up for accurately describing the electronic structure and spectroscopic properties of small biomolecules has been applied to the first study of the rotational spectrum of 2-thiouracil. The experimental investigation was made possible thanks to the combination of the laser ablation technique with Fourier Transform Microwave spectrometers. The joint experimental – computational study allowed us to determine accurate molecular structure and spectroscopic properties for the title molecule, but more important, it demonstrates a reliable approach for the accurate investigation of isolated small biomolecules.
1. Introduction
Thiouracil and its structural analogues have attracted considerable attention in the last decades and they have extensively been studied from experimental and computational points of view because of their remarkable biological and chemotherapeutic properties.1 Thiouracil derivatives are of particular interest in view of their presence as minor components in natural t-RNAs2 and of their thyroid-regulating activities.3 This particular feature has led to the use of some thiouracil derivatives both as drugs for increasing the hypothyroidism effect on blood4 and as important components of dietary products.5 For example, 6-n-propyl-2-thiouracil is a potent antithyroid drug,6 fluorinated-2-thiouracil derivatives show remarkable antitumour7 and antithyroid8 activity, 5-cyano-2-thiouracils and their derivatives have considerable interest as potent leishmanicides.9 A further interest on these compounds is related to their use as marine corrosion inhibitors for steel10 and as dental adhesive in the treatment with metal surface.11 Among thiouracils, 2-thiouracil (2TU) is of particular importance for its anticancer and antiviral activity, related to its readily incorporation into nucleic acids,12 which avoids for instance the melanoma tumor growth.13 In addition to its direct use as antithyroid drug,14 the ability of 2TU of forming complexes with some divalent metal ions (Mn, Co, Ni, Cu, Zn, Cd)15,16 has been used for orienting the crystal growth in metal solutions.17
The knowledge of electronic, spectroscopic and, in general, physicochemical properties of isolated biological molecules is an important prerequisite in view of understanding their activity and interaction in different environments. Consequently, experimental and theoretical studies have been undertaken in order to fulfill this task. Electronic absorption and fluorescence spectra of 2TU have been well characterized18 together with IR spectra in different environments for both the title molecule19 and some metal complexes.20 In parallel, several quantum-mechanical studies helped in elucidating the physicochemical characteristics of 2TU and supported spectroscopic assignments (see Refs. 21-25 and references therein).
None of the experimental investigations mentioned above has provided an accurate molecular structure as well as none of the previous computational studies was carried out at a level of theory reliable enough to reach such a goal. Nevertheless, the detailed knowledge of structural parameters is a cornerstone of the physicochemical characterization of molecular systems. Despite the impressive advances of experimental techniques in the last decades, rotational spectroscopy is still the method of choice when aiming at highly accurate structural determinations. However, it is a formidable task to extract the desired information from the experimental data, especially when large molecules are considered. In particular, precise molecular structures for most of the building blocks of biomolecules are not yet available, remarkable exceptions being proline, alanine, glycine and uracil.26-31 For these molecules, the so-called semi-experimental equilibrium structure is available. The corresponding approach is based on experimental rotational ground-state constants computationally corrected for vibrational effects. The latter (which require cubic force field) can be nowadays obtained also for quite large molecules thanks to the development of reliable methods based on density functional theory (DFT) and mixed analytical/numerical derivatives.32-34 However, for molecules of biological interest like thiouracil, it is very difficult to obtain the experimental data for the required number of isotopologues. Therefore, in the best case, it turns out to be necessary to fix some geometrical parameters to the corresponding computed values,26-30 but it might be unavoidable to entirely resort to calculated geometrical parameters. To assure the proper accuracy, the latter should be determined by means of suitable quantum-chemical composite schemes. To this purpose, we have recently set up a specific protocol for large, closed-shell molecules.28-31 This is based on the coupled-cluster singles doubles approach with perturbative inclusion of triple excitations (CCSD(T))35 together with extrapolation to the complete basis set (CBS) limit and inclusion of core-correlation effects. It has been demonstrated that the basis set extrapolation can be performed by means of the cheaper second-order Møller-Plesset perturbation theory (MP2)36 without significantly increasing the error of the computed geometrical parameters.28-31
The first problem to be faced for investigating the rotational spectrum of 2TU is the lack of information on the required spectroscopic parameters. In this respect, in recent studies we have validated our protocol using the available experimental data for different isotopic species and/or conformers of uracil and glycine.28-31 In particular, we demonstrated that our approach is able to provide rotational constants with an accuracy well within 0.1-0.2%, quartic centrifugal-distortion constants with an accuracy of about 3-5% and nuclear quadrupole-coupling constants with an accuracy of a few per cent. Therefore, thanks to our protocol we expect to be able to accurately predict the rotational spectrum of thiouracil and its hyperfine structure due to the nitrogen nuclei.
Guided by the computations mentioned above, the rotational spectrum of 2TU has been investigated by Fourier transform microwave spectroscopy (FTMW). The latter is a well-known technique for studying the preferred tautomers/conformers of molecules in the gas phase by virtue of their rotational spectra. Fourier transform microwave techniques in combination with supersonic jets and laser ablation have proved to be powerful tools to probe in detail the structure of biomolecules characterized by high melting points. As a consequence, laser ablation molecular beam Fourier transform microwave spectroscopy (LA-MB-FTMW)37 has been successfully applied to relevant biomolecules such as amino acids,38,39 nucleic acid bases,40-43 neurotransmitters,44 sugars45 and drugs.46 Recently, this field of research has been accelerated by the development of broadband microwave spectrometers,47,48 which allow the rapid acquisition of rotational spectra in a wide frequency range, thus overcoming the low scanning process required by the conventional (LA-)MB-FTMW spectroscopy. To record the broadband rotational spectra of biomolecules with high melting points, like 2TU (m.p.: >300°C), this technique has been combined with a laser ablation source.49-51
The present paper is organized as follows. In the next section the composite quantum-chemical scheme employed is summarized, the relevant computational details are provided and then the prediction of the rotational spectrum is described. Thereafter, the experimental work is described in detail. Finally, our results concerning the spectroscopic parameters as well as the molecular structure are reported and discussed.
2. Methodology and computational details
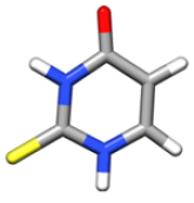
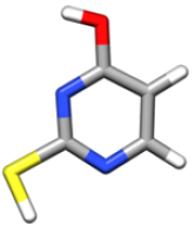
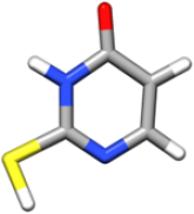
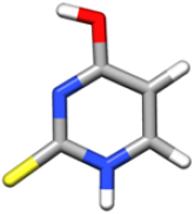
In the gas phase, nucleobases and nucleobases derivatives exhibit different tautomers in equilibrium with each other, whose relative population depends on their energy, with only one tautomer being actually observable in a supersonic jet whenever it is considerably more stable than the others (for cytosine and guanine, five and four tautomers/conformers have been observed, respectively) and barriers to conformational conversion are not too large. According to previous theoretical and experimental investigations (see Refs. 21,24 and references therein), the energy differences are such that the keto-thione form of 2-thiouracil is the only tautomer present in the gas phase. A preliminary investigation was anyway carried out at the CCSD(T) level in conjunction with a triple-zeta quality basis set for the four most stable tautomers21 (namely, 2-thione-4-oxo, 2-mercapto-4-hydroxy, 2-mercapto-4-oxo, 2-thione-4-hydroxy). The results, summarized in Table 1, clearly justify why in the following only the keto-thione (2-thione-4-oxo) form has been considered.
Table 1.
Spectroscopic parameters and relative energies of the lowest energy tautomers of 2-thiouracil at the CCSD(T)/cc-pVTZ level of theory.
| I (CO-CS) | II (OH-SH) | III (CO-SH) | IV (CS-OH) | |
|---|---|---|---|---|
| Parameter |
|
|
|
|
| A0 [MHz] a | 3527.374 | 3486.471 | 3522.144 | 3543.632 |
| B0 [MHz] a | 1299.478 | 1312.578 | 1290.860 | 1301.384 |
| C0 [MHz] a | 949.724 | 953.585 | 942.492 | 951.911 |
| ΔA0 [MHz] b | 23.139 | 23.961 | 22.433 | 27.194 |
| ΔB0 [MHz] b | 7.072 | 8.092 | 8.117 | 6.403 |
| ΔC0 [MHz] b | 5.364 | 6.056 | 5.845 | 5.304 |
| 14N(1) | ||||
| χaa [MHz] | 1.688 | −1.575 | −0.840 | 1.369 |
| χbb [MHz] | 1.826 | −0.600 | −0.513 | 1.313 |
| χcc [MHz] | −3.513 | 2.175 | 1.354 | −2.682 |
| χab [MHz] | 0.292 | 3.002 | 2.987 | 0.170 |
| 14N(3) | ||||
| χaa [MHz] | 1.782 | 1.708 | 1.430 | 2.034 |
| χbb [MHz] | 1.438 | −3.430 | 1.633 | −3.827 |
| χcc [MHz] | −3.221 | 1.722 | −3.063 | 1.793 |
| χab [MHz] | −0.323 | −1.337 | −0.221 | −1.385 |
| ΔE [kcal/mol] | 0 | 8.48 | 9.82 | 18.32 |
| ΔE0 [kcal/mol] c | 0 | 5.98 | 7.17 | 18.15 |
Equilibrium rotational constants at the CCSD(T)/cc-pVTZ level augmented by vibrational corrections at the B3LYP/SNSD level.
At the B3LYP/SNSD level.
Energy difference (with respect to I) including anharmonic VPT2 zero-point energy corrections84 at the B3LYP/SNSD level.
2.1 Theoretical equilibrium structure
The first step toward the prediction of the rotational spectrum is the accurate determination of the equilibrium structure that straightforwardly provides reliable equilibrium rotational constants.52 To fulfill this task, we recently set up a quantum-chemical protocol successfully applied to uracil and glycine conformers.28-31 This approach relies on the simultaneously account for basis-set and electronic-correlation effects by means of a composite scheme, in which the various contributions are evaluated separately at the highest possible level and then combined in order to obtain a best theoretical estimate.
The MP2 method was used in conjunction with correlation consistent-type basis sets, the standard cc-pVnZ53 basis sets (n=T,Q) as well as a triple-zeta basis set augmented by diffuse functions, aug-cc-pVTZ.54 In both cases, the frozen core (fc) approximation was adopted. To take into account core-correlation effects, the core-valence correlation consistent cc-pCVTZ55,56 basis set was used, whereas the CCSD(T) was employed together with the cc-pVTZ basis set in order to improve the electronic correlation treatment. All MP2 and CCSD(T) calculations reported in the present paper were performed with the CFour program package;57 the planarity of the molecule was constrained in geometry optimizations.
To account for basis-set truncation effects, the complete basis set (CBS) limit was evaluated by making the assumption that the convergence behavior of the structural parameters mimics that of the energy. The consolidated 1/n3 extrapolation form58 was applied to the case n=T and Q, i.e., to the MP2/cc-pVTZ and MP2/cc-pVQZ optimized geometries:
| (1) |
where n=4 stands for cc-pVQZ, and thus r(n) and r(n-l) denote the MP2/cc-pVQZ and MP2/cc-pVTZ optimized parameters, respectively. Even though this procedure is only empirically based, it involves small- to medium-sized basis sets, and the function of Eq. (1) was applied to the whole parameter and not to the correlation contribution only, as it would be required, a thorough investigation demonstrated its reliability.59 The effects due to core-valence (CV) electron correlation were included by means of geometry optimizations performed with all electrons correlated, and the corresponding correction, Δr(CV), defined as follows
| (2) |
where r(CVTZ,all) and r(CVTZ,valence) are the geometries optimized at the MP2/cc-pCVTZ level correlating all and only valence electrons, respectively. Analogously, to take in account the effect of diffuse functions (diff), the molecular structure was also optimized at the MP2/aug-cc-pVTZ level within the fc approximation. The corresponding correction to the equilibrium geometry, Δr(diff), is given by
| (3) |
with r(augVTZ,valence) being the geometry optimized at the MP2/aug-cc-pVTZ level. While there is no theoretical justification for the inclusion of diffuse function effects once extrapolation to the CBS limit is performed, the latter correction is introduced to recover on an empirical basis the limitations affecting extrapolation procedures carried out with small- to medium-sized basis sets. The higher-order correlation energy contributions on molecular structure were also considered by means of CCSD(T) calculations, the corresponding correction (Δr(T)) derived from the comparison with the geometry optimized at the MP2 level (both with the cc-pVTZ basis):
| (4) |
On the whole, our best-estimated equilibrium structure was determined by putting together all contributions, thus making use of the additivity approximation as
| (5) |
2.2 Spectroscopic parameters
For a semi-rigid rotor, the phenomenological Hamiltonian commonly used for describing the rotational motion includes both centrifugal distortion and vibrational effects.52,60 Centrifugal-distortion effects can be conveniently treated by means of perturbation theory, where the unperturbed Hamiltonian is the rotational Hamiltonian for a rigid rotor and the perturbation includes centrifugal-distortion effects. Molecular vibrations can be conveniently described by means of vibrational perturbation theory (VPT),52,60,61 thus leading to the vibrational dependency of the rotational constant of the v-th vibrational state as expressed by an expansion in power of (v + 1/2).62 To second-order perturbation theory, only the linear term is retained
| (6) |
where the sum runs over all normal modes r, i refers to the principal axis, dr is the degeneracy of the r-th vibrational mode, and denotes the vibration–rotation interaction constant corresponding to the r-th mode and the i-th inertial axis. It is worth noting that all possible Coriolis resonance terms appearing in the perturbative expression of the vibration-rotation interaction constants are canceled once the summation is performed.63,64 Vibration–rotation interaction constants were obtained by means of VPT2,62 following the approach described in Ref. 65. The required cubic force field was computed at the DFT level. Within the DFT approach, the standard B3LYP functional has been used in conjunction with the double-zeta SNSD66 basis set. All DFT and VPT2 computations were performed employing a locally modified version of the Gaussian suite of programs for quantum chemistry.67
At the optimized geometries at the various levels of theory considered in the frame of the best-estimated equilibrium geometry determination, harmonic force fields were computed at the corresponding level of theory using analytic second derivatives,68 as implemented in the CFour program package.57 By making use of these harmonic force fields, best estimates for quartic centrifugal-distortion constants, D(best), were derived by means of the following composite scheme:
| (7) |
where D denotes a generic quartic centrifugal-distortion constant. The first difference provides the CV correction (ΔD(CV)), the second one the contribution of diffuse functions (ΔD(aug)), and the latter the effect of enlarging the basis set from a triple-zeta to a quadruple-zeta set, with all corrections computed at the MP2 level. Watson’s S-reduced Hamiltonian in the Ir representation60 was employed.
The same composite scheme was considered for the nitrogen quadrupole-coupling constants, χij, where ij refer to the principal inertial axes. The additivity scheme was actually applied to the electric field-gradient components qij, which are the quantities computed by electronic-structure calculations. The latter are transformed to nuclear quadrupole-coupling constants by means of
| (8) |
where eQ in the present case is the nitrogen quadrupole moment, Q(14N) = 0.02044(3) barn, taken from Ref. 69.
2.3 Prediction of the rotational spectrum
To support and guide the search and assignment of the rotational spectrum of thiouracil, the rotational, centrifugal-distortion and nitrogen quadrupole-coupling constants, computed as explained above, are required. The missing piece of information is the dipole moment, whose components allow us to predict what type of transitions can be observed. While for this purpose a qualitative description of the dipole moment is sufficient, we can take the advantage of the computations carried out to provide an accurate estimate for this property.
The availability of the values at the MP2/cc-pVTZ and MP2/cc-pVQZ levels allows the extrapolation to the CBS limit of the correlation contribution with the 1/n3 extrapolation form.70 To obtain the extrapolated dipole moment, the CBS value of the correlation contribution was been added to the HF-SCF CBS limit, which was assumed to be reached at the HF-SCF/aug-cc-pV5Z level. The CV corrections were determined at the MP2/cc-pCVTZ level in analogy to Eq. (2). The effects of diffuse functions and higher-order correlation energy contributions were evaluated by comparing the dipole moment components at the MP2/aug-cc-pVTZ and CCSD(T)/cc-pVTZ levels with those at the MP2/cc-pVTZ level, in analogy to Eqs. (3) and (4), respectively. The best estimate of the dipole moment was then obtained by putting together all contributions:
| (9) |
For a quantitative prediction of the dipole moment components for the vibrational ground state, the required vibrational corrections were evaluated by means of a perturbative approach at the B3LYP/SNSD level of theory.65,67
The resulting best-estimated values are μa = 0.63 D and μb = 4.62 D, with the vibrational corrections being −0.03 and −0.10 D, respectively. Therefore, thiouracil presents a strong b-type spectrum and a rather weak a-type spectrum. The corresponding prediction of the rotational spectrum in the 4-12 GHz frequency range, based on the computed spectroscopic parameters, is depicted in Fig. 1, which also shows in detail the hyperfine structure due to the two nitrogen atoms for the 11,1 – 00,0 transition. The complicated hyperfine structure is due to the presence of two 14N nuclei and arises from the interaction of the nonzero electric quadrupole moment (due to nuclear spin I = 1) with the electric field gradient (created by the rest of the molecular charges) at the nuclei themselves. Such an interaction causes the coupling of the 14N nuclear spin moments with the end-over-end rotational momentum, giving rise to many hyperfine components spread over several megahertz.
Figure 1.

The computed rotational spectrum of 2-thiouracil in the 4-12 GHz frequency range. In the inset, the hyperfine structure of the 11,1-00,0 transition (hyperfine components are labeled with the quantum numbers I’, F’ → I”, F”), reporting the comparison of experimental and calculated spectra, is shown in detail.
3. Experimental details
The rotational spectrum of 2TU (m.p.: > 300°C) was obtained using two different FTMW spectrometers set up at the University of Valladolid. In both experiments samples were prepared by mixing the powder of the solid compound with a commercial binder. The mixture was pressed to form cylindrical rods, which were placed in a laser ablation nozzle49 to be vaporized using the third (355 nm) harmonic (12 mJ per pulse) of a 20 picosecond Nd:YAG laser. The vaporized molecules were seeded in the carrier gas, Ne, at a backing pressure of 15 bar, to expand adiabatically into the spectrometer vacuum chamber.
The first experiments were carried out using a chirped pulse Fourier Transform microwave (CP-FTMW) spectrometer with a laser ablation source49 operating between 6.0 and 18.0 GHz. An arbitrary waveform generator creates a chirped pulse from 6 to 12 GHz, which is subsequently amplified by a 300 W travelling wave tube amplifier. The amplified chirped pulse is broadcasted into the vacuum chamber through two microwave horns, interacting with the vaporized molecules in the pulsed jet. The second antenna is employed to detect the free induction decay (FID), which is amplified and digitized in a fast oscilloscope. The operation sequence starts with a molecular pulse of 1 ms duration, using the pulsed valve source. After an adequate delay, a laser pulse is used to vaporise the solid. Four separate broadband rotational spectra were acquired in each injection cycle. The rotational FID was detected for 10 μs following each 4 μs excitation pulse. To obtain the spectra for 2TU within the 6-12 GHz range, 120,000 individual FIDs were captured in time and converted to the frequency domain by taking the fast Fourier transform (FFT) after applying a Kaiser-Bessel window. Since the sample injection system has a perpendicular arrangement relative to the microwave field, the transit time of the polarized molecular jet is quite short, and line widths of the order of 100 kHz full-width-half-maximum (FWHM) are achieved.
The LA-MB-FTMW spectrometer, described elsewhere,37 covering the frequency range of 4–18 GHz, was used to record the 2TU spectra with the resolution necessary to analyze the hyperfine structure due to the presence of two quadrupolar nuclei, 14N (I = 1), in the molecule. The optimal conditions to polarize the molecules in the jet correspond to molecular pulses of about 1.1 ms, followed by MW polarization pulses of 0.3 μs duration with powers of 1–40 mW. The microwave transient FID was recorded for 100 μs in the time domain at 40–100 ns sample intervals and Fourier-transformed to the frequency domain. Due to the collinear disposition between the supersonic jet and the microwave resonator axes,37 all emission signals appeared to be split into Doppler doublets. The arithmetic mean of the doublets was taken as the rest frequency. The estimated accuracy of the frequency measurements is better than 3 kHz; 10 to 200 averages were phase-coherently co-added to achieve reasonable signal-to-noise ratios (S/N).
4. Results
4.1 Rotational spectra: analysis and assignment
The recorded broadband spectrum of 2TU using the CP-FTMW instrument described above, is shown in Fig. 2a. Guided by the theoretical prediction of the rotational spectrum, the simultaneous observation of 6 GHz frequency range allowed us to record and assign one intense J + 11,J+1 ← J0,J μb-R-branch progression with the J quantum number ranging from 1 to 4. Thanks to its characteristic frequency and intensity pattern as well as to the close match with the theoretical predictions (the differences ranging from a few hundreds of kHz – see the inset of Fig. 1 – up to a few MHz), the spectrum was easily assigned. A closer look to each rotational transition (see, for example, the 21,2–10,1 transition in Fig. 2b) shows a barely resolved complicated hyperfine structure. As shown in Fig. 2b, the resolution attained with the CP-FTMW technique is not sufficient to analyze this hyperfine structure. For this reason, only the central frequencies were measured and used in an iterative process to improve the initial set of rotational constants and to subsequently predict and measure new μb-R-branch transitions, thus leading to an improved set of rotational constants. Once the lines belonging to the parent species were removed from the spectrum, taking advantage of the high sensitivity of this spectrometer, the 34S-containing species was observed in natural abundance (4.2 %), with the experimental frequency shifts observed for the 34S species being consistent with those predicted theoretically, further supporting the assignment. Several attempts addressed to the detection of 13C species resulted unsuccessful due to the weakness of the corresponding transitions.
Figure 2.

(a) The broadband microwave spectrum of 2-thiouracil; (b) the 21,2-10,1 transition, as resolved in the chirp excitation spectrum; (c) the complicated hyperfine structure of the 21,2-10,1 transition, as resolved by means of the LA-MB-FTMW spectrometer. The hyperfine components are labeled with the quantum numbers I’, F’ → I”, F”.
The ultra high resolution reached in the LA-MB-FTMW experiment made it possible to resolve the hyperfine structure of the main and 34S-containing species for several transitions measured in the 4-10 GHz frequency range (see Fig. 2c for the 21,2-10,1 transition and Fig. 1 for the 11,1–00,0 transition). The measured hyperfine components for both species are collected in Table S1 and S2 of ESI. They were fitted71 using a Hamiltonian H = HR + HQ, where HR is the semi-rigid rotor Hamiltonian and HQ the nuclear quadrupole-coupling Hamiltonian.52,72 The latter was set up in the coupled basis set (I1 I2 I J F), I1 + I2 = I, I + J = F.14 The energy levels involved in each transition were thus labeled with the quantum numbers J, Ka, Kc, I, F. The final set of rotational and quadrupole coupling constants are collected in Table 2, where they are compared to the theoretical counterparts.
Table 2.
Experimentala and theoretical (best-estimated) spectroscopic parameters of the main and 34S-containing species of 2-thiouracil.
| Parameter | Main | 34S | ||
|---|---|---|---|---|
|
| ||||
| Exp | Theo | Exp | Theo | |
| A0 [MHz] | 3555.18805(64) | 3555.458 | 3545.6594(11) | 3545.945 |
| B0 [MHz] | 1314.86002(27) | 1315.287 | 1276.1741(51) | 1276.569 |
| C0 [MHz] | 960.03086(16) | 960.200 | 938.57117(54) | 938.732 |
| Δ0 b [uǺ2] | −0.09255(19) | −0.0899(19) | ||
| DJc [kHz] | - | 0.032 | - | 0.031 |
| DJKc [kHz] | - | 0.596 | - | 0.606 |
| DKc [kHz] | - | 0.053 | - | 0.050 |
| D1c [kHz] | - | −0.011 | - | −0.011 |
| D2c [kHz] | - | −0.002 | - | −0.002 |
| 14N(1) | ||||
| χaa [MHz] | 1.634(10) | 1.609 | 1.616(13) | 1.614 |
| χbb [MHz] | 1.777(12) | 1.813 | 1.755(17) | 1.807 |
| χcc [MHz] | −3.411(12) | −3.422 | −3.371(17) | −3.422 |
| χab [MHz] | - | 0.314 | - | 0.316 |
| 14N(3) | ||||
| χaa [MHz] | 1.726(10) | 1.739 | 1.732(13) | 1.733 |
| χbb [MHz] | 1.399(13) | 1.384 | 1.429(19) | 1.390 |
| χcc [MHz] | −3.125(13) | −3.123 | −3.161(19) | −3.123 |
| χab [MHz] | - | −0.336 | - | −0.339 |
| σ d [kHz] | 1.8 | - | 1.7 | - |
| N e | 70 | - | 24 | - |
Standard error in parenthesis in the units of the last digit.
Δ0 = Ic - Ia - Ib is the inertial defect. Conversion factor: 505379.1 MHz uÅ2.
Watson S-reduction.
Standard deviation of the fit.
Number of fitted hyperfine components.
The comparison presented in Table 2 points out a very good agreement between experiment and theory, with the discrepancies for rotational constants being smaller than 0.1% in relative terms. The various contributions to the computed rotational constants are detailed in Table 3. We note that the extrapolation to the CBS limit enlarges the rotational constants by about 0.3%, which are further increased by about the same quantity once core-correlation corrections are included. on the other hand, rather negligible are the contributions of diffuse functions, with that for A being the largest (~0.09%). As expected the largest effects are provided by the account of triple excitations, with the corresponding corrections being of the order of 0.5%. As concerns the computed nuclear quadrupole-coupling constants, the discrepancies with respect to experiment are of the order of 1%. The deviations are thus larger than what observed for rotational constants and might be ascribed to the missing consideration of the vibrational corrections. According to the literature on this topic (see, for example, Refs. 73-76), the latter corrections are expected to be small and range in size, in relative terms, from 0.1% to 4%, but they can also be as large as ~20% .77 From the inset of Fig. 1, it is apparent that the discrepancies between experiment and theory lead to negligible differences in the spectra, with the experimental hyperfine structure perfectly reproduced by calculations.
Table 3.
Equilibrium structure of 2-thiouracil. Distances in Å, angles in degrees, and rotational constants in MHz.
| MP2/VTZ | MP2/VQZ | MP2/CBSa | CBS+CV b | CBS+CV+diff c | Best estimate d | |
|---|---|---|---|---|---|---|
| Distances | ||||||
| N1-C2 | 1.3717 | 1.3690 | 1.3669 | 1.3646 | 1.3648 | 1.3654 |
| C2-N3 | 1.3670 | 1.3646 | 1.3628 | 1.3605 | 1.3609 | 1.3631 |
| N3-C4 | 1.4080 | 1.4047 | 1.4023 | 1.3997 | 1.3988 | 1.4017 |
| C4-C5 | 1.4511 | 1.4487 | 1.4469 | 1.4443 | 1.4431 | 1.4522 |
| C5-C6 | 1.3496 | 1.3476 | 1.3462 | 1.3435 | 1.3443 | 1.3448 |
| C6-N1 | 1.3688 | 1.3666 | 1.3650 | 1.3627 | 1.3631 | 1.3714 |
| C2-S7 | 1.6474 | 1.6433 | 1.6403 | 1.6367 | 1.6374 | 1.6496 |
| C4-O8 | 1.2176 | 1.2159 | 1.2146 | 1.2130 | 1.2156 | 1.2130 |
| N1-H9 | 1.0076 | 1.0069 | 1.0064 | 1.0055 | 1.0066 | 1.0058 |
| N3-H10 | 1.0120 | 1.0112 | 1.0107 | 1.0098 | 1.0108 | 1.0098 |
| C5-H11 | 1.0765 | 1.0760 | 1.0756 | 1.0744 | 1.0753 | 1.0768 |
| C6-H12 | 1.0799 | 1.0793 | 1.0788 | 1.0776 | 1.0783 | 1.0796 |
| Angles | ||||||
| C2-N1-C6 | 123.89 | 123.88 | 123.87 | 123.85 | 123.85 | 123.69 |
| C5-C4-N3 | 113.12 | 113.26 | 113.37 | 113.39 | 113.60 | 113.84 |
| C4-N3-C2 | 128.60 | 128.47 | 128.37 | 128.34 | 128.18 | 127.78 |
| N3-C2-N1 | 113.07 | 113.16 | 113.23 | 113.25 | 113.31 | 113.78 |
| N3-C2-S7 | 124.24 | 124.15 | 124.08 | 124.07 | 123.99 | 123.69 |
| N3-C4-O8 | 120.30 | 120.22 | 120.16 | 120.17 | 120.02 | 119.99 |
| C2-N1-H9 | 114.98 | 114.97 | 114.96 | 114.96 | 114.98 | 115.18 |
| C2-N3-H10 | 115.62 | 115.70 | 115.75 | 115.78 | 115.88 | 116.06 |
| C6-C5-H11 | 121.57 | 121.64 | 121.69 | 121.71 | 121.80 | 122.19 |
| N1-C6-H12 | 115.47 | 115.47 | 115.47 | 115.49 | 115.48 | 115.29 |
| Equil. rotational constants | ||||||
| Ae | 3569.71 | 3580.80 | 3588.94 | 3601.24 | 3597.89 | 3578.60 (3578.33) e |
| Be | 1313.63 | 1319.91 | 1324.53 | 1329.46 | 1329.58 | 1322.36 (1321.93) e |
| Ce | 960.26 | 964.42 | 967.48 | 971.00 | 970.82 | 965.56 (965.39) e |
CBS parameters obtained using Eq. (1).
CV corrections (Eq. (2)) added to the CBS parameters.
Corrections due to diffuse functions (Eq. (3)) added to the CBS+CV parameters.
Best-estimated structure according to Eq. (5).
Semi-experimental equilibrium rotational constants obtained by subtracting the B3LYP/SNSD vibrational corrections from the experimental ground-state rotational constants.
The last comment refers to the computed quartic centrifiugal-distortion constants given in Table 2. On the basis of our previous experience,28-30 the composite approach is expected to provide results with an accuracy of about 1%. Therefore, the values reported should be useful for further investigations at higher frequencies.
4.2 Molecular structure and tautomerism
The equilibrium structure of 2TU as obtained at the MP2 level using the triple- and quadruple-zeta basis sets, the extrapolated CBS structure (Eq. (1)) as well as the equilibrium geometries resulting from the inclusion of the various corrections together with the best-estimated equilibrium structure (Eq. (5)) are reported in Table 3 (for atoms labeling, see Fig. 3). From Table 3 one may notice that the corrections due to the extrapolation to the CBS limit, with respect to the MP2/cc-pVQZ level of theory, range from less than 0.001 Å for the distances involving H to 0.002-0.003 Å for the other bond lengths. The effects due to core correlation are of the same order of magnitude. Due to the well-known importance of triple excitations in accurate molecular structure calculation,78-81 even larger effects are expected; in fact, corrections as large as 0.009-0.01 Å are also observed. By contrast, inclusion of diffuse functions is less important, with all corrections being of the order of 0.001 Å or even smaller. Concerning angles, we note that the corrections due to extrapolation to the CBS limit range from 0.05 to 0.1 degrees, while the CV corrections are smaller (0.01-0.03 degrees). The effects of diffuse functions and higher-order correlation energy contributions turn out to be larger, with the former being of the order of 0.1-0.2 degrees and the latter being about twice as large. On the basis of the literature on this topic (see, for example, Refs. 28-31), conservative uncertainties for the resulting best estimate are 0.001-0.002 Å for bond lengths and 0.05-0.1 degrees for angles. The good accuracy of our theoretical equilibrium structure is also suggested by the very good agreement between theoretical and experimental rotational constants, as seen in Table 2 for the vibrational ground-state parameters. Since rotational constants are straightforwardly related to molecular structure, more interesting is to compare the equilibrium rotational constants corresponding to the best-estimated structure with the semi-experimental ones, as obtained from the experimental vibrational ground-state rotational constants corrected for the computed vibrational corrections (with the latter calculated at the B3LYP/SNSD level). Since these corrections are small terms with respect to the equilibrium contributions such an approach provides reliable estimates for the equilibrium rotational constants. The semi-experimental equilibrium rotational constants for different isotopic species can be used in the so-called semi-experimental approach for deriving equilibrium geometry, which is based on experimental ground-state rotational constants for different isotopic species and the corresponding computed vibrational corrections (for a detailed description, the reader is referred to Refs. 81-83 and references therein). Unfortunately, in the present case experimental rotational constants are available only for two isotopic species, which means that we have at our disposal only four rotational constants.◇ This means that, at maximum, only three parameters can be determined. Since the isotopic substitution is at the sulfur atom, the parameters involving the latter seem to be the best choice. If only the C=S distance and the corresponding angle formed with the C-N bond (i.e., N3-C2-S7) are fitted, the values of 1.65020(3) Å and 123.685(4) degrees are obtained, respectively, which are in perfect agreement with our best-estimated data. In a second fit the C-N distance involving the C2 (that bonded to sulfur) and N3 atoms was also determined, even if the isotopic substitution at sulfur does not directly provide information on this parameter. Also in this case, with N3-C2 = 1.36399(6) A, S7-C2 = 1.64911(7) Å and N3-C2-S7 = 123.720(2) degrees, we note a very good agreement with our computed values. The analysis of the determinable semi-experimental equilibrium parameters therefore tends to confirm the error estimate mentioned above.
Figure 3.

The molecular structure of the most stable keto-thione conformer of 2-thiouracil (the atoms labeling is also shown).
As it occurs for uracil, a particular tautomer of 2TU cannot be unambiguously identified taking into account only the rotational constants. However, experimental values of the quadrupole coupling constants χaa, χbb, and χcc of the two 14N nuclei are consistent only with those predicted for the structure I of Table 1, corresponding to the keto-thione structure. In particular, the negative χcc experimental values correspond to two pyrrolic nitrogen atoms. Once more, quadrupole-coupling constants can be taken as a unique tool to distinguish between different tautomers. This is confirmed by the results collected in Table 1, where we note that the nuclear quadrupole-coupling constants differ noticeably when going from one tautomer to another. It should be anyway pointed out that in the present case, energetic arguments should be sufficient to judge which tautomer is present in the supersonic exapnsion.
The last comment concerns the planarity of 2TU. The inertial defects, Δ=Ic−Ia−Ib, derived from the ground-state rotational constants for both the main and 34S-containing species indicate that the observed tautomer has a planar skeleton with some bending modes (C=O) giving an additional negative contribution.
5. Concluding remarks
The first investigation of the rotational spectrum of 2-thiouracil allowed us to further validate the reliability and accuracy of the quantum-chemical composite approach purposely set up for the accurate characterization of small biomolecules. It has further proved that the spectroscopic accuracy requirements can be fulfilled even in the field of rotational spectroscopy of large molecules. on the other side, the laser ablation technique combined with a chirped pulse FTMW spectrometer made it possible to investigate 2-thiouracil, thus permitting to obtain the molecule in the gas phase without decomposition and to record a broadband spectrum.
On a general ground, the present study demonstrates how fruitful the interplay of experiment and theory is in the field of rotational spectroscopy, in particular when small biomolecules are involved. The results obtained for the equilibrium geometry pave the route for the accurate determination of the molecular structure of isolated building blocks of biomolecules, thus allowing a detailed knowledge of their conformational behavior without the perturbing effects of environment (present in condensed phases), which is an essential prerequisite toward the understanding of the role played by different interactions in determining the biological activity in terms of structure – activity relationships.
Supplementary Material
ACKNOWLEDGMENTS
This work was supported by Italian MIUR (PRIN 2009, FIRB) and by the University of Bologna (RFO funds). In Spain, this research was supported by the Ministerio de Ciencia y Innovatión (Grant CTQ 2010-19008), Consolider Ingenio 2010 (CSD 2009-00038), Junta de Castilla y León (VA070A08). The research leading to these results has received funding from the European Union’s Seventh Framework Programme (FP7/2007-2013) under grant agreement N° ERC-2012-AdG-320951-DREAMS. Authors gratefully thank the high performance computer facilities of the DREAMS center (http://dreamshpc.sns.it) for providing computer resources. The support of the COST CMTS-Action CM1002 “COnvergent Distributed Environment for Computational Spectroscopy (CODECS)” is also acknowledged.
Footnotes
References
- [1].Shah A, Nosheen E, Zafar F, Uddin SN, Dionysios DD, Badshah A, Zia-ur-Rehman, Khan GS. J. Photochem. Photobiol. B. 2012;117:269–277. doi: 10.1016/j.jphotobiol.2012.09.008. [DOI] [PubMed] [Google Scholar]
- [2].Yaniv M, Folk WR. J. Biochem. 1975;250:3243. [PubMed] [Google Scholar]; Lehninger AL. Biochemistry: The Molecular Basis of Cell Structure and Function. 2nd ed. Worth Publisher; New York: 1978. 698. [Google Scholar]
- [3].Saenger W. Principles of Nucleic Acid Structure. Springer Advanced Texts in Chemistry; Springer-Verlag; New York: 1984. p. 556. [Google Scholar]
- [4].Padro T, Van der Hoogen CM, Emeis JJ. Blood Coagul. Fibrinolysis. 1993;4:797. [PubMed] [Google Scholar]
- [5].Peebles ED, Miller H, Boyle CR, Brake JD, Latour MA. Poult. Sci. 1994;73:1829. doi: 10.3382/ps.0731829. 1994. [DOI] [PubMed] [Google Scholar]; ibid. 1997;76:236. [Google Scholar]
- [6].Matammal MB, Lakshmi VM, Zenser TV, Davis BB. J. Pharm. Biomed. Anal. 1990;8:151. doi: 10.1016/0731-7085(90)80022-h. [DOI] [PubMed] [Google Scholar]
- [7].Bretner M, Kulokowski T, Dzik JM, Balinska M, Rode W, Shugar D. J. Med. Chem. 1993;36:3611. doi: 10.1021/jm00075a016. [DOI] [PubMed] [Google Scholar]
- [8].Aboul-Enein HY, Al-is NM. J.Enzyme Inhib. 1993;7:197. doi: 10.3109/14756369309040756. [DOI] [PubMed] [Google Scholar]
- [9].Ram VJ, Goel A, Nath M, Srivastava P. Bioorg. Med. Chem Lett. 1994;4:2653. 1994. [Google Scholar]
- [10].Tadros AB, El-Nabey Polym. Mater. Sci. Eng. 1996;74:120. [Google Scholar]
- [11].Kimura M, Aizawa M. Eur. Pat. Appl. EP 802194 A2222 55. 1997 [Google Scholar]
- [12].Yu MYW, Sedlak J, Lindsay RH. Arch. Biochem. Biophys. 1973;155:111. doi: 10.1016/s0003-9861(73)80013-x. [DOI] [PubMed] [Google Scholar]
- [13].Napolitano A, Palumbo A, d’Ischia M, Prota G. J. Med. Chem. 1996;39:5192. doi: 10.1021/jm9605243. [DOI] [PubMed] [Google Scholar]
- [14].Skellern GG, Bates CD, Watson DG, Mairs RJ, Martin S. Pharm. Sci. 1995;1:451. [Google Scholar]
- [15].Singh BN, Singh U, Ghose R, Ghose AK. Asian J. Chem. 1993;5:262. [Google Scholar]
- [16].Masoud MS, El-Hamid OHA, Zaki ZM. Transition Met. Chem. 1994;19:21. [Google Scholar]
- [17].Sarma RL. J. Cryst. Growth. 1990;102:542. [Google Scholar]
- [18].Parkanyi C, Boniface C, Aron J-J, Gaye MD, Von Szentpaly L, Ghose R, Raghuveer KS. Struct. Chem. 1992;3:277. [Google Scholar]
- [19].Lapinski L, Rostkowska H, Nowak MJ, Kwiatkowski JS, Lesczczynski J. Vib. Spectrosc. 1996;13:23. [Google Scholar]
- [20].Gupta JK, Kumar S, Kumar S, Kaushik SD. Asian. J. Phys. 1996;5:245. [Google Scholar]
- [21].Les A, Adamowicz L. J. Am. Chem. Soc. 1990;112:1504. [Google Scholar]
- [22].Palafox MA, Rastogi VK, Tanwar RP, Mittal L. Spectrochim.Acta A. 2003;59:2473–2486. doi: 10.1016/s1386-1425(02)00409-2. [DOI] [PubMed] [Google Scholar]
- [23].Singh R, Jaiswal S, Kumar M, Singh P, Srivastav G, Yadav RA. Spectrochim.Acta A. 2010;75:267–276. doi: 10.1016/j.saa.2009.10.022. [DOI] [PubMed] [Google Scholar]
- [24].Giuliano BM, Feyer V, Prince KC, Coreno M, Evangelisti L, Melandri S, Caminati W. J. Phys. Chem. A. 2010;114:12725–12730. doi: 10.1021/jp106883s. [DOI] [PubMed] [Google Scholar]
- [25].Dolgounitcheva O, Zakrzewski VG, Ortiz JV. J. Chem. Phys. 2011;134:074305. doi: 10.1063/1.3555179. [DOI] [PubMed] [Google Scholar]
- [26].Allen WD, Czinki E, Császár AG. Chem. Eur. J. 2004;10:4512–4517. doi: 10.1002/chem.200400112. [DOI] [PubMed] [Google Scholar]
- [27].Jaeger HM, Schaefer HF, III, Demaison J, Császár AG, Allen WD. J. Chem. Theory Comput. 2010;6:3066–3078. doi: 10.1021/ct1000236. [DOI] [PubMed] [Google Scholar]
- [28].Puzzarini C, Barone V. Phys. Chem. Chem. Phys. 2011;13:7158. doi: 10.1039/c0cp02636k. [DOI] [PubMed] [Google Scholar]
- [29].Barone V, Biczysko M, Bloino J, Puzzarini C. Phys. Chem. Chem. Phys. 2013;15:1358–1363. doi: 10.1039/c2cp43884d. [DOI] [PubMed] [Google Scholar]
- [30].Barone V, Biczysko M, Bloino J, Puzzarini C. J. Chem. Theory Comput. 2013;9:1533–1547. doi: 10.1021/ct3010672. [DOI] [PubMed] [Google Scholar]
- [31].Barone V, Biczysko M, Bloino J, Puzzarini C. Phys. Chem. Chem. Phys. 2013 doi: 10.1039/c3cp50439e. DOI: 10.1039/C3CP50439E. [DOI] [PMC free article] [PubMed] [Google Scholar]
- [32].Biczysko M, Panek P, Scalmani G, Bloino J, Barone V. J. Chem. Theory Comp. 2010;6:2115. doi: 10.1021/ct100212p. [DOI] [PubMed] [Google Scholar]
- [33].Császár AG. Anharmonic molecular force fields. 2011. ( Wiley Interdisciplinary Reviews: Computational Molecular Science ). [Google Scholar]
- [34].Barone V, Baiardi A, Biczysko M, Bloino J, Cappelli C, Lipparini F. Phys. Chem. Chem. Phys. 2012;14:12404. doi: 10.1039/c2cp41006k. [DOI] [PubMed] [Google Scholar]
- [35].Raghavachari K, Trucks GW, Pople JA, Head-Gordon M. Chem. Phys. Lett. 1989;157:479. [Google Scholar]
- [36].Møller C, Plesset MS. Phys. Rev. 1934;46:618. [Google Scholar]
- [37].Alonso JL, Pérez C, Sanz ME, López JC, Blanco S. Phys. Chem. Chem. Phys. 2009;11:617–627. doi: 10.1039/b810940k. and references therein. [DOI] [PubMed] [Google Scholar]
- [38].Peña I, Sanz ME, López JC, Alonso JL. J. Am. Chem. Soc. 2012;134:2305–2312. doi: 10.1021/ja2101449. [DOI] [PubMed] [Google Scholar]
- [39].Cabezas C, Varela M, Peña I, Mata S, López JC, Alonso JL. Chem. Commun. 2012;48:5934–5936. doi: 10.1039/c2cc32109b. and references therein. [DOI] [PubMed] [Google Scholar]
- [40].Vaquero V, Sanz ME, López JC, Alonso JL. J. Phys. Chem. A. 2007;111:3443. doi: 10.1021/jp071642c. [DOI] [PubMed] [Google Scholar]
- [41].López JC, Peña I, Vaquero V, Sanz ME, Alonso JL. J. Chem. Phys. 2007;126:191103. doi: 10.1063/1.2735569. [DOI] [PubMed] [Google Scholar]
- [42].Alonso JL, Peña I, López JC, Vaquero V. Angew. Chem. Int. Ed. 2009;48:6141–6143. doi: 10.1002/anie.200901462. [DOI] [PubMed] [Google Scholar]
- [43].Alonso JL, Vaquero V, Peña I, López JC, Mata S, Caminati W. Angew. Chem. 2013;125:2387–2390. doi: 10.1002/anie.201207744. [DOI] [PubMed] [Google Scholar]
- [44].Cabezas C, Peña I, López JC, Alonso JL. J. Phys. Chem. Lett. 2013;4:486–490. doi: 10.1021/jz302135h. and references therein. [DOI] [PubMed] [Google Scholar]
- [45].Lozoya M, Cabezas C, Mata S, López JC, Alonso JL. oral communication MH13: LA-MB-FTMW Studies of Sugars; 66th International Symposium on Molecular Spectroscopy; Columbus, OH, USA. 2011. [Google Scholar]
- [46].Cabezas C, Alonso JL, López JC, Mata S. Angew.Chem. Int. Ed. 2012;51:1375–1378. doi: 10.1002/anie.201106621. [DOI] [PubMed] [Google Scholar]
- [47].Brown GG, Dian BC, Douglass KO, Geyer SM, Shipman ST, Pate BH. Rev. Sci. Instrum. 2008;79:053103. doi: 10.1063/1.2919120. [DOI] [PubMed] [Google Scholar]
- [48].Grabow J-U, Mata S, Alonso JL, Peña I, Blanco S, López JC, Cabezas C. Phys. Chem. Chem. Phys. 2011;13:21063. doi: 10.1039/c1cp22197c. [DOI] [PubMed] [Google Scholar]
- [49].Mata S, Peña I, Cabezas C, López JC, Alonso JL. J. Mol. Spectrosc. 2012;280:91–96. [Google Scholar]
- [50].Peña I, Daly AM, Cabezas C, Mata S, Bermúdez C, Niño A, López JC, Grabow J-U, Alonso JL. J. Phys. Chem. Lett. 2013;4:65–69. doi: 10.1021/jz301947g. [DOI] [PubMed] [Google Scholar]
- [51].Bermúdez C, Peña I, Cabezas C, Daly AM, Alonso JL. ChemPhysChem. 2013;14:893–895. doi: 10.1002/cphc.201300057. [DOI] [PubMed] [Google Scholar]
- [52]. Gordy W, Cook RL. In: Weissberger A. Microwave molecular spectra. 3rd ed. Wiley; New York: 1984. [Google Scholar]
- [53].Dunning TH., Jr. J. Chem. Phys. 1989;90:1007. [Google Scholar]
- [54].Kendall RA, Dunning TH, Jr., Harrison RJ. J. Chem. Phys. 1992;96:6796. [Google Scholar]
- [55].Woon DE, Dunning TH., Jr. J. Chem. Phys. 1995;103:4572. [Google Scholar]
- [56].Peterson KA, Dunning TH., Jr. J. Chem. Phys. 2002;117:10548. [Google Scholar]
- [57].CFOUR (Coupled Cluster techniques for Computational Chemistry), a quantum-chemical program package by ; Stanton JF, Gauss J, Harding ME, Szalay PG, Auer AA, Bartlett RJ, Benedikt U, Berger C, Bernholdt DE, Bomble YJ, Christiansen O, Heckert M, Heun O, Huber C, Jagau T-C, Jonsson D, Jusélius J, Klein K, Lauderdale WJ, Matthews D, Metzroth T, Mück LA, O’Neill DP, Price DR, Prochnow E, Puzzarini C, Ruud K, Schiffmann F, Schwalbach W, Stopkowicz S, Tajti A, Vázquez J, Wang F, Watts JD. ; and the integral packages MOLECULE ; Almlöf J, Taylor PR ; , PROPS ; Taylor PR ; , ABACUS ; Helgaker T, Jensen H. J. Aa., Jørgensen P, Olsen J. ; and ECP routines by ; Mitin AV, van Wüllen C. For the current version, see http://www.cfour.de.
- [58].Helgaker T, Klopper W, Koch H, Noga J. J. Chem. Phys. 1997;106:9639. [Google Scholar]
- [59].Puzzarini C. J. Phys. Chem. 2009;113A:14530. doi: 10.1021/jp9040327. [DOI] [PubMed] [Google Scholar]
- [60].Watson JKG. In: Vibrational Spectra and Structure. Durig JR, editor. Vol. 6. Elsevier; New York: 1977. [Google Scholar]
- [61].Aliev MR, Watson JKG. In: Molecular Spectroscopy: Modern Research. Rao KN, editor. III. Academic; New York: 1985. p. 1. [Google Scholar]
- [62].Mills IM. In: Molecular Spectroscopy: Modern Research. Rao KN, Mathews CW, editors. Academic; New York: 1972. [Google Scholar]
- [63].East ALL, Johnson CS, Allen WD. J. Chem. Phys. 1993;98:1299. [Google Scholar]
- [64].East ALL, Allen WD, Klippenstein SJ. J. Chem Phys. 1995;102:8506. [Google Scholar]
- [65].Barone V. J. Chem. Phys. 2005;122:014108. doi: 10.1063/1.1824881. [DOI] [PubMed] [Google Scholar]
- [66]. [accessed February 1, 2013];Double and triple-ζ basis sets of sns and n07 families, are available for download. 2012 visit http://dreamslab.sns.it.
- [67].Frisch MJ, Trucks GW, Schlegel HB, Scuseria GE, Robb MA, Cheeseman JR, Scalmani G, Barone V, Mennucci B, Petersson GA, Nakatsuji H, Cari- cato M, Li X, Hratchian HP, Izmaylov AF, Bloino J, Zheng G, Sonnenberg JL, Liang W, Hada M, Ehara M, Toyota K, Fukuda R, Hasegawa J, Ishida M, Nakajima T, Honda Y, Kitao O, Nakai H, Vreven T, Montgomery JA, Jr., Peralta JE, Ogliaro F, Bearpark M, Heyd JJ, Brothers E, Kudin KN, Staroverov VN, Keith T, Kobayashi R, Normand J, Raghavachari K, Rendell A, Burant JC, Iyen- gar SS, Tomasi J, Cossi M, Rega N, Millam JM, Klene M, Knox JE, Cross JB, Bakken V, Adamo C, Jaramillo J, Gomperts R, Stratmann RE, Yazyev O, Austin AJ, Cammi R, Pomelli C, Ochterski JW, Martin RL, Morokuma K, Zakrzewski VG, Voth GA, Salvador P, Dannenberg JJ, Dapprich S, Parandekar PV, Mayhall NJ, Daniels AD, Farkas O, Foresman JB, Ortiz JV, Cioslowski J, Fox DJ. Gaussian development version, Revision H.13. Gaussian, Inc.; Wallingford, CT: 2010. [Google Scholar]
- [68].Gauss J, Stanton J. Chem. Phys. Lett. 1997;276:70. [Google Scholar]
- [69].Pyykkö P. Mol. Phys. 2008;106:1965. [Google Scholar]
- [70].Halkier A, Klopper W, Helgaker T, Jørgensen P. J. Chem. Phys. 1999;111:4424. [Google Scholar]
- [71].Pickett HM. J. Mol. Spectrosc. 1991;148:371. [Google Scholar]
- [72].Foley HM. Phys. Rev. 1947;71:747. [Google Scholar]
- [73].Puzzarini C. Theor. Chem. Acc. 2008;121:1. [Google Scholar]
- [74].Cazzoli G, Puzzarini C, Stopkowicz S. J. Gauss, Mol. Phys. 2008;106:1181. [Google Scholar]
- [75].Cazzoli G, Dore L, Puzzarini C, Gauss J. Mol. Phys. 2010;108:2335. [Google Scholar]
- [76].Cazzoli G, Puzzarini C, Stopkowicz S. J. Gauss, Chem. Phys. Lett. 2011;502:42. [Google Scholar]
- [77].Puzzarini C, Cazzoli G, Harding ME, Vázquez J, Gauss J. J. Chem. Phys. 2009;131:234304. doi: 10.1063/1.3274062. [DOI] [PubMed] [Google Scholar]
- [78].Helgaker T, Jørgensen P, Olsen J. Molecular Electronic-structure Theory. Wiley; Chichester: 2000. [Google Scholar]
- [79].Helgaker T, Gauss J, Jørgensen P, Olsen J. J. Chem. Phys. 1997;106:6430. [Google Scholar]
- [80].Demaison J. Mol. Phys. 2007;105:3109. [Google Scholar]
- [81].Puzzarini C, Stanton JF, Gauss J. Int. Rev. Phys. Chem. 2010;29:273. [Google Scholar]
- [82].Pulay P, Meyer W, Boggs JE. J. Chem. Phys. 1978;68:5077. [Google Scholar]
- [83].Pawłowski F, Jørgensen P, Olsen J, Hegelund F, Helgaker T, Gauss J, Bak KL, Stanton JF. J. Chem. Phys. 2002;116:6482. [Google Scholar]
- [84].Bloino J, Biczysko M, Barone V. J. Chem. Theory Comp. 2012;8:1015. doi: 10.1021/ct200814m. [DOI] [PubMed] [Google Scholar]
Associated Data
This section collects any data citations, data availability statements, or supplementary materials included in this article.