Figure 7.
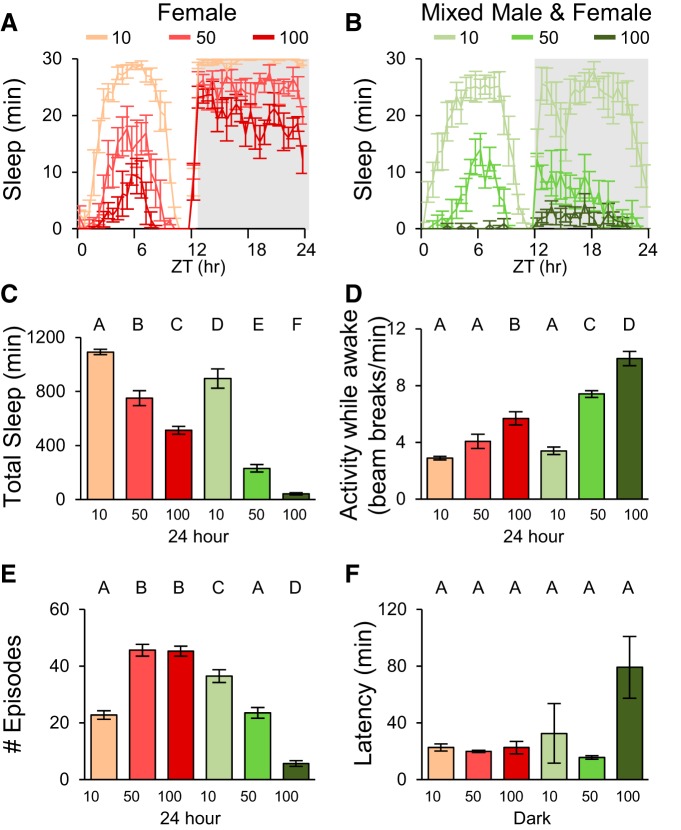
Sleep is affected by population size and social behavior. A, Sleep profiles for female populations of different sizes. B, Sleep profiles for populations of males and females (1:1 ratio of sexes). C, Quantification of total sleep. Total sleep was decreased significantly with increasing number of flies and mixed populations with the same number of total flies exhibit lower sleep than populations of female flies. D, Activity while awake. Increasing the number of flies increases population activity. E, Number of sleep episodes. The number of episodes scales with population size in opposite directions for female only and mixed populations. F, Sleep latency does not change significantly with population size. n = 5–6 groups for all conditions. ZT, Zeitgeber time.

