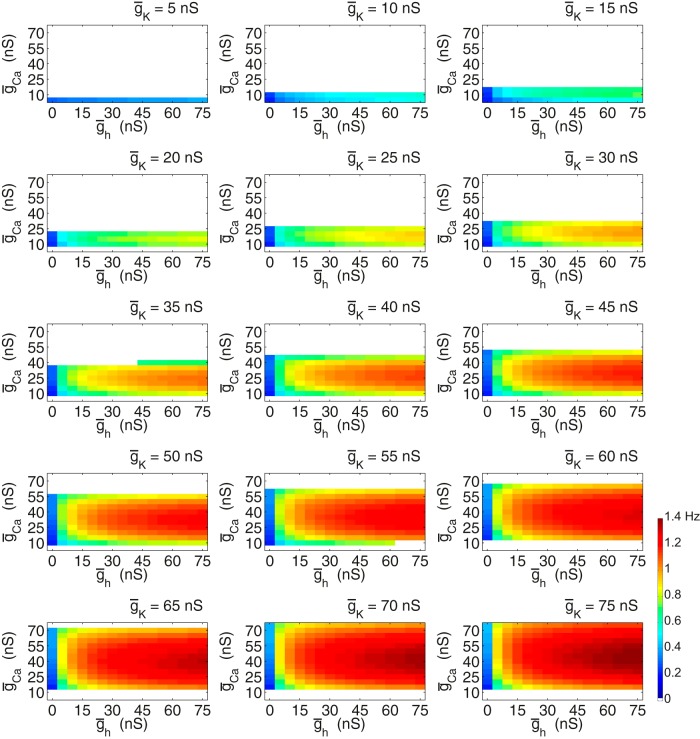
Figure 2.
Morris−Lecar neuron with h-conductance database frequencies. This series of panels show the oscillation frequencies of the individual neurons in the database with intrinsic ionic conductances corresponding to the titles and axes. Neuron potassium conductance increases from the top left to bottom right panels. Maximal calcium conductance is on the y-axis and maximal h-conductance is on the x-axis. The color bar in the bottom right corner conveys the frequency color coding that applies for all plots in this figure. White spaces indicate neurons that are silent, non-oscillatory, or do not cross threshold. All neurons have a ḡleak of 0.1 nS.

