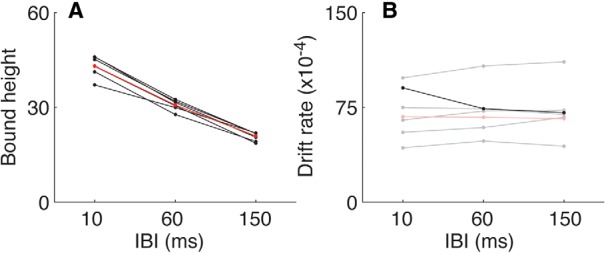
Figure 5.

Parameter values from fits of the basic DDM to the RT-task data. Each panel shows best-fitting values of bound height (A) or drift rate (B) plotted as a function of IBI for fits to data from individual subjects (black) or combined across all subjects (red). Dark lines/symbols indicate that the model fits were improved significantly by fitting the given parameter separately for each IBI condition (likelihood-ratio test, p < 0.01, Bonferroni-corrected for three parameters).
