

Abstract
Background
Combining anti-angiogenesis agents with cytotoxic agents for the treatment of malignant gliomas, may affect the cytotoxic drug distribution by normalizing the blood brain-barrier (BBB). This study examines the intratumoral concentration of temozolomide (TMZ) in the presence and absence of the pan-VEGF receptor tyrosine kinase inhibitor, cediranib.
Methods
Seven nude rats bearing U87 intracerebral gliomas had a microdialysis probe centered within the tumor. Ten-days after tumor implantation TMZ(50mg/kg) was given orally. The extracellular fluid (ECF) concentrations of TMZ within the tumor were assessed via microdialysis for six hours following TMZ administration. Cediranib(6 mg/kg) was then given orally, and 12 hours later, TMZ was re-administered with subsequent microdialysis collection. A subset of animals also underwent functional MRI to assess angiogenesis in vivo at post-inoculation days 12 and 21, before and after the cediranib treatment.
Results
After dosing of oral TMZ only, ECF-TMZ mean-Cmax and area under the concentration curve(AUC0-∞) within the tumor were 0.59μg/mL and 1.82μg·hr/mL, respectively. Post-cediranib, ECF-TMZ mean-Cmax and AUC0-∞ were 0.83μg/mL and 3.72±0.61μg·hr/mL within the tumor, respectively. This represented a 1.4-fold (p=0.3) and 2.0-fold (p=0.06) increase in the ECF-TMZCmax and AUC0-∞, respectively, after cediranib administration. In vivo MRI measurements of the various vascular parameters were consistent with a BBB ‘normalization’ profile following cediranib treatment.
Conclusions
In the U87 intracerebral glioma model, within the first day of administration of cediranib, the intratumoral concentrations of TMZ in tumor ECF were slightly, but not statistically significantly, increased when compared to treatment of TMZ alone with radiographic evidence of a normalized BBB.
Keywords: microdialysis, glioma, angiogenesis, temozolomide, cediranib, vascular normalization
Introduction
Advances in glioma therapy have resulted in improved median survival among patients with glioblastoma multiforme (GBM) from 9 to 20 months.[2, 17, 22] However, after four decades of research only three agents have been approved for treatment of GBM; orally delivered temozolomide (TMZ), locally delivered polifeprosan 20 with carmustine implanted most recently, bevacizumab (Avastin®).
Bevacizumab was the first anti-angiogenic drug approved by the FDA for the treatment of recurrent GBM.[7, 13] Bevacizumab is an intravenous monocloncal antibody against vascular endothelial growth factor (VEGF)-A. Cediranib, (AZD2171, AstraZeneca), in contrast, is an oral tyrosine kinase inhibitor that simultaneously targets the intracellular domain of all three VEGF receptor tyrosine kinases, c-Kit and platelet derived growth factor receptor alpha and beta (PDGFR-α and PDGFR-β). It is an indole-ether quinazoline with a molecular weight of 450.5 that has demonstrated potent ATP-competitive inhibition of VEGF signaling predominantly through inhibition of the tyrosine kinase of VEGFR-2/Flk-1/KDR.[23] When administered once daily, cediranib has been shown to normalize tumor vessels in patients with recurrent GBM starting as early as one day after the treatment and lasting at least 28 days.[3]
Recent phase II clinical studies tested cediranib monotherapy for recurrent GBM patients and demonstrated increased progression-free survival (PFS) with steroid sparing effects and reduction of tumor associated vasogenic edema.[3] Advanced MRI revealed that in the setting of cediranib there was decreased contrast enhancement, reduction in average blood vessel size, vascular permeability and decrease in blood flow and volume collectively suggesting a vascular normalizing effect.[3], [9]
Combining angiogenesis inhibitors with chemotherapy in GBMs may allow improved delivery of drug to tumor due to the decreased interstitial fluid pressure and improved perfusion secondary to the phenomenon of vascular “normalization.”[3, 21] A competing hypothesis is that anti-angiogenic therapies may impair delivery of cytotoxic drugs to brain tumors by reducing the BBB permeability often associated with gliomas. It is difficult to empirically predict how anti-angiogenesis drugs will affect the brain concentration of concomitantly administered chemotherapeutic agents. Prior pre-clinical studies with TMZ and anti-angiogenic therapy suggest that intratumoral concentrations of the chemotherapeutic agent can be affected either positively or negatively.[15, 16], [9] Thus, it is crucial to investigate the pharmacokinetic (PK) relationship between anti-angiogenic agents and TMZ to determine how such combinations can be used most effectively in patients. [9]
In this study, we determined the brain extracellular fluid (ECF) concentration of TMZ when TMZ is administered with and without cediranib. We employed microdialysis techniques to assess intratumoral PK using the intracranial U87 human glioma model in athymic rats. We also utilized functional MRI to assess in vivo changes in the tumor vasculature following cediranib administration.
Materials and Methods
Materials
Temodar (Schering Corporation, a subsidiary of Merck & Co., Inc. NJ, USA) was commercially purchased from the Johns Hopkins Hospital pharmacy. Cediranib (Selleck Chemicals, Houston, TX) was purchased from Selleck Chemicals. CMA12 microdialysis brain probes (membrane length 2mm, shaft diameter 0.6mm, shaft length 14mm, membrane diameter 0.5mm, polyarylethersulfone (PAES) membrane), CMA 120 bowl system for freely moving animals, CMA 402 Syringe Pump, microsyringes 10mL glass with piston stroke 60 mm were commercially purchased from CMA (CMA Microdialysis Inc. MA, USA). The study was approved by the Johns Hopkins Animal Care and Use Committee (ACUC), and all procedures were conducted in compliance with their regulations.
Cell Culture
The U87 human glioma cell line (from Dr. Laterra, Johns Hopkins University, Baltimore, MD[12]) was grown in MEM with Earle Salts and L-glutamine (MEM 1*Mediatech, Inc.) supplemented with 10% fetal bovine serum (Gemini Bioproducts, Inc.), 2mMol/L sodium pyruvate (Mediatech, Inc.), 0.1mmol/L MEM-nonessential amino acids (Mediatech, Inc.), and penicillin-sterptomycin (Mediatech, Inc.). The cells were grown at 37°C in a humidified incubator with 5% CO2.
Implantation of tumor cells and microdialysis probes
Seven male, athymic rats, 200-300g each were anesthetized by intraperitoneally administering 0.6-0.8ml of a ketamine (15mg) and xyalzine (1.5mg) cocktail. Animals were secured in a stereotactic apparatus and their scalp were shaved and cleaned. A midline incision was made, the skull was exposed and 2mm hole was drilled 2mm left and 2mm posterior to the bregma. After placing the guide cannula with the dummy catheter and securing by using dental cement (Geristore Syringeable value kit A2, Denmat, Santa-Maria, CA,) in a depth of 4mm from the skull, 2×10⁶ U87 cells were inoculated with a 26-gauge needle attached to the stereotactic frame, at a depth of 5mm into the left striatum as described previously [9]. At the end of the inoculation process the needle was slowly removed from the brain and the skin was clipped with staples. The rats then were returned to cages and received standard rat diet and water ad libitum. Animals were monitored daily for new neurological symptoms and body weight.
Microdialysis methodology and ECF sample collection
Eleven days after intracranial tumor inoculation the 2mm CMA12 microdialysis catheter was inserted in the place of the dummy catheter. The intracerebral microdialysis catheter was perfused in a rate of 1 μL/min with Lactated Ringer's using a CMA microsyringe pump for one hour before the administration of TMZ. TMZ (50mg/kg, dissolved in water) was given orally and for the next six hours brain ECF dialysate was collected every hour. After six hours of dialysate collection, in vivo dialysate recovery was performed. At the end of the first collection day, the microdialysis catheter was stored in lactated Ringer's, and the dummy catheter was re-inserted into the cannula instead.
A single dose of 6mg/kg cediranib dissolved in 1% Tween was administered by oral gavage[11]. The rats were returned to their cages with ad libitum diet, water, and activity. Twelve hours after the cediranib dosing, rats were anesthetized again with ketamine and xylazine. After replacing the dummy catheter with intracerebral microdialysis catheters, the system was perfused in a rate of 1 μL/min with Lactated Ringer's for one hour before the administration of TMZ. TMZ (50mg/kg, dissolved in water) was again given by oral gavage and brain ECF dialysate was collected every hour for the next 6 hours. In vivo dialysate recovery experiments were done again at the conclusion of collection. All ECF dialysate samples were stored in -80°C until analyzed for drug concentrations using liquid chromatography-tandem mass spectrometry (LC/MS/MS) as described previously [9].
In vivo assessment of probe recovery
Estimation of in vivo recovery was done at the end of each collection period (pre- and post-cediranib). Using the retrodialysis method, the probes were perfused with Lactated Ringer's solution containing TMZ at a rate of 1 μL/min to determine the in vivo probe recovery [24]. The percentage relative recovery calculated as follows [5, 14].
Where Cperfusate is the drug concentration (2 μg/mL) in the perfusate, and Cdialysate is the drug concentration in the microdialysate. For one animal (animal 6) where samples were not obtained, the average in vivo recovery for the other animals was used for further calculations. The recovery was utilized to estimate the ECF concentration of TMZ [5, 14].
Pharmacokinetic analysis
Pharmacokinetic (PK) parameters were calculated for raw and estimated ECF values by standard non-compartmental analysis using WinNonlin version 5.3 (Pharsight Corporation, Mountain View, CA) [8]. The observed maximum plasma concentration (Cmax) of TMZ and the time of Cmax after oral administration (Tmax) were recorded. The area under the plasma concentration-time curve (AUC) was calculated using the log-linear trapezoidal rule and extrapolated to infinity (AUC0-∞) by dividing the last quantifiable concentration by the terminal disposition rate constant (λz). The λz was determined from the slope of the terminal phase of the concentration-time profile and utilized to calculate the half-life (T1/2) by dividing 0.693 by λz.
In vivo MRI
Tumor-bearing mice brains were imaged in vivo on a 9.4T vertical bore MRI scanner. Four micewere scanned at twelve days post-inoculation (i.e. D12) of the U87 glioma cell line (two controls and two treated with cediranib once daily till the animals were sacrificed) and another four at three weeks post-inoculation (i.e. D21) (three controls and one treated with cediranib). All mice were scanned using the following sequences and parameters: (i) T2*-weighted multi-echo gradient echo (GE), echo time (TE) = 4.0/8.0/12.0/16.0 ms, repetition time (TR) = 400 ms, number of averages (NEX) = 12; (ii) T2-weighted multi-echo spin echo (SE), TE = 11.3/22.6/33.9/45.2/56.5/67.8 ms, TR = 2000 ms, NEX = 4. Sixteen coronal slices 1-mm thick and covering the extent of the entire brain were acquired with an in-plane resolution of 0.1 mm × 0.1 mm. GE and SE images were acquired before and after i.v. administration of the super paramagnetic iron oxide (SPIO) agent Feridex at a dose of 25 mg Fe/kg bodyweight. The difference in magnetic susceptibility between SPIO-containing blood vessels and the surrounding tissue increases the transverse relaxation rates R2* (1/T2*) and R2 (1/T2) of the MRI signal. The SPIO-induced changes in relaxation rates (ΔR2* and ΔR2) provide information on the underlying vascular morphology: ΔR2* is proportional to total blood volume, ΔR2 is proportional to microvascular blood volume, and (ΔR2*/ΔR2)3/2 is proportional to average blood vessel size[18]. Using the Analysis of Functional NeuroImages (AFNI) software package, voxel-wise pre- and post-contrast R2* and R2 maps were calculated by fitting the GE and SE signal intensity vs. TE curves to the following mono-exponential plus constant noise model:
Maps were then calculated by subtracting pre-contrast ΔR2(*) from post-contrast ΔR2(*). Tumor regions of interest (ROI) were manually drawn, and contralateral ROIs were determined by reflecting the tumor ROIs across the brain midlines. The histogram distributions of the total/microvascular blood volume and vessel size parameters in the tumor and contralateral ROIs were compared.
Statistical analysis
Wilcoxon matched pairs signed-rank test was used to determine the difference between the PK parameters before and after cediranib dosing by using JMP Statistical Discovery Software version 7.0.1 (SAS Institute, Cary, NC). A P<0.05 was considered significant.
Results
Pharmacokinetic Measurements of TMZ in brain ECF
The mean corrected TMZ ECF Cmax on the tumor side, following the first dose of TMZ but before cediranib was administered was 0.59+0.22 μg/mL (mean ± SD) which occurred at a median time of 1.50 hours, and area under the concentration curve (AUC0-∞) was 1.82±0.64 μg·hr/mL. After the administration of cediranib, there was a 1.4-fold and 2.0-fold increase in the Cmax and AUC0-∞, respectively. Specifically, the mean corrected TMZ ECF Cmax on the tumor side after cediranib was dosed was 0.83±0.45 μg/mL (p-value=0.22 for raw data, and p-value=0.30 for corrected data), which occurred at a median time of 1.50 hours, and AUC0-∞ was 3.72±0.61 μg·hr/mL (p-value=0.06 for raw and for corrected data). The half-life was slightly prolonged after cediranib administration (1.7±0.3 hr pre-cediranib vs. 2.0±0.9 hr post-cediranib, p>0.05). Although there was a suggestion of higher concentrations of TMZ in tumor after cediranib, none of the measures reached statistical significance (Table 1 and Figure 1).
Table 1. Summary of TMZ pharmacokinetics in brain ECF in tumor site.
| Pre-cediranib | Post-cediranib | |||||||||
|---|---|---|---|---|---|---|---|---|---|---|
|
|
|
|||||||||
| Recovery (%) | Tmax (h) | Cmax (μg/mL) | AUC0–∞ (μg*h/mL) | T1/2 (h) | Recovery (%) | Tmax (h) | Cmax (μg/mL) | AUC0–∞ (μg*h/mL) | T1/2 (h) | |
| Raw data | ||||||||||
| 2 | 85.9 | 1.50 | 0.40 | 1.49 | 1.8 | 80.2 | 0.50 | 1.29 | 3.21 | 1.1 |
| 3 | 76.6 | 0.50 | 0.47 | 1.82 | 1.9 | 78.8 | 0.50 | 0.51 | 2.46 | 1.5 |
| 4 | 53.1 | 2.50 | 0.10 | 0.32 | 1.4 | 41.0 | 2.50 | 0.13 | N.R.b | N.R.c |
| 6 | 70.8a | 1.50 | 0.51 | 1.75 | 1.6 | 70.8a | 1.50 | 0.91 | 3.20 | 1.7 |
| 8 | 73.8 | 0.50 | 0.51 | 1.11 | 2.2 | 76.1 | 1.50 | 0.48 | 2.95 | 3.4 |
| 9 | 59.8 | 0.50 | 0.54 | 1.18 | 1.5 | 62.6 | 1.50 | 0.41 | N.R.b | N.R.c |
| 10 | 70.7 | 1.50 | 0.38 | 1.48 | 1.7 | 76.4 | 3.50 | 0.49 | 2.37 | 2.0 |
| Summary | 70.1 ± 10.8 | 1.50 | 0.41 ± 0.15 | 1.31 ± 0.51 | 1.7 ± 0.3 | 69.4 ± 13.9 | 1.50 | 0.60 ± 0.38 | 2.84 ± 0.40 | 2.0 ± 0.9 |
| Statisticsd | (15) | (0.50, 2.50) | (37) | (39) | (16) | (20) | (0.50, 3.50) | (63) | (14) | (44) |
| Corrected for recovery | ||||||||||
| 2 | 1.50 | 0.46 | 1.73 | l.8 | 0.50 | 1.61 | 4.00 | 1.4 | ||
| 3 | 0.50 | 0.62 | 2.38 | 1.9 | 0.50 | 0.65 | 3.12 | 1.5 | ||
| 4 | 2.50 | 0.19 | 0.60 | 1.4 | 2.50 | 0.31 | N.R.b | N.R.c | ||
| 6 | 1.50 | 0.71 | 2.48 | 1.6 | 1.50 | 1.29 | 4.52 | 1.7 | ||
| 8 | 0.50 | 0.69 | 1.50 | 2.2 | 1.50 | 0.64 | 3.87 | 3.4 | ||
| 9 | 0.50 | 0.90 | 1.97 | 1.5 | 1.50 | 0.69 | N.R.b | N.R.c | ||
| 10 | 1.50 | 0.53 | 2.09 | 1.7 | 3.50 | 0.64 | 3.10 | 2.0 | ||
| Summary | 1.50 | 0.59 ± 0.22 | 1.82 ± 0.64 | 1.7 ± 0.3 | 1.50 | 0.83 ± 0.45 | 3.72 ± 0.61 | 2.0 ± 0.9 | ||
| Statisticsd | (0.50, 2.50) | (38) | (35) | (16) | (0.50, 3.50) | (54) | (16) | (44) | ||
AUC0–∞, area under the concentration–time curve extrapolated to infinity; Cmax, maximum concentration; % C.V., percent coefficient of variation; Min, minimum; Max, maximum; SD, standard deviation; T1/2 half-life; Tmax, time to maximum concentration
No retrodialysis samples were collected. The average recovery over all conditions is found to be 70.8 %
Not reported due to >50 % extrapolation of the AUC due to poor terminal disposition rate constant (λz)
Not reported due the terminal disposition rate constant (λz) r2 < 0.90
Median (Min, Max) is reported for Tmax and mean ± S.D. (% C.V.) for all other parameters
Fig. 1.

Concentrations of TMZ in brain ECF obtained by microdialysis in the tumor site. The open symbols represent the pre-cedarinib TMZ concentrations while closed symbols are post-cedarinib TMZ concentrations. Symbols, mean; bars, SD
In vivo MRI changes in the tumor vasculature after treatment with cediranib
Representative in vivo MRI maps of ΔR2* (i.e. total blood volume), ΔR2 (i.e. microvascular blood volume), and (ΔR2*/ΔR2)3/2 (i.e. average vessel size) for tumor and contralateral ROIs are shown in Figure 2. Both the total (ΔR2*) and microvascular and (ΔR2) blood volume of the control tumor was comparable to that of the contralateral ROI at D12, but were markedly elevated at D21. In contrast, treated tumors exhibited lower blood volumes at both time points. The average vessel size for both tumor and contralateral ROIs were similar in the D12 control, but the vessel size in the treated D12 tumor was lower compared to the contralateral ROI. A similar effect on vessel size was not apparent at the later time point. Additionally, pooled histograms of ΔR2*, ΔR2, and (ΔR2*/ΔR2)3/2 from tumor and contralateral ROIs (Figure 3) show that for the D12 control group, the tumor and contralateral distributions were similar for all three in vivo MRI vascular parameters (Figure 3a-c), while for the D12 treated group, the distributions for all three parameters were shifted toward lower values (Figure 3d-f). In contrast, ΔR2* and ΔR2 were elevated in the control D21 tumors compared to the contralateral ROIs (Figure 3g-h). The treated D21 tumor exhibited ΔR2* and ΔR2 distributions that were shifted toward the lower contralateral values (Figure 3j-k). Both control and treated D21 tumors exhibited (ΔR2*/ΔR2)3/2 distributions similar to the contralateral ROIs.
Fig. 2.
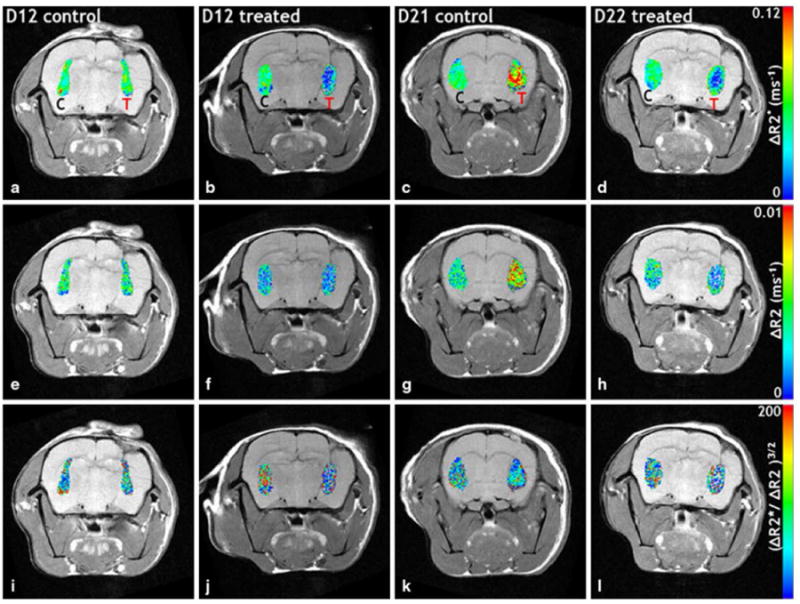
In vivo MRI coronal slices of tumor-bearing rat brains. a–d (total blood volume), e–h ΔR2 (microvascular blood volume), and (i–l) (vessel size) maps of tumor (T) and contralateral (C) ROIs are overlaid on T2 w spin echo images. The total (a) and microvascular (e) blood volume for the control tumor is comparable to that of the contralateral ROI at D12, but is markedly elevated at D21 (c, g). Treated tumors exhibit decreased blood volumes at both time points. The tumor and contralateral vessel sizes were similar in the D12 control (i), but the vessel size in the treated D12 tumor was decreased (j) compared to the contralateral ROI. A similar effect on vessel size was not apparent at the later time point (l)
Fig. 3.

Pooled distributions of the total blood volume (i.e. ), microvascular blood volume (i.e. ΔR2), and average blood vessel size (i.e. ) from tumor (red) and contralateral (blue) ROIs for the D12 (a–f) and D21 (g–l) groups, respectively. For the D12 control (D12 CTRL) group, the tumor and contralateral distributions were similar to all three in vivo MRI vascular parameters. However, for the D12-treated (D12 Tx) group, the distributions for all three in vivo MRI vascular parameters exhibited a shift toward lower values. In contrast, and ΔR2 were elevated in the control D21 (D21 CTRL) tumors compared to the contralateral ROIs. The treated D21 (D21 Tx) tumor also exhibited and ΔR2 distributions that were shifted toward the lower contralateral values. Both, control and treated D12 tumors had distributions similar to the contralateral ROIs. Collectively, these in vivo measurements of the different vascular parameters are consistent with ‘normalization’ of the tumor vasculature following cediranib treatment
Discussion
This study assessed whether concurrent therapy of an oral anti-angiogenesis tyrosine kinase inhibitor given with a cytotoxic drug has a synergistic or opposing effect by investigating the intratumoral concentration of TMZ via microdialysis catheters before and after cediranib treatment in a U87 xenograft intracranial glioma model. Previously microdialysis studies suggest variable effects when combining anti-angiogenesis agents with cytotoxic drugs. A multi-targeted receptor tyrosine kinase inhibitor, sunitinib, showed a synergistic effect when combined with TMZ in an intracerebral glioma model in the mouse.[15] However, 50% reduction of TMZ was reported in tumor concentrations when administered it with the angiogenesis inhibitor TNP-470 in a similar murine model.[16] Utilizing the intratumoral microdialysisintheU87 intracerebral glioma model, no significant change in ECF concentration of TMZ was observed before or 36 hours after bevacizumab dosing.[9]
Several pre-clinical and clinical studies have suggested that normalization of tumor vessels induced by cediranib may have a time limited window of normalization that may be optimal for combination therapy with cytotoxic drugs.[3, 11, 21] Cediranib in combination with lomustine was tested in 325 patients with recurrent GBM in a randomized, multicenter Phase III study. There was no significant difference in progression PFS between cediranib monotherapy versus cediranib and lomustine.[1] In the current study, the intratumoral concentrations of TMZ in tumor ECF showed a trend toward being elevated one day after cediranib was administered, with PK results showing 2 and 1.4 folds increase in the intratumoral AUC0-∞ and Cmax of TMZ in U87 xenograft tissue. However, this increase was not statistically significant, most likely due to the limited sample size of the current study and the variability of PK parameters inter-animal. Another possible explanation may be the timing of the microdialysis measurement related to the cediranib dosing. It has been suggested that the tumor vessels normalization phenomena may start a day after cediranib administration and continues for 28 days.[3, 9] Therefore, it may be possible that the microdialysis measurements in this study were started too early to capture the maximal effect.
Microdialysis has potential advantages for pharmacokinetic studies since it allows for estimation of drug exposure at the site of action over a given period of time.[4, 20, 24] However, this technique has several limitations discussed previously.[9] While microdialysis probe insertion in rodent models increases BBB permeability after 3-4 days[23], this effect normalizes over time. Therefore, in order to minimize the affect of possible BBB disruption, we started drug collection from the ECF 11 days after catheter placement.
In order to measure the relative loss of the analyte diffusing from the perfusate into the ECF, and make a valid comparison between the data obtained from microdialysis from different time points, the relative recovery was determined. There are several methods to assess relative recovery.[24] Since in vitro recovery tends to overestimate the in vivo recovery values [10], in vivo recovery was assessed at the end of each microdialysis day. Our in vivo recovery values ranged between 69.4±13.9% to 70.1±10.8%, which were relatively high compared to previously published microdialysis studies, suggesting the catheters were patent for the duration of the study.[10], [9]
Due to its sensitivity to the underlying vasculature, susceptibility-contrast based MRI is increasingly used in order to characterize the efficacy of various anti-angiogenesis agents.[19] Evaluation of tumor imaging parameters one day after cediranib dosing was predictive with survival in patients with recurrent GBM.[21] In the current study, histogram analyses of the in vivo functional MRI data from the current study indicate that for the D12 control group, the tumor and contralateral distributions were similar for all three in vivo angiogenic parameters (i.e., total blood volume, microvascular blood volume and vessel size) while for the D12 treated group, the distributions for all three parameters were shifted toward lower values. The treated D21 tumor also exhibited ΔR2* and ΔR2 distributions that were shifted toward the lower contralateral values. Collectively, these in vivo MRI total and microvascular blood volume data are consistent with our understanding of vascular normalization immediately following treatment with cediranib. Namely, following cediranib treatment the blood volume of the tumor vessels approaches that of the contralateral brain. In contrast, both control and treated D21 tumors exhibited vessel size distributions similar to the contralateral brain, indicating that different vessel populations may have been influenced by cediranib. Recently, Farrar et al.[6] assessed the response of a mouse intracranial glioma model to cediranib treatment using similar in vivo MRI biomarkers and made a similar observation showing decreased in cerebral blood volume and microvascular blood volume post-treatment.
This study has several limitations. The study is based on relatively small number of animals. This is almost uniformly inherited to all microdialysis studies that are considered “animal sparing” technique. Moreover, we investigated the effect of single dose of cediranib on intratumoral temozolomide concentration only within one day after cediranib was administered. We do not know how long the time frame of the “normalization window” last. We based the cediranib dose and timing of our measurement on previously works quoted that the window of normalization following cediranib administration is started within one day after single dosing of cediranib [21]. This animal model used in this study has several limitations. The single animal model used was intracranial U87 xenograft model that does not have the necrotic core characterize the human GBM, and it's invasion pattern is not prominent compare to other human glioma cell lines. Still this model is predictable, has reproducible growth patterns and has high expression of VEGF and profound angiogenesis allowed us to investigate the effect of anti-angiogenesis agent, cediranib, on the intratumoral concentration of TMZ. In order to assess the exact location of the microdialysis probe in the tumor, we performed H&E staining for all the rats brain and make sure that in all the animals the probes were located in the center of the tumor.
Our study provides PK data that shows that TMZ intratumoral concentrations do not decline in the setting of the oral tyrosine kinase inhibitor cediranib, despite it's pan-antiangiogenesis effects and visualized normalization of the BBB. In fact, there is a suggestion that TMZ concentrations increased slightly after cediranib dosing in a U87 glioma xenograft model, however, there was a great deal of variability between animals making this not clinically significant. Overall, these findings suggest that with an agent such as TMZ that is known to cross the BBB relatively well, cediranib does not limit intratumoral concentration of TMZ when they are given concurrently.
Acknowledgments
We would like to thank John Laterra, M.D., BachchuLal, Ph.D., Ming Zhao, Ph.D., Ping He, and Teresia Wanjiku, MHS, for their technical support.
Grant Support: This work was supported by the American Physicians Fellowship (APF) for Medicine in Israel (Rachel Grossman), the American Cancer Society Research Scholar Grant (RSG-08-119-01-CCE), and by the Analytical Pharmacology Core of the Sidney Kimmel Comprehensive Cancer Center at Johns Hopkins (NIH grants P30 CA006973 and UL1 RR025005) and the Shared Instrument Grant (1S10RR026824-01). The work was also supported by the generosity of Peter and Ali Jennison. The project described was supported by Grant Number UL1 RR 025005 from the National Center for Research Resources (NCRR), a component of the National Institutes of Health (NIH) and NIH Roadmap for Medical Research, and its contents are solely the responsibility of the authors and do not necessarily represent the official view of NCRR or NIH.
Footnotes
Disclosure Statement: The authors have no conflicts of interest and No Disclosures.
References
- 1.Ahluwalia MS. 2010 Society for Neuro-Oncology Annual Meeting: a report of selected studies. Expert Rev Anticancer Ther. 2011;11:161–3. doi: 10.1586/era.10.227. [DOI] [PubMed] [Google Scholar]
- 2.Attenello FJ, Mukherjee D, Datoo G, McGirt MJ, Bohan E, Weingart JD, Olivi A, Quinones-Hinojosa A, Brem H. Use of Gliadel (BCNU) wafer in the surgical treatment of malignant glioma: a 10-year institutional experience. Ann Surg Oncol. 2008;15:2887–93. doi: 10.1245/s10434-008-0048-2. [DOI] [PubMed] [Google Scholar]
- 3.Batchelor TT, Sorensen AG, di Tomaso E, Zhang WT, Duda DG, Cohen KS, Kozak KR, Cahill DP, Chen PJ, Zhu M, Ancukiewicz M, Mrugala MM, Plotkin S, Drappatz J, Louis DN, Ivy P, Scadden DT, Benner T, Loeffler JS, Wen PY, Jain RK. AZD2171, a pan-VEGF receptor tyrosine kinase inhibitor, normalizes tumor vasculature and alleviates edema in glioblastoma patients. Cancer Cell. 2007;11:83–95. doi: 10.1016/j.ccr.2006.11.021. [DOI] [PMC free article] [PubMed] [Google Scholar]
- 4.Blakeley JO, Olson J, Grossman SA, He X, Weingart J, Supko JG New Approaches to Brain Tumor Therapy C. Effect of blood brain barrier permeability in recurrent high grade gliomas on the intratumoral pharmacokinetics of methotrexate: a microdialysis study. J Neurooncol. 2009;91:51–8. doi: 10.1007/s11060-008-9678-2. [DOI] [PMC free article] [PubMed] [Google Scholar]
- 5.Bungay PM, Morrison PF, Dedrick RL. Steady-state theory for quantitative microdialysis of solutes and water in vivo and in vitro. Life Sci. 1990;46:105–19. doi: 10.1016/0024-3205(90)90043-q. [DOI] [PubMed] [Google Scholar]
- 6.Farrar CT, Kamoun WS, Ley CD, Kim YR, Catana C, Kwon SJ, Rosen BR, Jain RK, Sorensen AG. Sensitivity of MRI tumor biomarkers to VEGFR inhibitor therapy in an orthotopic mouse glioma model. PLoS One. 2011;6:e17228. doi: 10.1371/journal.pone.0017228. [DOI] [PMC free article] [PubMed] [Google Scholar]
- 7.Friedman HS, Prados MD, Wen PY, Mikkelsen T, Schiff D, Abrey LE, Yung WK, Paleologos N, Nicholas MK, Jensen R, Vredenburgh J, Huang J, Zheng M, Cloughesy T. Bevacizumab alone and in combination with irinotecan in recurrent glioblastoma. J Clin Oncol. 2009;27:4733–40. doi: 10.1200/JCO.2008.19.8721. [DOI] [PubMed] [Google Scholar]
- 8.Gibaldi M, P D. Pharmacokinetics. New York, NY: Dekker; 1982. [Google Scholar]
- 9.Grossman R, Rudek MA, Brastianos H, Zadnik P, Brem H, Tyler B, Blakeley JO. The impact of bevacizumab on temozolomide concentrations in intracranial U87 gliomas. Cancer Chemother Pharmacol. 2012;70:129–39. doi: 10.1007/s00280-012-1867-1. [DOI] [PMC free article] [PubMed] [Google Scholar]
- 10.Jacobs S, McCully CL, Murphy RF, Bacher J, Balis FM, Fox E. Extracellular fluid concentrations of cisplatin, carboplatin, and oxaliplatin in brain, muscle, and blood measured using microdialysis in nonhuman primates. Cancer Chemother Pharmacol. 2010;65:817–24. doi: 10.1007/s00280-009-1085-7. [DOI] [PMC free article] [PubMed] [Google Scholar]
- 11.Kamoun WS, Ley CD, Farrar CT, Duyverman AM, Lahdenranta J, Lacorre DA, Batchelor TT, di Tomaso E, Duda DG, Munn LL, Fukumura D, Sorensen AG, Jain RK. Edema control by cediranib, a vascular endothelial growth factor receptor-targeted kinase inhibitor, prolongs survival despite persistent brain tumor growth in mice. J Clin Oncol. 2009;27:2542–52. doi: 10.1200/JCO.2008.19.9356. [DOI] [PMC free article] [PubMed] [Google Scholar]
- 12.Kim KJ, Wang L, Su YC, Gillespie GY, Salhotra A, Lal B, Laterra J. Systemic anti-hepatocyte growth factor monoclonal antibody therapy induces the regression of intracranial glioma xenografts. Clin Cancer Res. 2006;12:1292–8. doi: 10.1158/1078-0432.CCR-05-1793. [DOI] [PubMed] [Google Scholar]
- 13.Kreisl TN, Kim L, Moore K, Duic P, Royce C, Stroud I, Garren N, Mackey M, Butman JA, Camphausen K, Park J, Albert PS, Fine HA. Phase II trial of single-agent bevacizumab followed by bevacizumab plus irinotecan at tumor progression in recurrent glioblastoma. J Clin Oncol. 2009;27:740–5. doi: 10.1200/JCO.2008.16.3055. [DOI] [PMC free article] [PubMed] [Google Scholar]
- 14.Le Quellec A, Dupin S, Genissel P, Saivin S, Marchand B, Houin G. Microdialysis probes calibration: gradient and tissue dependent changes in no net flux and reverse dialysis methods. J Pharmacol Toxicol Methods. 1995;33:11–6. doi: 10.1016/1056-8719(94)00049-a. [DOI] [PubMed] [Google Scholar]
- 15.Ma J, Li S, Reed K, Guo P, Gallo JM. Pharmacodynamic-mediated effects of the angiogenesis inhibitor SU5416 on the tumor disposition of temozolomide in subcutaneous and intracerebral glioma xenograft models. J Pharmacol Exp Ther. 2003;305:833–9. doi: 10.1124/jpet.102.048587. [DOI] [PubMed] [Google Scholar]
- 16.Ma J, Pulfer S, Li S, Chu J, Reed K, Gallo JM. Pharmacodynamic-mediated reduction of temozolomide tumor concentrations by the angiogenesis inhibitor TNP-470. Cancer Res. 2001;61:5491–8. [PubMed] [Google Scholar]
- 17.McGirt MJ, Than KD, Weingart JD, Chaichana KL, Attenello FJ, Olivi A, Laterra J, Kleinberg LR, Grossman SA, Brem H, Quinones-Hinojosa A. Gliadel (BCNU) wafer plus concomitant temozolomide therapy after primary resection of glioblastoma multiforme. J Neurosurg. 2009;110:583–8. doi: 10.3171/2008.5.17557. [DOI] [PMC free article] [PubMed] [Google Scholar]
- 18.Pathak AP. Magnetic resonance susceptibility based perfusion imaging of tumors using iron oxide nanoparticles. Wiley Interdiscip Rev Nanomed Nanobiotechnol. 2009;1:84–97. doi: 10.1002/wnan.17. [DOI] [PubMed] [Google Scholar]
- 19.Pathak AP, Hochfeld WE, Goodman SL, Pepper MS. Circulating and imaging markers for angiogenesis. Angiogenesis. 2008;11:321–35. doi: 10.1007/s10456-008-9119-z. [DOI] [PubMed] [Google Scholar]
- 20.Portnow J, Badie B, Chen M, Liu A, Blanchard S, Synold TW. The neuropharmacokinetics of temozolomide in patients with resectable brain tumors: potential implications for the current approach to chemoradiation. Clin Cancer Res. 2009;15:7092–8. doi: 10.1158/1078-0432.CCR-09-1349. [DOI] [PMC free article] [PubMed] [Google Scholar]
- 21.Sorensen AG, Batchelor TT, Zhang WT, Chen PJ, Yeo P, Wang M, Jennings D, Wen PY, Lahdenranta J, Ancukiewicz M, di Tomaso E, Duda DG, Jain RK. A “vascular normalization index” as potential mechanistic biomarker to predict survival after a single dose of cediranib in recurrent glioblastoma patients. Cancer Res. 2009;69:5296–300. doi: 10.1158/0008-5472.CAN-09-0814. [DOI] [PMC free article] [PubMed] [Google Scholar]
- 22.Stupp R, Mason WP, van den Bent MJ, Weller M, Fisher B, Taphoorn MJ, Belanger K, Brandes AA, Marosi C, Bogdahn U, Curschmann J, Janzer RC, Ludwin SK, Gorlia T, Allgeier A, Lacombe D, Cairncross JG, Eisenhauer E, Mirimanoff RO European Organisation for R, Treatment of Cancer Brain T, Radiotherapy G, National Cancer Institute of Canada Clinical Trials G. Radiotherapy plus concomitant and adjuvant temozolomide for glioblastoma. N Engl J Med. 2005;352:987–96. doi: 10.1056/NEJMoa043330. [DOI] [PubMed] [Google Scholar]
- 23.Wedge SR, Kendrew J, Hennequin LF, Valentine PJ, Barry ST, Brave SR, Smith NR, James NH, Dukes M, Curwen JO, Chester R, Jackson JA, Boffey SJ, Kilburn LL, Barnett S, Richmond GH, Wadsworth PF, Walker M, Bigley AL, Taylor ST, Cooper L, Beck S, Jurgensmeier JM, Ogilvie DJ. AZD2171: a highly potent, orally bioavailable, vascular endothelial growth factor receptor-2 tyrosine kinase inhibitor for the treatment of cancer. Cancer Res. 2005;65:4389–400. doi: 10.1158/0008-5472.CAN-04-4409. [DOI] [PubMed] [Google Scholar]
- 24.Zhou Q, Gallo JM. In vivo microdialysis for PK and PD studies of anticancer drugs. AAPS J. 2005;7:E659–67. doi: 10.1208/aapsj070366. [DOI] [PMC free article] [PubMed] [Google Scholar]