

Abstract
Systemic injection of granulocyte colony-stimulating factor (G-CSF) has yielded encouraging results in treating Alzheimer's Disease (AD) and other central nervous system (CNS) disorders. Making G-CSF a viable AD therapeutic will, however, require increasing G-CSF's ability to stimulate neurons within the brain. This objective could be realized by increasing transcytosis of G-CSF across the blood brain barrier (BBB). An established correlation between G-CSF receptor (G-CSFR) binding pH responsiveness and increased recycling of G-CSF to the cell exterior after endocytosis motivated development of G-CSF variants with highly pH responsive G-CSFR binding affinities. These variants will be used in future validation of our hypothesis that increased BBB transcytosis can enhance G-CSF therapeutic efficacy. Flow cytometric screening of a yeast-displayed library in which G-CSF/G-CSFR interface residues were mutated to histidine yielded a G-CSF triple His mutant (L109H/D110H/Q120H) with highly pH responsive binding affinity. This variant's KD, measured by surface plasmon resonance (SPR), increases ∼20-fold as pH decreases from 7.4 to below histidine's pKa of ∼6.0; an increase 2-fold greater than for previously reported G-CSF His mutants. Cell-free protein synthesis (CFPS) enabled expression and purification of soluble, bioactive G-CSF triple His variant protein, an outcome inaccessible via Escherichia coli inclusion body refolding. This purification and bioactivity validation will enable future identification of correlations between pH responsiveness and transcytosis in BBB cell culture model and animal experiments. Furthermore, the library screening and CFPS methods employed here could be applied to developing other pH responsive hematopoietic or neurotrophic factors for treating CNS disorders.
Keywords: Alzheimer's disease, blood brain barrier, cell-free protein synthesis, granulocyte colony-stimulating factor, yeast surface display
Introduction
Granulocyte colony-stimulating factor (G-CSF), commercially known as Amgen's Filgrastim or Pegfilgrastim in the case of PEGylated G-CSF, has been prescribed in treating neutropenia for nearly two decades. Observations of G-CSF protecting neurons from apoptosis and promoting differentiation of neural stem cells in vitro (Schneider et al., 2005; Frank et al., 2009; Sanchez-Ramos et al., 2009) have motivated evaluating systemic G-CSF injection as a treatment for Alzheimer's Disease (AD) (Sanchez-Ramos et al., 2012), Parkinson's Disease (PD) (Frank et al., 2012) and Amyotrophic Lateral Sclerosis (ALS) (Pitzer et al., 2008; Chiò et al., 2012) in animal models and clinical trials. Although G-CSF has improved outcomes in human studies, the modest observed therapeutic benefits suggest that wild-type G-CSF will not find broad applicability in treating central nervous system (CNS) disorders.
G-CSF's measurable but unexceptional therapeutic efficacy in human trials could be due to the amount of injected G-CSF reaching the brain parenchyma being too low to promote appreciable activation of G-CSF receptors (G-CSFRs) on CNS neurons. Respective post-injection measurements of G-CSF in animal (Frank et al., 2012) and human (Chio et al., 2012) cerebrospinal fluid (CSF) support this hypothesis; in vivo G-CSF concentrations in CSF of ≤25 pM are below reported cell culture study neurogenesis and neuroprotection half-maximal effective concentration (EC50) values, all of which are >100 pM (Schäbitz et al., 2003, 2005; Meuer et al., 2006; Sanchez-Ramos et al., 2009). G-CSF is actively transported across the rat blood brain barrier (BBB) by a slow and saturable mechanism, presumably G-CSFR-mediated transcytosis (Zhao et al., 2007). As such, introducing mutations that increase G-CSF BBB transcytosis could bring G-CSF concentrations in CSF closer to or above the in vitro neuroprotection and neurogenesis EC50 values and increase G-CSF's efficacy in treating CNS disorders.
Structure-guided rational design (Sarkar et al., 2002) has been used to create G-CSF single His mutants with decreased susceptibility to lysosomal degradation for the purpose of increasing serum half-life (t1/2) in neutropenia patients. Introduction of His mutations was motivated by the hypothesis that reducing G-CSF's receptor binding affinity at the acidic pH (5.5–6.0) within the endosomes would promote intraendosomal dissociation of G-CSF/G-CSFR complexes after their formation on the leukocyte cell surface. Given histidine's side chain pKa of ∼6.0, it was posited that endocytosis could cause electrostatic repulsion to occur at G-CSF/G-CSFR binding interfaces, reducing mutant binding affinity after endocytosis without unduly compromising G-CSF's affinity for G-CSFR on the cell exterior.
pH responsive G-CSFR binding affinity reduced lysosomal degradation of G-CSF in cell culture experiments; two single His mutants with decreased binding affinity at acidic pH, D110H and D113H, had greater cell surface recycling rates than wild-type G-CSF (Sarkar et al., 2002). Leukocyte cell culture proliferation assays showed that increased recycling enabled the variants to promote increased levels of cell proliferation despite their having greater than wild-type receptor binding dissociation constant (KD) values at both endosomal pH and the neutral pH conditions at the cell surface.
We hypothesize that G-CSF BBB transcytosis occurs via a three-step mechanism comprising endocytosis, dissociation of G-CSF/G-CSFR complexes within the endosome and cell surface recycling (Supplementary Fig. S1). This mechanism would result in the fraction of G-CSF His variants endocytosed on the luminal (blood) side of the BBB that reach the endothelial cell exterior on the abluminal (brain) side being increased relative to wild-type G-CSF. Increasing the pH sensitivity of G-CSF's receptor binding affinity could also enhance the cytokine's efficacy via two other mechanisms: extending G-CSF's circulation lifetime and increasing G-CSF's half-life in the CNS after BBB transcytosis.
The magnitude of pH-mediated changes in protein–protein interaction strength can be increased by introducing multiple His substitutions into one of the interaction partners (Igawa et al., 2010; Murtaugh et al., 2011). As such, we used a yeast display-based combinatorial His variant library screening approach to isolate G-CSF variants with combinations of His mutations that would lead to greater pH responsiveness than that observed for previously described single His mutants. Establishment of such a generalizable combinatorial His mutant library screening method for engineering hematopoietic and neurotrophic factors with pH responsive receptor binding could enable the development of other BBB-traversing recombinant proteins (McLay et al., 1997; Brines et al., 2000; Lieutaud et al., 2008) as CNS therapeutics.
With respect to such other biopharmaceuticals, granulocyte macrophage colony-stimulating factor (GM-CSF) is in AD clinical trials (Boyd et al., 2010; Jim et al., 2012), has reduced infarct volume and improved motor function recovery in rodent models of ischemic stroke (Kong et al., 2009; Sugiyama et al., 2011) and is neuroprotective in PD mice (Kim et al., 2009). Erythropoietin improves memory in AD mice (Lee et al., 2012), is being pursued as a treatment for both PD (Jang et al., 2012) and ALS (Kadota et al., 2009; Koh et al., 2007), and has shown promise in ischemic stroke clinical trials (Ehrenreich et al., 2003, 2009, 2011).
Refolding G-CSF, as well as other disulfide-containing hematopoietic and neurotrophic factors, from the inclusion bodies that form during recombinant expression in the Escherichia coli cytoplasm is often associated with both considerable labor and difficulty in consistently obtaining properly folded, biologically active protein (Song et al., 2009, 2012). Although the baker's yeast Saccharomyces cerevisiae can secrete recombinant proteins with properly formed disulfide bonds, secretion levels are often too low to enable downstream biophysical and bioactivity characterizations without using large expression culture volumes (Robinson and Wittrup, 1995; Robinson et al., 1996). Additionally, regardless of the recombinant expression host used, protein expression levels can be markedly decreased by the introduction of even just a single mutation (Liu et al., 2009).
The success of in vitro translation, or cell-free protein synthesis (CFPS), in producing ample quantities of bioactive, disulfide bond-containing cytokines (Yang et al., 2004; Carlson et al., 2012; Knapp et al., 2007) makes CFPS an attractive alternative to microbial expression cultures for production of properly folded and bioactive wild type, and especially His mutant, hematopoietic or neurotrophic factors (Rosenblum and Cooperman, 2014; Smith et al., 2014). In this work, we combine a yeast display-based (Gai and Wittrup, 2007) combinatorial G-CSF His mutant library screen with a CFPS method to identify a lead G-CSF multiple His variant that warrants future evaluation in BBB cell culture model transcytosis experiments.
Materials and methods
Yeast surface display of human G-CSF
The human G-CSF gene, isoform B, was synthesized with yeast codon optimization (DNA 2.0) and amplified with upstream primer GCNheLt (5′-CACTAGCTAGCGCAACACCTTTGGGTCCTGCCAGC-3′) and downstream primer GCBamRt (5′-CTAGAGGATCCGGGCTGGGCAAGGTGGCGTAGAACGC-3′). PCR products were cloned into the NheI and BamHI restriction sites of yeast display vector pCTCON. The surface display plasmid was validated by sequencing and transformed into S.cerevisiae surface display strain EBY100 made competent using the Zymo Research Frozen EZ-Yeast Transformation II kit. An EBY100 colony transformed with the G-CSF yeast surface display plasmid was picked into 5 ml of Sabouraud dextrose casamino acid media and grown overnight at 30°C before being induced for 24 h in 5 ml of Sabouraud galactose casamino acid at 22°C. Induced cultures were resuspended in phosphate buffered saline (PBS) with 1 mg/ml bovine serum albumin (BSA) prior to flow cytometric analysis of G-CSFR binding.
Recombinant human G-CSFR (R&D Systems) was biotinylated using biotin-NHS (Pierce) and exchanged into pH 7.4 PBS using a Zeba Spin desalting column (Pierce). G-CSFR labeling was carried out in PBS-BSA with 10% fetal calf serum (Life Technologies) at pH 7.4 for 1 h at 25°C. These incubations included anti-myc IgY (Life Technologies) at a concentration of 20 µg/ml. Secondary labeling for G-CSFR binding was performed on ice by incubation with FITC-conjugated goat anti-IgY (Jackson Immunoresearch) at 20 µg/ml and streptavidin-phycoerythrin (Jackson Immunoresearch) at 10 µg/ml in PBS-BSA. FITC and phycoerythrin fluorescence signals were measured using a Becton Dickinson FACSort flow cytometer.
Construction and sorting of G-CSF combinatorial His variant library
Primers containing degenerate codons were used to introduce either wild type or His residues at helix A positions 17, 21, 23 and 24 as well as helix C positions 109, 110, 113, 117 and 120. Three polymerase chain reaction (PCR) products amplified from the G-CSF display plasmid, upstream to helix A, helix A to helix C and helix C to downstream, were annealed in single overlap extension PCR using respective upstream and downstream outer primers ConSqLt (5′-CTACTCTTTGTCAACGACTAC-3′) and ConSqRt (5′-CATGGGAAAACATTTTTTACG-3′). These respective oligonucleotides prime ∼80 bases upstream and downstream of the G-CSF gene within the yeast display plasmid. The final PCR product was transformed into EBY100 by homologous recombination using a Sigma-Aldrich Lithium Acetate Yeast Transformation Kit. Library sorts were performed with 15 nM biotinylated G-CSFR at pH 7.4 or 25 nM G-CSFR at pH 5.5.
G-CSF cell-free protein synthesis
G-CSF genes were amplified from yeast display plasmids using upstream primer NcoLtG (5′-GAGTCCATGGGACATCACCATCACCATCACGGATGAGAGAACCTCTATTTTCAGTCTGGATCTGCAACACCTTTGGGTCCTGCC-3′) and downstream primer GStpBRt (5′-CTAGAGGATCCCTAGGGCTGGGCAAGGTGGCGTAGAACGC-3′). The upstream primer encodes both a His6 tag and a TEV protease site, which was not utilized in protein production, for His6 tag removal. PCR products were ligated into the NcoI and BamHI sites of pET28a(+). Plasmid DNA for correctly sequenced clones to be used in CFPS reactions was isolated from E.coli XL-1 Blue cells using a Qiagen Spin Miniprep Kit.
To prepare E.coli extracts for CFPS, BL21 (DE3) star cells (Life Technologies) were grown in a BIOSTAT C-Plus Fermentor (Sartorius) in 10 l of 2xYTPG media at 37°C to OD600 of 4.5; 1 mM of IPTG was added to induce T7 polymerase production after the culture reached an OD of 0.6. Cells were centrifuged at 5000 g for 15 min at 4°C, washed three times with cold S30 buffer and stored at −80°C. For lysis, cells were thawed and re-suspended in 1 ml of S30 buffer per gram wet weight and lysed in an EmulsiFlex-C3 homogenizer (Avestin) in a single pass at a pressure of 20 000–25 000 psi. Cellular debris was removed by two centrifugations at 30,000 g for 30 min at 4°C. Supernatant was incubated for 80 min at 37°C with shaking at 250 rpm, centrifuged at 15 000 g for 15 min at 4°C, flash-frozen on liquid nitrogen and stored at −80°C for subsequent use in CFPS. This extract contained ∼35 mg/ml total protein as measured using a QuickStart Protein Assay concentration kit (BioRad).
CFPS reactions were performed using a modified, oxidizing PANOx-SP system (Jewett and Swartz, 2004; Zawada et al., 2011) and run at 50 μl scale in a 1.5 ml microcentrifuge tube containing: 12 mM magnesium glutamate, 10 mM ammonium glutamate, 130 mM potassium glutamate, 1.2 mM adenosine triphosphate, 0.85 mM guanosine triphosphate, 0.85 mM uridine triphosphate, 0.85 mM cytidine triphosphate, 0.034 mg/ml folinic acid, 0.171 mg/ml E.coli tRNA (Roche), 2 mM each of all 20 amino acids, 0.03 M phosphoenolpyruvate (Roche), 0.33 mM nicotinamide adenine dinucleotide, 0.27 mM coenzyme-A, 4 mM oxalic acid, 1 mM putrescine, 1.5 mM spermidine, 57 mM 4-(2-Hydroxyethyl)piperazine-1-ethanesulfonic acid (HEPES), 1 µl/ml Halt protease inhibitor cocktail (Fisher Scientific), 4 mM oxidized glutathione, 1 mM reduced glutathione, 13.3 µg/ml G-CSF plasmid DNA; 6.3 µM disulfide bond isomerase C (DsbC) (Enzo) and 30% (v/v) S30 extract treated with 25 µM iodoacetamide (mixed and incubated at room temperature for 30 min prior to reaction). Reactions were incubated for 4 h at 30°C. Unless otherwise noted, all reagents were purchased from Sigma.
G-CSF purification
G-CSF was purified using the Dynabeads His-Tag Isolation & Pulldown product (Life Technologies). Endotoxin removal was performed using Pierce High Capacity endotoxin removal spin columns. Proteins were subsequently desalted into PBS using Zeba Spin columns and sterilized using a PES syringe filter (Pall Life Sciences). G-CSF concentration and purity were determined using SDS–PAGE analysis in conjunction with the QuickStart Protein Assay concentration measurement kit.
Analytical 15 μl scale CFPS reactions employing 14C-Leucine incorporation (0.05 µCi per reaction) were performed to assess the effect of reaction conditions on the yield of soluble G-CSF. Oxidizing condition reactions were carried out as above, reducing condition reactions were performed as previously described. Both soluble (isolated by centrifugation at 12 000 g for 15 min at 4°C) and total protein concentrations were quantified based on trichloroacetic acid-precipitable radioactivity yields in a MicroBeta2 scintillation counter (PerkinElmer) as described (Calhoun and Swartz, 2005). Additionally, respective 5 μl aliquots of denatured total CFPS reaction and reaction supernatants were loaded on a 4–12% NuPAGE SDS–PAGE gel. Dried gels were exposed for 3 days on a Storage Phosphor Screen (GE Healthcare) and autoradiogram read using a Storm Imager (GE Healthcare).
Yeast surface display G-CSFR binding sandwich assay
The human G-CSF receptor gene was cloned into the NheI and MluI sites of yeast display plasmid pCTEGFR (Hackel et al., 2012) with primers CSFR3Lt (5′-GAGTGCTAGCGCAAGGCTGGGAAACTGCAGCCTG-3′) and RtCSFR3 (5′-GAGTACGCGTCTAGAAGCTCCCCAGCGCCTCCATC-3′) using MGC clone 61541 plasmid DNA as template. A correctly sequenced clone was transformed into EBY100 and induction of surface display performed as above. Binding assays were carried out using 200 nM CFPS-produced G-CSF in PBS-BSA on ice at pH 7.4. Secondary labeling was performed with 20 µg/ml anti-His6 mAb (BioLegend) and tertiary labeling was performed with 40 µg/ml goat anti-mouse phycoerythrin (Sigma).
Size exclusion chromatography analysis of G-CSF
Two micrograms of wild type and mutant G-CSF were run through a Superdex 200 Increase 10/300 GL size exclusion column (GE Healthcare) using an AKTA Pure FPLC system (GE Healthcare). The column was calibrated with a GE Healthcare Gel Filtration LMW Calibration Kit to estimate G-CSF molecular weights. Elution was carried out in PBS, pH 7.4, in isocratic mode at a flow rate of 0.5 ml/min.
Surface plasmon resonance measurement of G-CSF binding to G-CSFR
Recombinant G-CSFR (R&D Systems) was immobilized using amine conjugation chemistry. Binding signals were measured using a SensiQ Pioneer surface plasmon resonance (SPR) instrument (SensiQ Technologies). The sensor chip was exposed to G-CSF using a SensiQ One Step gradient mode (25 µl/min flow rate) injection with final G-CSF concentrations of 25 and 50 nM for pH 7.4 binding assays and 100 and 200 nM for pH 5.5 assays. Assays were conducted in 10 mM HEPES, 150 mM NaCl, 3.4 mM EDTA, 0.005% Tween-20 buffer. Binding parameters were determined using the SensiQ Qdat data analysis software package.
G-CSF in vitro bioactivity assays
NFS60 murine leukocytes (ATCC product CRL-1838) were cultured in RPM1640 media, ATCC formulation, supplemented with 10% fetal calf serum, 50 µM β-mercaptoethanol and 62 ng/ml human macrophage colony-stimulating factor (R&D Systems) at 37°C under 5% CO2. Purified G-CSF or commercial G-CSF standard (R&D systems) was added to cells in 96-well plates at a density of 2500 cells/well in 100 µl of media. After 4 days of incubation, 20 µl of MTS Cell Titer AqueousOne viability indicator (Promega) was added to each well and absorbance values at 492 nm read after 4 h of color development in a 37°C, 5% CO2 incubator.
Results and discussion
Design of combinatorial G-CSF His variant library
The structure-guided approach used to design the previously described G-CSF single His mutants was based on identifying G-CSF side chains contributing to negative charge density on the G-CSF surface at the G-CSF/G-CSFR high affinity binding site interface. This strategy led to the creation of six single mutants with respective His substitutions at residues E20, Q21, D110, D113, T117 and Q120. The GM-CSFR binding affinities of the D110H and D113H mutants were found to be more pH responsive than for wild-type G-CSF and were not statistically significantly reduced relative to wild type at neutral pH as measured by SPR (Sarkar et al., 2002).
Our ability to use yeast display and FACS to screen a large combinatorial G-CSF His variant library motivated our mutating not only the six residues noted above but also other G-CSF residues with side chain heavy atoms lying within 5 Ǻ of a G-CSFR side chain heavy atom as defined by PDB entry 1CD9. This approach led to a library in which degenerate codons were used to encode for His, the wild type, and in certain cases as dictated by base triplets other residues, at positions K17, Q21, R23, K24, L109, D110, D113, T117 and Q120 (Fig. 1). Although residue E20 satisfies the >5 Ǻ proximity criterion the observation that an E20K substitution abrogates G-CSFR binding (Oshima and Fujimura, 2003) motivated our choosing not to introduce His substitutions at this position. The above construction led to a yeast-displayed library containing 42 × 27 = 2048 possible unique G-CSF variants, providing ample clonal diversity while being well within the screening capacity of FACS.
Fig. 1.
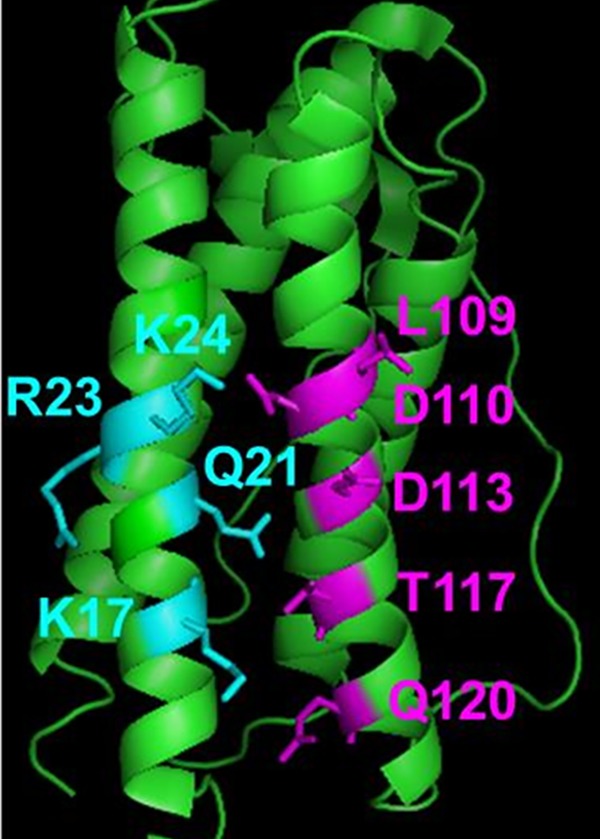
G-CSF crystal structure (PDB entry 1CD9) with helix A residues mutated in combinatorial library denoted in cyan and helix C residues denoted in magenta. Figure created using Pymol.
G-CSF yeast surface display and His variant library screening
We verified display of wild-type G-CSF on the yeast surface and also confirmed binding to recombinant, soluble, biotinylated G-CSFR. Limiting stock concentration of biotinylated G-CSF prevented our obtaining a saturated fluorescence signal in flow cytometric analyses. As such, we were unable to quantitatively determine a KD value for the G-CSF/G-CSFR interaction; we estimate that this value lies in the 2–5 nM range for wild-type G-CSF at both pH 7.4 and pH 5.5. Given our planned use of SPR to rigorously quantify binding parameters for soluble, purified wild type and His variant G-CSFs, we felt that qualitative comparisons of dot plots would enable satisfactory assessment of relative binding affinities and pH responsiveness in yeast display affinity engineering experiments (Supplementary Fig. S2).
We performed multiple rounds of FACS to enrich combinatorial His library clones that possessed greater pH responsiveness than the D110H mutant (Fig. 2) without a commensurate, as subjectively determined, unduly large reduction in binding affinity at neutral pH. The D110H mutant was chosen as the benchmark clone by virtue of our flow cytometric analysis indicating that it possessed mildly greater pH responsiveness than the D113H mutant. Two different series of FACS clonal enrichments were executed. For one of the series, referred to as 7/5/7, clones were incubated with 15 nM G-CSFR at pH 7.4 and those with G-CSFR binding signal comparable with that for D110H were enriched in this first sort. In a second round of FACS, clones from round one were incubated with 25 nM G-CSFR at pH 5.5 and those with lower G-CSFR binding signals were enriched. In a third and final sort, these enriched clones were once again incubated with 15 nM G-CSFR at pH 7.4 and clones with affinities similar to those for the D110H mutant were isolated.
Fig. 2.

Dot plots for D110H reference clone and combinatorial G-CSF His variant library sorts. Y-Axes denote fluorescence corresponding to G-CSF binding affinity. X-Axes denote fluorescence corresponding to yeast surface display level. Combinatorial library 7/5/7 sort series depicted in upper dot plot panel. Combinatorial library 5/7/5 sort series depicted in lower dot plot panel. D110H single His mutant dot plots used as references for library sorting appear in left panels. Yellow polygons denote library clones enriched at pH 7.4 and orange polygons denote library clones enriched at pH 5.5. Sorting at pH 7.4 carried out with 15 nM G-CSFR. Sorting at pH 5.5 carried out with 25 nM G-CSFR.
The second series of sorts, referred to as 5/7/5, also consisted of three rounds of FACS. In this sorting series, the initial sort was carried out after incubation with G-CSFR at pH 5.5 and clones with G-CSFR binding signals lower than D110H but greater than yeast not incubated with G-CSFR were enriched. Respective subsequent rounds of FACS were performed at pH 7.4 and pH 5.5 to ensure adequate retention of G-CSFR binding affinity at pH 7.4 and verify potentially increased pH responsiveness.
pH responsiveness and sequences of single clones from G-CSF His variant library FACS
Six individual clones were picked at random from both the 7/5/7 and 5/7/5 sort series enriched clonal pools and their binding affinities at both pH 5.5 and pH 7.4 compared with those for D110H. Two and four clones from the respective 7/5/7 and 5/7/5 clonal pools appeared to have both greater pH responsiveness than D110H and appreciable retention of G-CSFR binding affinity at pH 7.4.
Sequencing of the two 5/7/5 pH responsive clones revealed a common quadruple His variant, L109H/D110H/D113H/T117H, subsequently referred to as ‘Q’. The 7/5/7 pool positive clones comprising a mixture of two each clones containing either the L109H/D110H/Q120H His substitution triad or the L109H/Q120H substitution pair. One each of these respective clones also featured a K17Q mutation that did not affect binding affinity at either acidic or neutral pH. As shown in the dot plots of Fig. 3, both clone Q and clone 757 (L109H/D110H/Q120H) appeared to be more pH responsive than D110H.
Fig. 3.
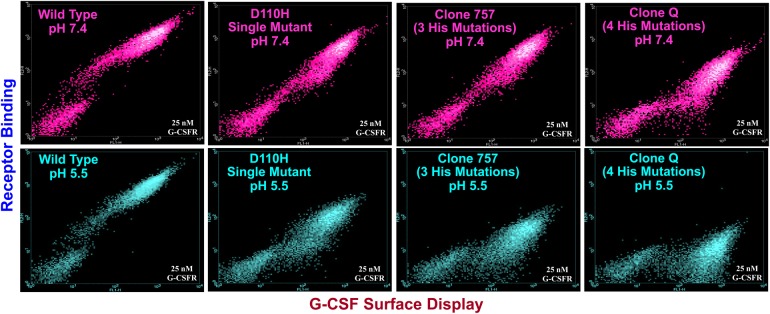
Comparison of dot plots at pH 5.5 (cyan) and pH 7.4 (magenta) for G-CSF wild type, D110H single mutant, clone 757 and clone Q. Y-Axes denote fluorescence corresponding to receptor binding. X-Axes denote fluorescence corresponding to G-CSF surface display. All analyses performed with 25 nM G-CSFR.
We sought to determine why there are no accounts of characterization or expression of a double His variant that combines the D110H and D113H substitutions reported to impart pH responsiveness. As shown in Supplementary Fig. S3, the D110H/D113H double mutant was poorly displayed on the yeast surface and did not bind to the G-CSF receptor, observations suggesting that this protein is unstable. Interestingly, clone Q, which was reasonably well displayed and bound to G-CSFR, contains D110H and D113H among its four His mutations. We believe that clone Q's L109H and T117H mutations might afford helix C with greater conformational flexibility and/or reduce unfavorable steric interactions among residues 109, 110, 113 and 117 so as to stabilize the D110H/D113H substitution pair (Supplementary Fig. S4).
Cell-free protein synthesis of wild type and His variant G-CSF
Our qualitative observations of increased pH responsiveness for the clone 757 and clone Q combinatorial His variants motivated production of soluble, purified protein for quantitative comparison to wild type and single His mutant G-CSF in SPR receptor binding and in vitro bioactivity assays. The majority of published methods for recombinant G-CSF production (Bishop et al., 2001; Sarkar et al., 2002) entail cytoplasmic expression in E.coli and refolding of G-CSF from inclusion bodies. Inclusion body refolding outcomes can, however, be difficult to reproduce. Furthermore, even single mutations can markedly reduce the expression level (Liu et al., 2009) and stability of protein variants that have been engineered for enhanced binding affinity or other properties of interest.
His variant G-CSFs that we sought to refold from inclusion bodies were incapable of, as determined using a flow cytometric sandwich binding assay in which G-CSFR is displayed on the yeast surface (Supplementary Fig. S5), binding to G-CSFR. In contrast to the reported (Song et al., 2012) successful cytoplasmic expression of soluble fusion proteins comprising G-CSF and the N-terminal domain of the E.coli phosphoglyceraldhyde kinase (pGK), we observed G-CSF fusion protein in the insoluble cell lysate fraction but little or no fusion in the supernatants for both wild type and His variant G-CSFs (Supplementary Fig. S6).
As an alternative to expressing G-CSF in E.coli whole cell cultures, we employed an E.coli lysate-based CFPS method to obtain His variant G-CSF following previously described approaches (Yang et al., 2004, 2005) that were used in the respective expression of murine GM-CSF and single chain antibody fusion proteins. To promote G-CSF solubility and correct disulfide bond formation, CFPS was performed under oxidizing conditions and with the addition of recombinant E.coli DsbC as previously described (Swartz, 2006; Zawada et al., 2011). The lower concentration, relative to that within the cytoplasm of whole E.coli cells during expression of the cytokine, of G-CSF in CFPS reactions reduces intermolecular interactions among nascent or misfolded G-CSF polypeptides (Rosenblum and Cooperman, 2014) and is expected to augment the use of oxidizing reaction conditions and addition of DsbC in promoting G-CSF's folding into the proper conformation.
Quantification of G-CSF band intensities by comparison to bands for hen egg lysozyme standards and Bradford assay protein concentration measurements revealed yields of 150–300 µg/ml and >50% purity for all G-CSFs except clone Q (Fig. 4). Oxidizing condition CFPS more than doubled the yields of soluble His variant G-CSFs relative to CFPS carried out under reducing conditions (Supplementary Figs 7 and 8).
Fig. 4.
SDS–PAGE analysis of CFPS reaction eluates after metal ion affinity chromatography. G-CSF clone Q was expressed both as a standalone protein and as a fusion to the C-terminus of E.coli pGK as a contingency for obtaining adequate amounts of this clone. Lanes (left-to-right): (1) molecular weight standard (green bar denotes 25 kDa); (2) wild-type G-CSF; (3) negative control reaction; (4) D110H; (5) D113H; (6) Clone 757; (7) pGK-Clone Q; (8) Clone Q.
Size exclusion chromatography analysis of purified G-CSFs was performed to assess the folding state and conformational homogeneity of these proteins. Size exclusion chromatography chromatograms showed relatively homogeneous elution peaks near the anticipated MW of 22 kDa (Supplementary Fig. 9). Our conclusion that oxidizing CFPS reactions had yielded correctly folded wild type and His variant G-CSF was further supported by all of the G-CSFs binding to G-CSFR in the yeast surface sandwich assay (Supplementary Fig. 10).
SPR quantification of G-CSF receptor binding parameters
SPR analysis of wild type and His variant binding to immobilized G-CSFR verified our hypothesis that G-CSF variants containing multiple His substitutions can be more pH responsive than single His mutants (Table I). The KD ratio (pH 5.5:pH 7.4) for clone 757 was almost 2-fold greater than those measured for both D110H and D113H and was increased more than 15-fold relative to wild-type G-CSF. Clone 757’s increased pH responsiveness was largely due to a koff at acidic pH that is 25 times greater than that for the wild-type cytokine (Fig. 5 and Table II). Clone Q had markedly reduced receptor binding affinity at both neutral and acidic pH and a KD ratio similar to those for the single His mutants (Table I), binding properties likely to limit this variant's utility as a candidate CNS disorder therapeutic. Sensorgrams for wild type and His variant G-CSFs appear in Supplementary Fig. S11.
Table I.
Equilibrium binding dissociation constant values for wild type and His variant G-CSF binding to immobilized G-CSFR at pH 5.5 and pH 7.4
| G-CSF Variant | pH 5.5 KD (pM) | pH 7.4 KD (pM) | KD ratio (pH 5.5/pH 7.4) |
|---|---|---|---|
| Wild Type | 170 | 200 | 0.85 |
| D110H | 5000a | 440 | 11 |
| D113H | 3400 | 330 | 10 |
| Clone 757 | 9100 | 510 | 18 |
| Clone Q | 57 000 | 6400a | 8.9 |
Values were calculated using a global data fit to measurements made at 25 and 50 nM at pH 7.4 and 100 and 200 nM at pH 5.5. Uncertainties in model fit values were <5% in all cases.
aData fit for 50 nM injection only.
Fig. 5.

Sensorgrams for wild-type G-CSF (left panel) and triple His variant clone 757 (right panel) binding to immobilized G-CSF receptor at pH 7.4 (top panel) and pH 5.5 (bottom panel). G-CSF injections were performed at both 25 and 50 nM G-CSF concentration at pH 7.4 and 100 and 200 nM G-CSF concentration at pH 5.5 to ensure adequate binding signals at acidic pH. Black lines denote measured instrument response units. Orange lines denote model fits.
Table II.
Kinetic parameters for wild type and His variant G-CSF binding to immobilized G-CSFR at pH 5.5 and pH 7.4
| G-CSF Variant | pH 5.5, kon (×10−5 M−1 s−1) | pH 5.5, koff (×105 s−1) | pH 7.4, kon (×10−5 M−1 s−1) | pH 7.4, koff (×105 s−1) |
|---|---|---|---|---|
| Wild Type | 3.6 | 7.2 | 4.9 | 8.3 |
| D110H | 2.3 | 120 | 3.7a | 16a |
| D113H | 2.8 | 94 | 2.8 | 14 |
| Clone 757 | 1.9 | 180 | 3.3 | 17 |
| Clone Q | 0.37 | 210 | 0.87a | 56a |
Values were calculated using a global data fit to measurements made at 25 and 50 nM and 100 and 200 nM at pH 5.5. Uncertainties in model fit values were <5% in all cases.
aData fit for 50 nM injection only.
G-CSF in vitro leukocyte proliferation assays
As shown in the dose response curve of Fig. 6, clone 757’s ability to promote leukocyte proliferation in vitro was not unduly reduced by its mildly decreased G-CSFR binding affinity at pH 7.4 (Table I). Conversely, clone Q showed very little ability to promote cell proliferation even when dosed at 100 nM (Fig. 6), an outcome likely resulting from clone Q's low receptor binding affinity at neutral pH. The similarity of EC50 values for CFPS-produced and commercial G-CSF (Table III) supports the above conclusion that CFPS had yielded a highly homogeneous population of correctly folded G-CSF molecules.
Fig. 6.

NFS60 leukocyte in vitro proliferation assay dose–response curves for wild type and His variant G-CSFs. Y-Axis denotes MTS metabolic activity indicator dye absorbance at 492 nm. X-Axis denotes G-CSF concentration. Data points indicate average absorbance values for three measurements. Error bars denote standard deviations.
Table III.
Half-maximum effective concentration (EC50) values for CFPS-produced G-CSFs and commercial G-CSF standard
| Clone | EC50 (pM) |
|---|---|
| Wild Type | 230 ± 40 |
| D110H | 1000 ± 200 |
| D113H | 1300 ± 300 |
| Clone 757 | 2000 ± 300 |
| Clone Q | ND |
| Commercial standard | 210 ± 40 |
Values are averages of three trials, error bars denote standard deviation. ND denotes EC50 above assay detection limit.
We observed inverse relationships between G-CSF's binding affinity toward G-CSFR at pH 7.4 (Table I) and in vitro leukocyte proliferation assay EC50 values (Table III). Clone 757’s EC50 value was mildly increased relative to those for the single His mutants. As opposed to seeking to show that cell surface recycling can lead to increased bioactivity over long time periods (Sarkar et al., 2002), the objective for our in vitro leukocyte proliferation assays was to demonstrate acceptable retention of bioactivity for combinatorial His variants over moderate time intervals. As such, the moderate reduction in observed bioactivity for clone 757 is a desirable outcome. This result suggests that clone 757 could possess a balance of increased pH responsiveness and reasonably preserved bioactivity that will enable it to outperform single His variants in driving higher levels of in vivo neurogenesis and neuroprotection due to a combination of improved serum t1/2, increased BBB transcytosis and extended residence time within the CNS.
Conclusions
We have shown the utility of yeast display in engineering combinatorial His variant biopharmaceuticals with highly pH responsive ligand binding affinity. Additionally, we have demonstrated that CFPS is a valuable bridge to downstream evaluation of engineered proteins that are difficult to produce using cellular production platforms. These outcomes establish a generalizable approach for efficient engineering and characterization of hematopoietic and neurotrophic factors, as well as other therapeutic proteins such as single chain antibodies, that respond to changes in pH.
With respect to our goal of increasing G-CSF's viability as a candidate agent for treating AD and other CNS disorders, we have developed a novel triple His variant that possesses greater pH responsiveness than its single His mutant predecessors and also shows appreciable bioactivity in cultured leukocyte proliferation assays. Our verifying this desirable property combination opens the door to future determination of whether transcytosis across an in vitro model of the BBB (Lippmann et al., 2014) is enhanced for this clone and/or the G-CSF single His mutants relative to wild-type G-CSF. Encouraging outcomes in such BBB transcytosis studies could lead to follow-on evaluation of G-CSF His variants in AD mouse model experiments (Sanchez-Ramos et al., 2009) that would be an important milestone along the path toward our goal of seeing the results reported in this work prove to be the foundation for making G-CSF a more effective CNS disorder therapeutic.
Supplementary data
Funding
This work was supported by National Institutes of Health award R21 AG043366 to P.H. and a DARPA Biomedicines on Demand Program (N66001-13-C-4024) to M.C.J. J.A.S. was supported by a NSF Graduate Fellowship is DGE-1324585. M.C.J. is a Packard Fellow for Science and Engineering.
Supplementary Material
Acknowledgements
We thank Aaron Martin of SensiQ Technologies for assistance with SPR studies.
Conflict of interest: P.H. is pursuing a patent application pertaining to combinatorial G-CSF His variants with increased pH responsiveness.
References
- Bishop B., Koay D.C., Sartorelli A.C., Regan L. (2001) J. Biol. Chem., 276, 33465–33470. [DOI] [PubMed] [Google Scholar]
- Boyd T.D., Bennett S.P., Mori T., et al. (2010) J. Alzheimers Dis., 21, 507–518. [DOI] [PMC free article] [PubMed] [Google Scholar]
- Brines M.L., Ghezzi P., Keenan S., Agnello D., de Lanerolle N.C., Cerami C., Itri L.M., Cerami A. (2000) Proc. Natl Acad. Sci. U.S.A., 97, 10526–10531. [DOI] [PMC free article] [PubMed] [Google Scholar]
- Calhoun K.A., Swartz J.R. (2005) Biotechnol. Prog., 21, 1146–1153. [DOI] [PubMed] [Google Scholar]
- Chiò A, Mora G., La Bella V., et al. (2011) Muscle Nerve., 43, 189–195. [DOI] [PubMed] [Google Scholar]
- Carlson E.D., Gan R., Hodgman C.E., Jewett M.C. (2012) Cell-free protein synthesis: applications come of age. Biotechnol. Adv., 30, 1185–1194. [DOI] [PMC free article] [PubMed] [Google Scholar]
- Ehrenreich H., Hasselblatt M., Dembowski C., et al. (2002) Mol. Med., 8, 495–505. [PMC free article] [PubMed] [Google Scholar]
- Ehrenreich H., Weissenborn K., Prange H., et al. (2009) Stroke, 40, 647–656. [Google Scholar]
- Ehrenreich H., Kästner A., Weissenborn K., et al. (2011) Mol. Med., 17, 1306–1310. [DOI] [PMC free article] [PubMed] [Google Scholar]
- Frank T., Schlachetzki J.C., Göricke B., Meuer K., Rohde G., Dietz G.P., Bähr M., Schneider A., Weishaupt J.H. (2009) BMC Neurosci., 10, 49. [DOI] [PMC free article] [PubMed] [Google Scholar]
- Frank T., Klinker F., Falkenburger B.H., et al. (2012) Brain, 135, 1914–1925. [DOI] [PubMed] [Google Scholar]
- Gai S.A., Wittrup K.D. (2007) Curr. Opin. Struct. Biol., 17, 467–473. [DOI] [PMC free article] [PubMed] [Google Scholar]
- Hackel B.J., Neil J.R., White F.M., Wittrup K.D. (2012) Protein Eng. Des. Sel., 25, 47–57. [DOI] [PMC free article] [PubMed] [Google Scholar]
- Igawa T., Ishii S., Tachibana T., et al. (2010) Nat. Biotechnol., 28, 1203–1207. [DOI] [PubMed] [Google Scholar]
- Jang W., Park J., Shin K.J., et al. (2014) J. Neurol. Sci., 337, 47–54. [DOI] [PubMed] [Google Scholar]
- Jewett M.C., Swartz J.R. (2004) Biotechnol. Bioeng., 86, 19–26. [DOI] [PubMed] [Google Scholar]
- Jim H.S., Boyd T.D., Booth-Jones M., Pidala J., Potter H. (2012) Brain Disord. Ther., 1, doi:10.4172/bdt.1000101. [DOI] [PMC free article] [PubMed] [Google Scholar]
- Kadota T., Shingo T., Yasuhara T., et al. (2009) Brain Res., 1254, 120–127. [DOI] [PubMed] [Google Scholar]
- Kim N.K., Choi B.H., Huang X., et al. (2009) Eur. J. Neurosci., 29, 891–900. [DOI] [PubMed] [Google Scholar]
- Knapp K.G., Goerke A.R., Swartz J.R. (2007) Biotechnol. Bioeng., 97, 901–908. [DOI] [PubMed] [Google Scholar]
- Koh S.H., Kim Y., Kim H.Y., Cho G.W., Kim K.S., Kim S.H. (2007) Eur. J. Neurosci., 25, 1923–1930. [DOI] [PubMed] [Google Scholar]
- Kong T., Choi J.K., Park H., et al. (2009) J. Neurosurg., 111, 155–163. [DOI] [PubMed] [Google Scholar]
- Lee S.T., Chu K., Park J.E., Lim J.Y., Lee S.K., Kim M., Roh J.K. (2012) J. Neurochem., 120, 115–124. [DOI] [PubMed] [Google Scholar]
- Lieutaud T., Andrews P.J., Rhodes J.K., Williamson R. (2008) J. Neurotrauma, 25, 1179–1185. [DOI] [PubMed] [Google Scholar]
- Lippmann E.S., Al-Ahmad A., Azarin S.M., Palecek S.P., Shusta E.V. (2014) Sci. Rep., 4, 4160. [DOI] [PMC free article] [PubMed] [Google Scholar]
- Liu D.V., Maier L.M., Hafler D.A., Wittrup K.D. (2009) J. Immunother., 32, 887–894. [DOI] [PMC free article] [PubMed] [Google Scholar]
- McLay R.N., Kimura M., Banks W.A., Kastin A.J. (1997) Brain, 120, 2083–2091. [DOI] [PubMed] [Google Scholar]
- Meuer K., Pitzer C., Teismann P., et al. (2006) J. Neurochem., 97, 675–686. [DOI] [PubMed] [Google Scholar]
- Murtaugh M.L., Fanning S.W., Sharma T.M., Terry A.M., Horn J.R. (2011) Protein Sci., 20, 1619–1631. [DOI] [PMC free article] [PubMed] [Google Scholar]
- Oshima Y., Fujimura A. (2003) Cytokine, 24, 36–45. [DOI] [PubMed] [Google Scholar]
- Pitzer C., Krüger C., Plaas C., et al. (2008) Brain, 131 (Pt 12), 3335–3347. [DOI] [PMC free article] [PubMed] [Google Scholar]
- Robinson A.S., Wittrup K.D. (1995) Biotechnol. Prog., 11, 171–177. [DOI] [PubMed] [Google Scholar]
- Robinson A.S., Bockhaus J.A., Voegler A.C., Wittrup K.D. (1996) J. Biol. Chem., 271, 10017–10022. [DOI] [PubMed] [Google Scholar]
- Rosenblum G., Cooperman B.S. (2014) FEBS Lett., 588, 261–268. [DOI] [PMC free article] [PubMed] [Google Scholar]
- Sanchez-Ramos J., Song S., Sava V., Lin X., Mori T., Cao C., Arendash G.W. (2009) Neuroscience, 163, 55–72. [DOI] [PMC free article] [PubMed] [Google Scholar]
- Sanchez-Ramos J., Cimino C., Avila R., Rowe A., Chen R., Whelan G., Lin X., Cao C., Ashok R. (2012) J. Alzheimers Dis., 31, 843–855. [DOI] [PubMed] [Google Scholar]
- Sarkar C.A., Lowenhaupt K., Horan T., Boone T.C., Tidor B., Lauffenburger D.A. (2002) Nat. Biotechnol., 20, 908–913. [DOI] [PubMed] [Google Scholar]
- Schäbitz W.R., Kollmar R., Schwaninger M., Juettler E., Bardutzky J., Schölzke M.N., Sommer C., Schwab S. (2003) Stroke, 34, 745–751. [DOI] [PubMed] [Google Scholar]
- Schneider A., Krüger C., Steigleder T., et al. (2005) J. Clin. Invest., 115, 2083–2098. [DOI] [PMC free article] [PubMed] [Google Scholar]
- Smith M.T., Wilding K.M., Hunt J.M., Bennett A.M., Bundy B.C. (2014) FEBS Lett., 588, 2755–2761. [DOI] [PubMed] [Google Scholar]
- Song J.A., Han K.Y., Park J.S., Seo H.S., Ahn K.Y., Lee J. (2009) FEMS Microbiol. Lett., 296, 60–66. [DOI] [PMC free article] [PubMed] [Google Scholar]
- Song J.A., Lee D.S., Park J.S., Han K.Y., Lee J. (2012) Biotechnol. Bioeng., 109, 325–335. [DOI] [PubMed] [Google Scholar]
- Sugiyama Y., Yagita Y., Oyama N., Terasaki Y., Sasaki T., Kitagawa K. (2011) Stroke, 42, 770–775. [DOI] [PubMed] [Google Scholar]
- Swartz J. (2006) Developing cell-free biology for industrial applications. J. Ind. Microbiol. Biotechnol., 33, 476–485. [DOI] [PubMed] [Google Scholar]
- Yang J., Kanter G., Voloshin A., Levy R., Swartz J.R. (2004) Biotechnol. Prog., 20, 1689–1696. [DOI] [PubMed] [Google Scholar]
- Yang J., Kanter G., Voloshin A., Michel-Reydellet N., Velkeen H., Levy R., Swartz J.R. (2005) Biotechnol. Bioeng., 89, 503–511. [DOI] [PubMed] [Google Scholar]
- Zawada J.F., Yin G., Steiner A.R., Yang J., Naresh A., Roy S.M., Gold D.S., Heinsohn H.G., Murray C.J. (2011) Biotechnol. Bioeng., 108, 1570–1578. [DOI] [PMC free article] [PubMed] [Google Scholar]
- Zhao L.R., Navalitloha Y., Singhal S., Mehta J., Piao C.S., Guo W.P., Kessler J.A., Groothuis D.R. (2007) Exp. Neurol., 204, 569–573. [DOI] [PMC free article] [PubMed] [Google Scholar]
Associated Data
This section collects any data citations, data availability statements, or supplementary materials included in this article.