

Abstract
Kiwifruit (Actinidia chinensis Planchon) is an important specialty fruit crop that suffers from narrow genetic diversity stemming from recent global commercialization and limited cultivar improvement. Here, we present high-density RAD-seq-based genetic maps using an interspecific F1 cross between Actinidia rufa ‘MT570001’ and A. chinensis ‘Guihai No4’. The A. rufa (maternal) map consists of 2,426 single-nucleotide polymorphism (SNP) markers with a total length of 2,651 cM in 29 linkage groups (LGs) corresponding to the 29 chromosomes. The A. chinensis (paternal) map consists of 4,214 SNP markers over 3,142 cM in 29 LGs. Using these maps, we were able to anchor an additional 440 scaffolds from the kiwifruit draft genome assembly. Kiwifruit is functionally dioecious, which presents unique challenges for breeding and production. Three sex-specific simple sequence repeats (SSR) markers can be used to accurately sex type male and female kiwifruit in breeding programmes. The sex-determination region (SDR) in kiwifruit was narrowed to a 1-Mb subtelomeric region on chromosome 25. Localizing the SDR will expedite the discovery of genes controlling carpel abortion in males and pollen sterility in females.
Keywords: sex determination, RAD-seq, genome assembly, Actinidia chinensis, Actinidia rufa
1. Introduction
Kiwifruit (Actinidia chinensis Planchon) is one of the most recently domesticated specialty fruit crops and is currently grown commercially worldwide. The genus Actinidia (2n = 2x = 58 chromosomes) comprises 54 species and 75 taxa in total, and most of these species occur naturally in China.1 Most commercial cultivars were developed from a narrow pool of A. chinensis germplasm, and the current lack of genetic diversity makes kiwifruit vulnerable to new diseases and hinders cultivar improvement. The underexplored wild Actinidia germplasm has a wide range of desirable fruit characteristics and high potential for developing new kiwifruit cultivars. Interspecific hybridization is a proved approach to combine desirable traits from different species and surmount obstacles of paternal selection of dioecious plants, for example, ‘Jinyan’, a new cultivar bred by interspecific hybridization between Actinidia eriantha and A. chinensis, has excellent storage quality which is attributed to A. eriantha.2
The vast majority of flowering plants, including most crop plants, are hermaphroditic, but a small portion (6%) are dioecious with separate male and female plants. Dioecy likely evolves from hermaphrodite or monoecious ancestors by two mutations with the first causing male sterility and the second reducing female fertility.3 Dioecy can be controlled by individual gene (e.g. cucumis),4 or fully developed sex-specific regions or sex chromosomes as observed in papaya,5 pistachio,6 strawberry,7 and the model plant Silene.8 Kiwifruit is a functionally dioecious plant. Females bear flowers that are hermaphroditic in appearance but produce empty pollen, and male flowers have a rudimentary carpel that aborts before style elongation. Because it is dioecious, kiwifruit has an inevitable disadvantage in breeding; paternal parents are selected with unknown fruit quality since male plants cannot bear fruit.9 In a typical cross population, male plants represent 50% of the progeny that are a waste of breeding land and resources.10,11 In interspecific breeding programmes for dioecious plants, high-density genetic linkage maps of both maternal and paternal species are one of the most important tools for mapping important agricultural traits and marker assistant selection. However, few interspecific kiwifruit genetic maps have been generated, except a map constructed using microsatellite and amplified fragments length polymorphism (AFLP) markers from a cross between A. chinensis and Actinidia callosa.12 The sex-determination region (SDR) was mapped to a linkage group in A. callosa, but the relatively low marker density limited the practical use of marker-assisted selection or map-based gene cloning in the interspecific kiwifruit breeding programmes. Subsequently, more saturated genetic maps of A. chinensis were constructed with 644 simple sequence repeats (SSR) markers, and two sex-linked sequence characterized amplified region (SCAR) markers (SmX and SmY) were mapped to a shared linkage group.13,14 The SDR in kiwifruit was mapped to the subtelomere of LG17 using sex-specific SCAR markers,13 which corresponded to 25 chromosome (Supplementary Table S1). However, scoring the sex-specific markers SmX and SmY in a population of Actinidia rufa × A. chinensis revealed that they were not robust and amplified poorly across species which limited their utility for breeding. Sex-linked markers can reduce the time, labour, and costs associated with breeding programmes, and facilitate dissecting the sex-determination system.6 Recently, a high-density genetic map based on single-nucleotide polymorphism (SNP) markers was constructed between A. chinensis ‘Hongyang-MS-01’ (male) and A. chinensis × A. eriantha cv. ‘Jiangshanjiao’ (female) to order scaffolds in the kiwifruit draft genome assembly.15 However, ∼25% of the scaffolds are currently unanchored to the chromosome scale assembly.
Traditionally genotyping methods were expensive and labour intensive; recent advances in next-generation sequencing technologies have provided new opportunities for detecting a large number of DNA markers rapidly. Restriction-associated DNA (RAD) sequencing can produce dominant markers within the restriction sites and co-dominant markers adjacent to the restriction sites.16 Detection of DNA polymorphisms using next-generation RAD sequencing (RAD-seq) is efficient and requires no prior genome sequence knowledge for the species under investigation. Linkage maps for insects,17 fungi,18 and plants19 have been constructed using RAD-seq, with broad applications in most model and non-model organisms.20,21 Recently, sex-linked SNP markers in pistachio were identified through RAD-seq in an F1 segregating population, which was beneficial to cost-effective marker-assisted selection in breeding programmes.6 Here, we present high-density interspecific kiwifruit genetic maps based on SNP markers using RAD-seq. The high-density genetic maps are beneficial for kiwifruit breeding programmes and improving the kiwifruit draft genome assembly. The three sex-related markers developed in the SDR can accurately distinguish male and female plants, which can be utilized in kiwifruit breeding and commercial production for marker-assisted selection for sex.
2. Materials and methods
2.1. Plant material and DNA isolation
An F1 mapping population was generated by crossing A. rufa ‘MT570001’ and A. chinensis ‘Guihai No4’, and 174 F1 individuals consisting of 87 male progeny and 87 female progeny were selected for genotyping and mapping. Young leaf tissue of the parents and F1 individuals was harvested for genomic DNA extraction using the modified cetyltrimethylammonium bromide method.22
2.2. RAD library preparation and sequencing
A reduced representation restriction-associated DNA (RAD) sequencing method was used for library construction following the protocol outlined in Zhang et al.23 In brief, genomic DNA (1 µg) from each sample was digested for 15 min at 37°C in a 50 ml reaction with 20 units (U) of EcoRI (NEB, USA), which recognized a six-nucleotide sequence (5′G/AATTC3′). A modified Illumina P1 adapter containing specific nucleotide barcodes 4–8 bp long was using for sample tracking. After adapter ligation, individual libraries were pooled to equimolar concentrations with the exception of the parents which had 3× representation. DNA fragments were randomly sheared (Bioruptor Branson sonicator 450) to an average size of 500 bp, and sheared DNA fragments were run out on a 1% agarose gel (Sigma). DNA fragments in the range of 300–500 bp were isolated using the MinElute Gel Extraction Kit (Qiagen). The dsDNA ends end repaired, a 3′-adenine overhangs were added, and a modified Illumina P2 adapter was ligated. Finally, DNA products were PCR-amplified using Phusion Master Mix (NEB, USA), with 4 µM modified Solexa amplification primer mix (Illumina, USA) for 18 cycles. DNA library was sequenced by using the Illumina Hiseq2000 instrumentation.
2.3. SNP discovery and genotyping
Raw sequence reads were segregated by barcodes assigned to individuals and low-quality reads, and those that lacked a correct barcode were removed.24 The reads were first assigned to each individual by the unambiguous barcodes, and the reads without the unique barcodes were discarded. Reads were quality-filtered by discarding adapter pollutions and the reads containing >50% low-quality bases (quality value of ≤5) were removing. The quality-filtered RAD reads of each individual were mapped onto the kiwifruit repeat masked genome (Kiwifruit_pseudomolecule.masked.fa)15 with the alignment software SOAP2.25 Based on the alignment result, the RAD-based SNP calling was done by SOAPsnp.26 To minimize errors in calling markers, the consensus alignments with <5 or >100 sequences were discarded. Polymorphic markers between maternal and paternal parents were identified by pairwise grouping with a copy number of ≤1.5. The ratio of marker segregation was calculated by the χ2 test and markers showing significantly distorted segregation (P-value <0.01) were excluded from the map construction.
2.4. Construction of linkage maps
For linkage analysis, the double pseudo-test cross strategy was applied.27 The flower sex phenotype was mapped as a dominant marker ‘Sex-f’. The RAD-seq markers with >20% missing data were removed, then the ‘Sex-f’ marker and the remaining high-quality RAD-seq markers were used to construct a genetic map using the JoinMap 4.0 software with cross pollinated population type codes.28 The female and male linkage maps were created by maternal and paternal population nodes, respectively. Markers were assigned to linkage groups with an independence log-of-odds (LOD) score of 8.0. The genetic distances between loci and the recombination rate were calculated with Kosambi's function and the regression mapping algorithm with a recombination frequency threshold of 0.5. Markers that were physically within 100 kb of each other in the two parental maps were used to assess marker co-linearity between the maps. The markers between two parental genetic maps were linked using custom perl scripts, and Circos was used to visualize the collinearity of two parental maps.
2.5. Sex-related markers screening and verification
The assembled kiwifruit genome sequence and gene annotation were downloaded from the GenBank nucleotide core database.15 The MIcroSAtellite identification tool (MISA) program was used to identify microsatellite markers in the kiwifruit scaffolds, and dimers to hexamers of at least 22 bp in length were selected; primers were designed based on flank sequence using Primer 3 program. All 40 SSR markers in genic regions were screened in 10 male and 10 female plants from the mapping population, then sex-specific markers were validated by screening against the 174 F1 individuals and further tested in another population and 6 A. chinensis (‘Hongyang’, ‘Cuiyu’, ‘Guihai’, ‘Huaguang No2’, ‘QS-14’, and ‘QS-5’) and 3 A. rufa (‘Shanli 3’, ‘Shanli 4’, and ‘Shanli 5’) germplasm accessions. The PCR products were separated on 6% denaturing polyacrylamide gel. Candidate sex-determination genes were annotated using BLAST with a minimum e-value of 1e−04.
3. Results
3.1. RAD-seq and SNP discovering
A total of 176 RAD-seq libraries of two parents (A. rufa ‘MT570001’ and A. chinensis ‘Guihai No4’) and their 174 F1 offspring were constructed and sequenced using the Illumina HigSeq 2000 platform. After data trimming and filtering, 2,658 million clean reads remained, representing ∼231 Gb of sequences. The RAD-seq reads were deposited at NCBI with accession number PRJNA290688 (http://www.ncbi.nlm.nih.gov/bioproject/290688). RAD reads were sorted by individual based on the barcode information. The parental libraries had a combined 118 million filtered reads, and the 174 F1 offspring have a total of 2,540 million filtered reads with an average of 14.6 million reads per progeny. Among sequencing reads, 53.81% reads were mapped to the reference genome, and unique reads accounted for 92.94% of mapping reads. Most of the unmapped reads likely corresponded to repeat regions which were masked in the reference genome to prevent erroneous marker calls. The average sequencing depths of sequenced loci per parent and progeny were 30.35 and 20.25 fold, respectively (Supplementary Table S2). RAD tags from each individual were clustered and called for SNP markers after stringent selection following the protocol described in the Materials and Methods section. In total, 6,783 high-confidence SNPs across the 174 offspring were generated, including 2,479 heterozygous SNPs in A. rufa ‘MT570001’ and 4,304 heterozygous SNPs in A. chinensis ‘Guihai No4’.
3.2. Construction of the high-density genetic maps
We constructed two high-density genetic maps from an interspecific cross of A. rufa ‘MT570001’ × A. chinensis ‘Guihai No4’ using JoinMap 4.0, with an independence LOD score of 8.0. The A. rufa ‘MT570001’ (maternal) map consists of 2,426 SNP markers in 29 linkage groups (LGs) corresponding to the 29 haploid chromosomes. The marker names and positions for all loci in the 29 LGs of genetic map are listed in Supplementary Table S3. The total length of the A. rufa map is 2651.3 cM with an average distance of 1.09 cM between adjacent markers, and the genetic length for each LG ranged from 67.3 to 122.5 cM (Fig. 1 and Table 1). The A. chinensis ‘Guihai No4’ (paternal) map consists of 4,214 SNP markers in 29 LGs. The locus name and genetic map position for all SNP loci in the 29 LGs of genetic map are listed in Supplementary Table S4. The total length of the A. chinensis map is 3,142.4 cM with an average distance of 0.75 cM between adjacent markers, with linkage groups ranging from 72.4 to 151.7 cM in size (Fig. 2 and Table 1). The ‘Sex-f’ marker was mapped to the telomere of LG25 in A. chinensis map. It is notable that a few markers mapped on linkage groups were not located on the corresponding chromosomes compared with the kiwifruit draft genome.15
Figure 1.

The linkage groups of A. rufa. Genetic distance was shown by the vertical scale line with centimorgans (cM). The 29 linkage groups are displayed by the vertical bars with lines in each linkage group indicating a marker position. Black lines represented markers from assembled chromosomes sequences, and red lines represented markers from unassembled scaffold sequences. This figure is available in black and white in print and in colour at DNA Research online.
Table 1.
Summary of mapping result in A. rufa and A. chinensis genetic maps
| Linkage group |
A. rufa |
Linkage group |
A. chinensis |
||||||
|---|---|---|---|---|---|---|---|---|---|
| Marker no. | Size (cM) | Average distance (cM) | Marker on unanchored scaffolds | Marker no. | Size (cM) | Average distance (cM) | Marker on unanchored scaffolds | ||
| LG1 | 97 | 108.7 | 1.12 | 26 | LG1 | 148 | 108.7 | 0.73 | 31 |
| LG2 | 71 | 77.9 | 1.1 | 1 | LG2 | 96 | 105.6 | 1.1 | 12 |
| LG3 | 134 | 132 | 0.99 | 40 | LG3 | 270 | 147.6 | 0.55 | 59 |
| LG4 | 55 | 67.3 | 1.22 | 1 | LG4 | 111 | 72.4 | 0.65 | 8 |
| LG5 | 74 | 83.2 | 1.12 | 26 | LG5 | 145 | 88.9 | 0.61 | 21 |
| LG6 | 48 | 87.3 | 1.82 | 11 | LG6 | 153 | 129.4 | 0.85 | 31 |
| LG7 | 89 | 90.7 | 1.02 | 11 | LG7 | 146 | 113.3 | 0.78 | 24 |
| LG8 | 77 | 119.2 | 1.55 | 5 | LG8 | 187 | 136.1 | 0.73 | 35 |
| LG9 | 91 | 76.5 | 0.84 | 38 | LG9 | 146 | 103.6 | 0.71 | 80 |
| LG10 | 104 | 86.5 | 0.83 | 84 | LG10 | 168 | 104.5 | 0.62 | 116 |
| LG11 | 53 | 75.4 | 1.42 | 3 | LG11 | 112 | 95.7 | 0.85 | 19 |
| LG12 | 88 | 88.2 | 1 | 26 | LG12 | 114 | 101.4 | 0.89 | 51 |
| LG13 | 86 | 115 | 1.34 | 16 | LG13 | 158 | 136.4 | 0.86 | 11 |
| LG14 | 86 | 103.5 | 1.2 | 56 | LG14 | 165 | 108.8 | 0.66 | 111 |
| LG15 | 73 | 103 | 1.41 | 0 | LG15 | 169 | 106.5 | 0.63 | 4 |
| LG16 | 86 | 73.6 | 0.86 | 34 | LG16 | 135 | 82.1 | 0.61 | 51 |
| LG17 | 59 | 78.7 | 1.33 | 14 | LG17 | 89 | 101.3 | 1.14 | 33 |
| LG18 | 97 | 87.8 | 0.9 | 23 | LG18 | 82 | 132.9 | 1.62 | 42 |
| LG19 | 85 | 105.5 | 1.24 | 21 | LG19 | 118 | 112.5 | 0.95 | 24 |
| LG20 | 108 | 94.7 | 0.88 | 51 | LG20 | 174 | 112.5 | 0.65 | 78 |
| LG21 | 69 | 83.5 | 1.21 | 17 | LG21 | 116 | 110.1 | 0.95 | 14 |
| LG22 | 79 | 74.6 | 0.94 | 39 | LG22 | 176 | 83.4 | 0.47 | 119 |
| LG23 | 104 | 122.5 | 1.18 | 0 | LG23 | 230 | 151.7 | 0.66 | 8 |
| LG24 | 62 | 109.4 | 1.76 | 4 | LG24 | 136 | 120.4 | 0.89 | 8 |
| LG25 | 129 | 89.6 | 0.69 | 58 | LG25 | 154 | 97.8 | 0.63 | 44 |
| LG26 | 89 | 83.7 | 0.94 | 20 | LG26 | 176 | 99 | 0.56 | 32 |
| LG27 | 71 | 74.8 | 1.05 | 27 | LG27 | 104 | 78.9 | 0.76 | 45 |
| LG28 | 80 | 83.3 | 1.04 | 18 | LG28 | 107 | 92.2 | 0.86 | 17 |
| LG29 | 82 | 75.3 | 0.92 | 36 | LG29 | 129 | 108.7 | 0.84 | 59 |
| Total | 2,426 | 2651.3 | 1.09 | 706 | Total | 4,214 | 3142.4 | 0.75 | 1,187 |
Figure 2.

The linkage groups of A. chinensis. Genetic distance was shown by the vertical scale line with centimorgan (cM). The 29 linkage groups are displayed by the vertical bars with lines in each linkage group indicating a marker position. Black lines represented markers from assembled chromosomes sequences, and red lines represented markers from unassembled scaffold sequences. This figure is available in black and white in print and in colour at DNA Research online.
The high quality and density of the genetic maps allowed us to anchor and orient a number of scaffolds, which were previously unanchored in the kiwifruit draft genome. Among unmapped scaffolds, 228 scaffolds were anchored by 694 markers from A. rufa map, and 373 scaffolds were anchored by 1,187 markers from A. chinensis map. In total, 440 newly anchored genome scaffolds with 101 Mb were covered by the markers of the two genetic maps. The scaffold information of markers allowed us to assess the collinearity and accuracy of the genetic maps as well as integration of the two maps. The markers used to access collinearity were based on physical distances, including those mapped on conflicting chromosomes. The kiwifruit genetic maps are largely collinear, with all 29 LGs having shared scaffolds or genome sequences between the two maps (Figs 3 and 4 and Table 2).
Figure 3.

Collinearity between the A. rufa and A. chinensis genetic maps. Linkage groups for the A. rufa genetic map are colourized, and LGs for the A. chinensis are in grey. The two parental SNP markers that aligned to the genome scaffold within 100 kb were linked by coloured lines, with each colour corresponding to an A. rufa LG. ‘C’ and ‘R’ after each linkage group meant A. chinensis and A. rufa, respectively. This figure is available in black and white in print and in colour at DNA Research online.
Figure 4.
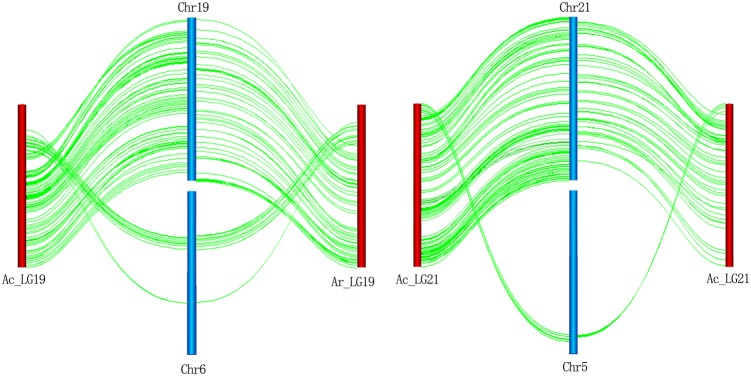
Markers were mapped on linkage groups that differed with corresponding assembled chromosomes. The chromosomes displayed by blue vertical bars are named beginning with ‘Chr’. Actinidia rufa linkage groups displaced by red vertical bars are named with ‘Ar_LG’, and A. chinensis linkage groups displaced by red vertical bars are named with ‘Ac_LG’. Green lines show links between linkage groups and corresponding chromosomes based on the marker position. This figure is available in black and white in print and in colour at DNA Research online.
Table 2.
Integration of two parental genetic maps using anchored markers on scaffolds or genome sequences
| A. rufa | No. of anchored markers | A. chinensis |
|---|---|---|
| Linkage group | Linkage group | |
| 1 | 126 | 1 |
| 2 | 54 | 2 |
| 3 | 304 | 3 |
| 4 | 102 | 4 |
| 5 | 93 | 5 |
| 6 | 65 | 6 |
| 7 | 133 | 7 |
| 8 | 127 | 8 |
| 9 | 160 | 9 |
| 10 | 209 | 10 |
| 11 | 76 | 11 |
| 12 | 110 | 12 |
| 13 | 128 | 13 |
| 14 | 205 | 14 |
| 15 | 144 | 15 |
| 16 | 147 | 16 |
| 17 | 62 | 17 |
| 18 | 90 | 18 |
| 19 | 92 | 19 |
| 20 | 282 | 20 |
| 21 | 74 | 21 |
| 22 | 125 | 22 |
| 23 | 214 | 23 |
| 24 | 87 | 24 |
| 25 | 210 | 25 |
| 26 | 202 | 26 |
| 27 | 104 | 27 |
| 28 | 71 | 28 |
| 29 | 90 | 29 |
3.3. Sex-specific marker identification and localization of the SDR
The subtelomeric region of chromosome 25 (0–5 Mb) was confirmed to be the SDR based on the physical position of markers close to ‘Sex-f’, consistent with the previous findings of Fraser et al. A total of 1,095 SSR markers in position 0–5 Mb were identified by MISA following the criteria outlined in the Materials and methods section. The SSR markers were thinned to eight per Mb and 40 genic SSR markers were screened. All 40 SSR markers in the 0–5 Mb region were screened in 10 male and 10 female plants from the mapping population, of which 12 SSR markers were polymorphic in 20 lines tested, and only three SSR markers presented distinct bands for sex identification (Table 3). The three sex-specific markers were further validated by screening against the 174 F1 individuals, and the results showed that they could clearly distinguish male and female individuals, respectively. A001 amplifies a 202-bp fragment in female individuals with no product in male individuals, and A002 and A003 produce diverse bands between the male and female plants. Furthermore, the three sex-specific SSR markers were validated in another set of individuals crossed by A. rufa and A. chinensis, and also in 6 A. chinensis (‘Hongyang’, ‘Cuiyu’, ‘Guihai’, ‘Huaguang No2’, ‘QS-14’, and ‘QS-5’) and 3 A. rufa (‘Shanli 3’, ‘Shanli 4’, and ‘Shanli 5’) germplasm accessions. All three markers can be used to accurately sex type in another interspecific cross. The A003 marker could distinguish all A. chinensis and A. rufa samples, and A001 marker could identify A. rufa plants, and combining A001 and A002 could also be used to sex type all A. chinensis and A. rufa samples. The positions of three SSR markers were located in 1–2 Mb on chromosome 25, which narrowed down the SDR to this 1 Mb region. The genotypes of three SSR markers were added to the database for grouping and mapping to the linkage group. All three SSR markers were closely adjacent to sex-determination locus, and the minimum genetic distance between ‘sex-f’ and SSR marker is 0.9 cM (Supplementary Fig. S1).
Table 3.
Sex-related markers information
| Marker | Primer-F | Primer-R | Size of products (bp) |
Gene ID | Position on chromosome 25 | Gene function | |
|---|---|---|---|---|---|---|---|
| Female | Male | ||||||
| A001 | TCAATGCATTTAGACA TTCCTTTGTCCA | TGGGTAAACATAA CCACATGCCAAC | 202 | 0 | Achn098711 | 1,541,845–1,542,047 | RNA-binding protein, putative; contains IPR001876 (Zinc finger, RanBP2-type), IPR012677 (nucleotide-binding, alpha-beta plait) |
| A002 | TACTGACGGTCACT CCCTAATCCC | CATGGATGGAACTG GTGGAGGAAG | 219 | 230 | Achn098721 | 1,612,522–1,612,771 | Oxidoreductase, 2OG-Fe(II) oxygenase family protein; contains IPR027450 (alpha-ketoglutarate-dependent dioxygenase AlkB-like) |
| A003 | GCAAGCGGGGGTAAA TTTGTACAG | GGATAGGAGGAGC TTTACGGACCT | 304 | 287 | Achn342741 | 1,899,177–1,899,503 | Ribosome-recycling factor; contains IPR002661 (ribosome-recycling factor), IPR023584 (ribosome-recycling factor domain), IPR024946 (arginine repressor C-terminal-like domain) |
The SDR region is subtelomeric and has a much lower gene density than the genome-wide average with mere 150 genes across the 5-Mb region. Despite the low gene density, the SDR region is enriched for genes involved in reproduction and it contains several candidate sex-determination genes. Among these are Achn342721, a homologue to FBL17 in Arabidopsis with an e-value of 8e−04, which is essential for male fertility and germ line proliferation29 and Achn226501, a homologue of Caleosin, which is involved in lipid storage in maturing seeds with an e-value of 1e−79.
4. Discussion
Although a number of AFLP markers were developed to create linkage map for anchoring genome scaffolds,30 screening traditional non-informative DNA markers, such as AFLP, RAPD, and ISSR, is a labour intensive, expensive, and low-throughput process that is unsuitable for aiding in the genome assembly. Fortunately, the advent of RAD-seq has overcome these problems, providing a cost-effective, high-throughput, automated protocol for identifying SNP markers. Using this method, a genetic map of kiwifruit was constructed to aid in the kiwifruit genome assembly using an F1 population of A. chinensis.15 Except for A. chinensis, few genetic and genomic resources are available for other Actinidia species which are especially problematic, given the limited diversity of useful kiwifruit germplam. Actinidia rufa native to China, Korea, and Japan is characterized by disease resistance, high yield, excellent storage, and other numerous good fruit traits. The high-density genetic map of A. rufa presented here is a useful prerequisite for quantitative trait locus mapping and marker-assisted breeding to facilitate identification of new desirable traits.
The A. chinensis genetic map had a higher marker density than the A. rufa map, with 4,215 markers in 29 linkage groups, spanning 3,142.4 cM. In comparison, the A. rufa map contained 2,426 markers with 29 linkage groups spanning over 2,651.3 cM. The higher marker density suggests that A. chinensis may have higher within genome heterozygosity than A. rufa. The lower nucleotide diversity in A. rufa is likely because it naturally occurs in a narrow geographic area (Taiwan in China, Korea, and Japan), which probably has an independent evolutionary and geographic origin. Moreover, A. rufa may have more sequence divergence that would result in fewer shared restriction sites and thus less mapable markers obtained. The accuracy of genetic maps can be estimated by comparing the collinearity between the two maps. Comparison of marker positions between the two maps revealed a high degree of collinearity; almost all 29 linkage groups are collinear on corresponding chromosomes between both maps, which positively supported the reliability of marker order in genetic maps.
Owing to large population size and high sequencing depth, abundant SNP markers were developed in a high-density genetic map, which was greatly beneficial to the kiwifruit genome assembly. Population size is a strong confounding factor of LD measurement, smaller populations have less variation, and lower recombination rates could be detected.31 We constructed a high-density genetic map using an interspecific population with 174 individuals, 1.6 times more than those (108 individuals) employed for map construction in previous research.15 The significant genetic differences between parents and large size of the population facilitated to identify more SNPs. Moreover, the average sequencing depth of sequenced loci per progeny in these maps is 20.25 fold, almost two times more than that (10.73 fold) in Huang's study. In the previous map, SNP calling and genotyping were mainly depended on the parental data due to lack of a kiwifruit reference genome, which limited the number of useful markers. The previous mean marker density is 1.28 cM per marker, and 3,379 markers were aligned to the assembled scaffolds.15 By comparison, we generated 2,426 and 4,214 SNP markers in the maternal and paternal maps with average marker distance 1.09 and 0.75 cM, respectively. The higher marker density allowed some previously unmapped scaffolds to be anchored. Roughly 440 unmapped scaffolds from the kiwifruit reference genome totalling 101 Mb were anchored to chromosomes; 228 and 373 unmapped scaffolds were anchored on A. rufa and A. chinensis map, respectively. The new anchored scaffolds considerably improved the kiwifruit genome assembly.
It is notable that a few markers mapped on linkage groups were differed with the corresponding assembled chromosomes. Multiple-clustered markers on chromosome 6 and chromosome 5 were re-mapped on linkage groups (chromosomes) 19 and 21 on both parental maps, which reconfirmed the high reliability of the genetic maps. It is possible that entire scaffolds were misplaced, which is common in draft genome assemblies.32 We assumed that scaffolds were assembled correctly, then interchromosomal rearrangement appeared in both A. chinensis (paternal) and A. rufa (maternal). Thus, it is contradictory that interchromosomal rearrangement occurred in interspecific A. rufa and A. chinensis, rather than the intraspecific A. chinensis cv. ‘Guihai No4’ and A. chinensis cv. ‘Hongyang’ genome. Much higher synteny with interspecific plants than intraspecific plants suggested that it was likely assembly errors rather than true genomic rearrangements.33 Moreover, if genome interchromosomal rearrangement was so rampant, we would expect to detect at least one between A. rufa and A. chinensis. Genome assemblies were imperfect and genomic rearrangements seem to be more common than they really are due to assembly errors.34 Upon integrating physical and genetic maps of the apple, homoeologous chromosome pairs and multiple locus markers on the same chromosome were detected.35 These genome-wide and segmental duplications in the genome were likely to cause assembly errors. Besides assembly errors, some inconsistencies among marker positions were attributed either to structural variations within the genome or among mapping populations, or genotyping technical errors.36 The kiwifruit genome could be considerably improved by means of correcting misplaced scaffolds and increasing new anchored scaffolds.
Roughly 6% of flowering plants are dioecious with separate male and female plants, and dioecy has evolved independently numerous times.37 Dioecy can be controlled by simple mechanisms such as a single gene with two independent mutations or more complex mechanisms such as sex chromosomes. Two sex-determinant genes were mapped on a common linkage group in wild strawberry, and recombination between them resulted in male, female, hermaphrodite, and neuter progeny.38 Kiwifruit has an SDR that behaves like an XY chromosome pair with presumably two linked genes controlling sex.14,39 One gene likely controls carpel abortion which happens near inception in male flowers and the second gene controls pollen sterility as female flowers produce empty pollen grains.40 The sex-related marker ‘Sex-f’ was mapped on the telomere of LG25 in male map, while failed to map on female map. The similar results appeared on kiwifruit maps using AFLP markers in A. chinensis × A. callosa and using SSR markers in A. chinensis × A. chinensis due to the gap in female map or the low recombination of sexual chromosomes.12,13 We constructed the higher density female genetic map with the average marker distance of 0.69 cM in LG25; therefore, it is possible that recombination suppression led to no markers mapping on the female sex chromosome.
We produced three additional SSR markers in the SDR that can be used to accurately sex type male and female plants, which has both commercial and breeding applications. The SCAR markers, SmX and SmY, were available to identify sex type in A. chinensis, but had limited use in sex typing interspecific seedlings. The SCAR markers relied on more specific sequences, which usually cause the failure of interspecific amplification, whereas SSR markers in the genic region were more stable than SCAR marker because of gene conservation. Three sex-related SSR markers were selected on genes in 0–5 Mb on chromosome 25; their predicted function was RNA-binding protein, oxidoreductase, and Ribosome-recycling factor, respectively (Table 3). Because of its subtelomeric position, the SDR is remarkably gene poor and contains 150 genes over the ∼5 Mb region. SDR regions in plants tend to be pericentric as is the case of papaya41 or telomeric as seen in poplar,42 as these regions typically have lower rates of recombination which allows the fixation of sex-determination loci. The SDR in kiwifruit has several genes, which may be involved in sex determination including a homologue of FBL17 in Arabidopsis, which is essential for male fertility and germ line proliferation.29 Mapping the SDR region will help expedite the discovery of the sex-determination genes in kiwifruit, which will allow the development of true breeding hermaphrodite varieties.
Supplementary data
Supplementary data are available at www.dnaresearch.oxfordjournals.org.
Funding
This project was supported by the National Natural Science Foundation of China (grants no. 31301749) and Wuhan Applied Basic Research Project (2015020101010075). Funding to pay the Open Access publication charges for this article was provided by the National Natural Science Foundation of China (Grants No. 31301749).
Supplementary Material
References
- 1.Li J., Li X., Soejarto D.. 2007, Actinidiaceae/Flora of China, vol. 12 Science Press: Beijing; Missouri Botanical Gardens: St. Louis, Missouri, p. 334–60. [Google Scholar]
- 2.Zhong C., Wang S., Jiang Z., Huang H.. 2012, ‘Jinyan’, an interspecific hybrid kiwifruit with Brilliant Yellow Flesh and Good Storage Quality, HortScience, 47, 1187–90. [Google Scholar]
- 3.Charlesworth B. 1991, The evolution of sex chromosomes, Science, 251, 1030–3. [DOI] [PubMed] [Google Scholar]
- 4.Kater M.M., Franken J., Carney K.J., Colombo L., Angenent G.C.. 2001, Sex determination in the monoecious species cucumber is confined to specific floral whorls, Plant Cell, 13, 481–93. [DOI] [PMC free article] [PubMed] [Google Scholar]
- 5.Liu Z., Moore P.H., Ma H. et al. 2004, A primitive Y chromosome in papaya marks incipient sex chromosome evolution, Nature, 427, 348–52. [DOI] [PubMed] [Google Scholar]
- 6.Kafkas S., Khodaeiaminjan M., Güney M., Kafkas E.. 2015, Identification of sex-linked SNP markers using RAD sequencing suggests ZW/ZZ sex determination in Pistacia vera L., BMC Genomics, 16, 98. [DOI] [PMC free article] [PubMed] [Google Scholar]
- 7.Spigler R., Lewers K., Main D., Ashman T.. 2008, Genetic mapping of sex determination in a wild strawberry, Fragaria virginiana, reveals earliest form of sex chromosome, Heredity, 101, 507–17. [DOI] [PubMed] [Google Scholar]
- 8.Mrackova M., Nicolas M., Hobza R. et al. 2008, Independent origin of sex chromosomes in two species of the genus Silene, Genetics, 179, 1129–33. [DOI] [PMC free article] [PubMed] [Google Scholar]
- 9.Huang H. 2002, The Genus of Actinidia: A Word Monograph. Beijing: Science Press, p. 34–6. [Google Scholar]
- 10.McNeilage M., Steinhagen S.. 1998, Flower and fruit characters in a kiwifruit hermaphrodite, Euphytica, 101, 69–72. [Google Scholar]
- 11.Ferguson A.R., Huang H.. 2007, Genetic resources of kiwifruit: domestication and breeding, Hortic. Rev., 33, 1–121. [Google Scholar]
- 12.Testolin R., Huang W., Lain O., Messina R., Vecchione A., Cipriani G.. 2001, A kiwifruit (Actinidia spp.) linkage map based on microsatellites and integrated with AFLP markers, Theor. Appl. Genet., 103, 30–6. [Google Scholar]
- 13.Fraser L.G., Tsang G.K., Datson P.M. et al. 2009, A gene-rich linkage map in the dioecious species Actinidia chinensis (kiwifruit) reveals putative X/Y sex-determining chromosomes, BMC Genomics, 10, 102. [DOI] [PMC free article] [PubMed] [Google Scholar]
- 14.Gill G., Harvey C., Gardner R., Fraser L.. 1998, Development of sex-linked PCR markers for gender identification in Actinidia, Theor. Appl. Genet., 97, 439–45. [Google Scholar]
- 15.Huang S., Ding J., Deng D. et al. 2013, Draft genome of the kiwifruit Actinidia chinensis, Nat. Commun., 4. [DOI] [PMC free article] [PubMed] [Google Scholar]
- 16.Pfender W., Saha M., Johnson E., Slabaugh M.. 2011, Mapping with RAD (restriction-site associated DNA) markers to rapidly identify QTL for stem rust resistance in Lolium perenne, Theor. Appl. Genet., 122, 1467–80. [DOI] [PubMed] [Google Scholar]
- 17.Baxter S.W., Davey J.W., Johnston J.S. et al. 2011, Linkage mapping and comparative genomics using next-generation RAD sequencing of a non-model organism, PLoS ONE, 6, e19315. [DOI] [PMC free article] [PubMed] [Google Scholar]
- 18.Lewis Z.A., Shiver A.L., Stiffler N., Miller M.R., Johnson E.A., Selker E.U.. 2007, High-density detection of restriction-site-associated DNA markers for rapid mapping of mutated loci in Neurospora, Genetics, 177, 1163–71. [DOI] [PMC free article] [PubMed] [Google Scholar]
- 19.Ren Y., McGregor C., Zhang Y. et al. 2014, An integrated genetic map based on four mapping populations and quantitative trait loci associated with economically important traits in watermelon (Citrullus lanatus), BMC Plant Biol., 14, 33. [DOI] [PMC free article] [PubMed] [Google Scholar]
- 20.Chutimanitsakun Y., Nipper R.W., Cuesta-Marcos A. et al. 2011, Construction and application for QTL analysis of a restriction site associated DNA (RAD) linkage map in barley, BMC Genomics, 12, 4. [DOI] [PMC free article] [PubMed] [Google Scholar]
- 21.Shao C., Niu Y., Rastas P. et al. 2015, Genome-wide SNP identification for the construction of a high-resolution genetic map of Japanese flounder (Paralichthys olivaceus): applications to QTL mapping of Vibrio anguillarum disease resistance and comparative genomic analysis, DNA Res., 22, 161–70. [DOI] [PMC free article] [PubMed] [Google Scholar]
- 22.Doyle J.J. 1990, Isolation of plant DNA from fresh tissue, Focus, 12, 13–5. [Google Scholar]
- 23.Zhang Q., Li L., VanBuren R. et al. 2014, Optimization of linkage mapping strategy and construction of a high-density American lotus linkage map, BMC Genomics, 15, 372. [DOI] [PMC free article] [PubMed] [Google Scholar]
- 24.Emerson K.J., Merz C.R., Catchen J.M. et al. 2010, Resolving postglacial phylogeography using high-throughput sequencing, Proc. Natl. Acad. Sci., 107, 16196–200. [DOI] [PMC free article] [PubMed] [Google Scholar]
- 25.Li R., Yu C., Li Y. et al. 2009, SOAP2: an improved ultrafast tool for short read alignment, Bioinformatics, 25, 1966–7. [DOI] [PubMed] [Google Scholar]
- 26.Li R., Li Y., Fang X. et al. 2009, SNP detection for massively parallel whole-genome resequencing, Genome Res., 19, 1124–32. [DOI] [PMC free article] [PubMed] [Google Scholar]
- 27.Grattapaglia D., Sederoff R.. 1994, Genetic linkage maps of Eucalyptus grandis and Eucalyptus urophylla using a pseudo-testcross: mapping strategy and RAPD markers, Genetics, 137, 1121–37. [DOI] [PMC free article] [PubMed] [Google Scholar]
- 28.Van Ooijen J. 2006, JoinMap 4. Software for the Calculation of Genetic Linkage Maps in Experimental Populations. Kyazma BV: Wageningen, Netherlands. [Google Scholar]
- 29.Kim H.J., Oh S.A., Brownfield L. et al. 2008, Control of plant germline proliferation by SCFFBL17 degradation of cell cycle inhibitors, Nature, 455, 1134–7. [DOI] [PubMed] [Google Scholar]
- 30.de Boer J.M., Borm T.J., Jesse T. et al. 2011, A hybrid BAC physical map of potato: a framework for sequencing a heterozygous genome, BMC Genomics, 12, 594. [DOI] [PMC free article] [PubMed] [Google Scholar]
- 31.Serre D., Nadon R., Hudson T.J.. 2005, Large-scale recombination rate patterns are conserved among human populations, Genome Res., 15, 1547–52. [DOI] [PMC free article] [PubMed] [Google Scholar]
- 32.Tennessen J.A., Govindarajulu R., Ashman T.-L., Liston A.. 2014, Evolutionary origins and dynamics of octoploid strawberry subgenomes revealed by dense targeted capture linkage maps, Genome Biol. Evol., 6, 3295–313. [DOI] [PMC free article] [PubMed] [Google Scholar]
- 33.Kai W., Kikuchi K., Tohari S. et al. 2011, Integration of the genetic map and genome assembly of fugu facilitates insights into distinct features of genome evolution in teleosts and mammals, Genome Biol. Evol., 3, 424–42. [DOI] [PMC free article] [PubMed] [Google Scholar]
- 34.Lin Y., Li J., Shen H., Zhang L., Papasian C.J.. 2011, Comparative studies of de novo assembly tools for next-generation sequencing technologies, Bioinformatics, 27, 2031–7. [DOI] [PMC free article] [PubMed] [Google Scholar]
- 35.Han Y., Zheng D., Vimolmangkang S., Khan M.A., Beever J.E., Korban S.S.. 2011, Integration of physical and genetic maps in apple confirms whole-genome and segmental duplications in the apple genome, J. Exp. Bot., 62, 5117–30. [DOI] [PMC free article] [PubMed] [Google Scholar]
- 36.Khan M.A., Han Y., Zhao Y.F., Troggio M., Korban S.S.. 2012, A multi-population consensus genetic map reveals inconsistent marker order among maps likely attributed to structural variations in the apple genome, PLoS ONE, 7, e47864. [DOI] [PMC free article] [PubMed] [Google Scholar]
- 37.Renner S.S., Ricklefs R.E.. 1995, Dioecy and its correlates in the flowering plants, Am. J. Bot., 82, 596–606. [Google Scholar]
- 38.Ming R., Bendahmane A., Renner S.S.. 2011, Sex chromosomes in land plants, Ann. Rev. Plant Biol., 62, 485–514. [DOI] [PubMed] [Google Scholar]
- 39.Harvey C., Gill G., Fraser L., McNeilage M.. 1997, Sex determination in Actinidia. 1. Sex-linked markers and progeny sex ratio in diploid A. chinensis, Sex. Plant Reprod., 10, 149–54. [Google Scholar]
- 40.Jamilena M., Mariotti B., Manzano S.. 2007, Plant sex chromosomes: molecular structure and function, Cytogenet Genome Res., 120, 255–64. [DOI] [PubMed] [Google Scholar]
- 41.Wang J., Na J.-K., Yu Q. et al. 2012, Sequencing papaya X and Yh chromosomes reveals molecular basis of incipient sex chromosome evolution, Proc. Natl. Acad. Sci., 109, 13710–15. [DOI] [PMC free article] [PubMed] [Google Scholar]
- 42.Yin T., DiFazio S.P., Gunter L.E. et al. 2008, Genome structure and emerging evidence of an incipient sex chromosome in Populus, Genome Res., 18, 422–30. [DOI] [PMC free article] [PubMed] [Google Scholar]
Associated Data
This section collects any data citations, data availability statements, or supplementary materials included in this article.