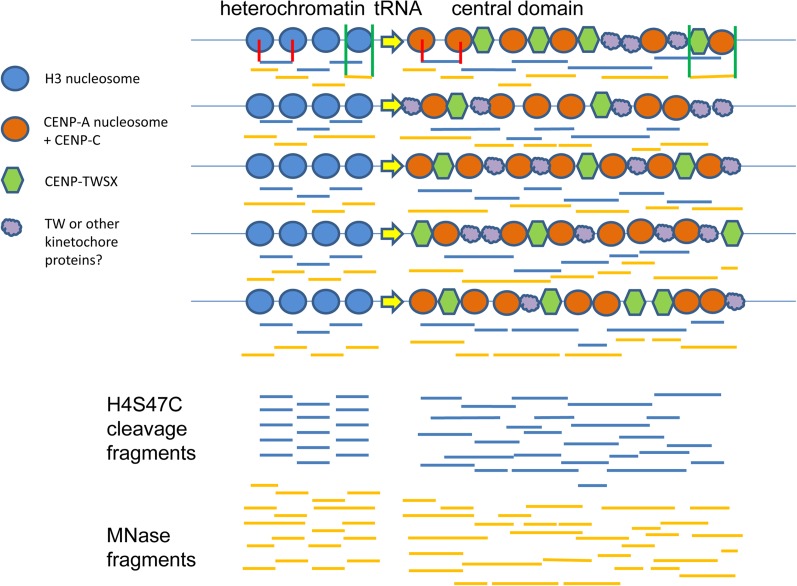
Figure 10.
Model of centromeric chromatin. H3- and CENP-A-containing nucleosomes are shown at the tRNA boundary of the central domain for five different cells. H4S47C-mediated cleavage nucleosome-to-nucleosome fragments are shown as horizontal blue lines. Red vertical lines show how the fragments correspond to nucleosomes for one nucleosome pair in heterochromatin and one in the central domain. MNase-generated fragments are depicted with amber horizontal lines. Green vertical lines indicate their correspondence to chromatin proteins for one nucleosome in heterochromatin and for a CENP-A nucleosome complexed with a CENP-TWSX tetramer.

