Abstract
Due to their antifungal, antibacterial, antiviral, and antimicrobial properties, silver nanoparticles (AgNPs) are used in consumer products intended for use by children or in the home. Children may be especially affected by the normal use of consumer products because of their physiological functions, developmental stage, and activities and behaviors. Despite much research to date, children’s potential exposures to AgNPs are not well characterized. Our objectives were to characterize selected consumer products containing AgNPs and to use the data to estimate a child’s potential non-dietary ingestion exposure. We identified and cataloged 165 consumer products claiming to contain AgNPs that may be used by or near children or found in the home. Nineteen products (textile, liquid, plastic) were selected for further analysis. We developed a tiered analytical approach to determine silver content, form (particulate or ionic), size, morphology, agglomeration state, and composition. Silver was detected in all products except one sippy cup body. Among products in a given category, silver mass contributions were highly variable and not always uniformly distributed within products, highlighting the need to sample multiple areas of a product. Electron microscopy confirmed the presence of AgNPs. Using this data, a child’s potential non-dietary ingestion exposure to AgNPs when drinking milk formula from a sippy cup is 1.53 μg Ag/kg. Additional research is needed to understand the number and types of consumer products containing silver and the concentrations of silver in these products in order to more accurately predict children’s potential aggregate and cumulative exposures to AgNPs.
Keywords: Children, Nanosilver, Consumer products, Inventory, Exposure
Introduction
Silver nanoparticles (AgNP) are the most common nanomaterial found in consumer products because of their antifungal, antibacterial, antiviral, and antimicrobial properties. They are reportedly being used in many different types of consumer products intended for use by children and/or in the home, including baby bottles, pacifiers, plush toys, blankets, clothing, paints and coatings, and cleaning products (Benn et al., 2010; Klaine et al., 2008; Morones et al., 2005; Project on Emerging Nanotechnologies, 2014; Sun et al., 2005; Wijnhoven et al., 2009; Weir et al., 2008; Yoon et al., 2008).
Because many different types of consumer products contain AgNPs, it is important to understand their release from products, their potential for human exposure, and their environmental fate and effects. Few studies have evaluated the release of AgNPs from consumer products found in the residential environment to better understand their potential for human exposure. One set of leaching experiments by Quadros et al. (2013) reported that among 13 products selected for testing, fabrics, a plush toy, and cleaning products were most likely to release silver, resulting in the potential for human exposure.
Most studies reported in the literature have focused on release to the environment and ecological effects (Benn and Westerhoff, 2008; Benn et al., 2010; Cleveland et al., 2012; Farkas et al., 2011; Hagendorfer et al., 2010; Quadros and Marr, 2011; Som et al., 2011). For example, Benn et al. (2010) evaluated the likelihood of several different consumer products (shirt, medical mask and cloth, toothpaste, shampoo, detergent, towel, teddy bear, two humidifiers) to release AgNPs into environmental media (air, water, soil) when washed with water. Silver was released in quantities up to 45 μg Ag/g product, and scanning electron microscopy confirmed the presence of AgNPs in most of the products evaluated, as well as the wash water. Earlier, Benn and Westerhoff (2008) evaluated the release of silver from socks and its fate in waste water treatment plants. Cleveland et al. (2012) evaluated the environmental impact of AgNP-containing consumer products (wound dressing, sock, teddy bear) on an estuarine mesocosm system. Numerous in vitro studies have shown that AgNPs are toxic to viruses (Xiang et al., 201 ), bacteria (Choi and Hu, 2009), aquatic and soil organisms (Griffitt et al., 2008; Hayashi et al., 2012; Navarro et al., 2008; Roh et al., 2009), and mouse, rat, and human cells (Arora et al., 2009; Braydich-Stolle et al., 2005; Hussain et al., 2005; Mukherjee et al., 2012). A mini-review by de Lima et al. (2012) discussed the in vivo cytotoxicity and genotoxicity of AgNPs in different organisms, including Daphnia, fish, rats, and mice. Despite these research efforts, children’s potential exposures to AgNPs are not well characterized.
Children may be especially affected by the normal use of consumer products designed specifically for them (e.g., milk bottles, pacifiers, toys) or used in home environments (e.g., cleaners, paints, coatings) due to their physiological functions, developmental stage, and activities and behaviors. All of these, as well as other factors, may influence their exposure to agents found in their environment (Cohen Hubal et al., 2000). The use of AgNPs in consumer products used in the home has resulted in the need to evaluate children’s potential exposures to AgNPs through the dermal, ingestion, and inhalation routes of exposure.
In 2010, the U.S. Consumer Product Safety Commission (CPSC) entered into inter-agency agreements with the U.S. Environmental Protection Agency (EPA) and the U.S. National Institute for Occupational Safety and Health (NIOSH) in response to the Commission’s interest in developing reliable methods for quantifying and characterizing the release of AgNPs from commercially available products within its jurisdiction. EPA, in turn, teamed with Virginia Tech and NIOSH researchers to perform the work reported in this manuscript.
The objectives of this research project were to develop tools, approaches, and protocols to characterize selected consumer products containing AgNPs and to use the data to estimate a child’s potential non-dietary ingestion exposure to AgNPs. In this manuscript we describe the product inventory and a tiered analytical strategy to detect and characterize AgNPs in a variety of consumer products.
Materials and methods
Product inventory
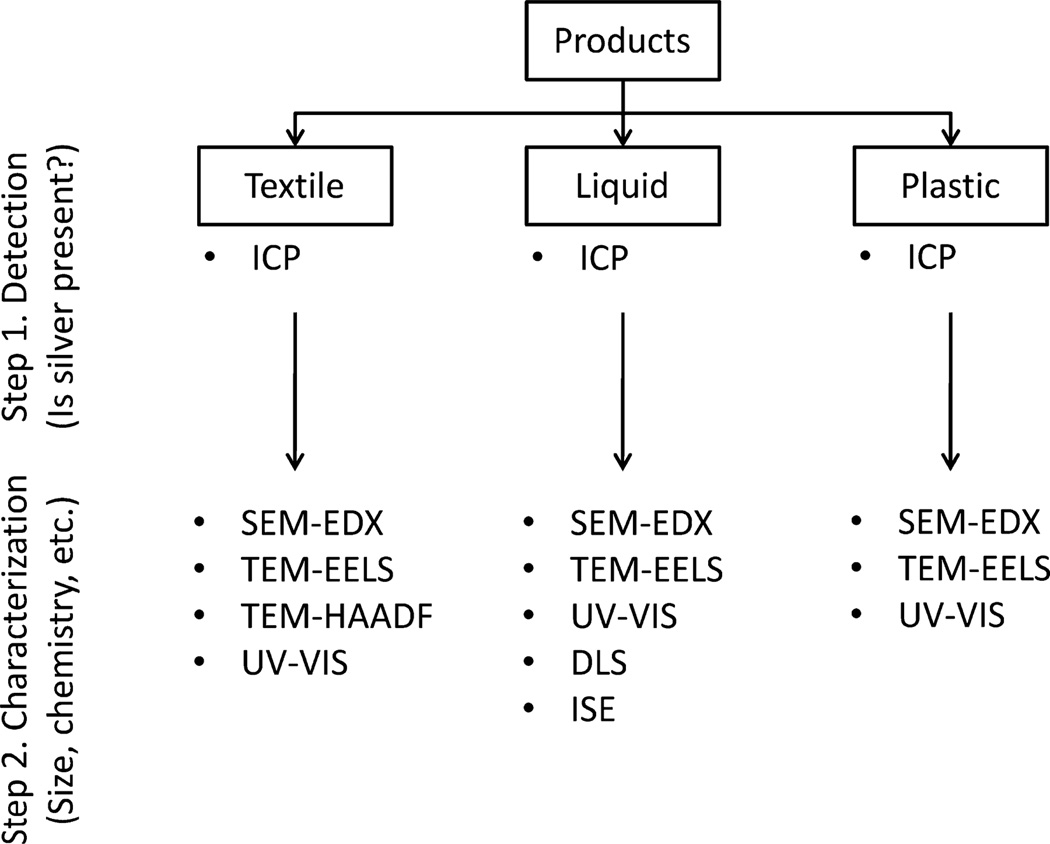
Through a search of the Internet, peer-reviewed literature, direct marketing, and The Project on Emerging Nanotechnologies database (Project on Emerging Nanotechnologies, 2014), we identified and cataloged 165 consumer products claiming to contain AgNPs that may be used by or near children or found in the home. Each agency worked independently to create a database and then worked with CPSC to prioritize products within CPSC’s jurisdiction that should be included for further testing. Once a product was selected and obtained, each agency independently used a tiered approach (illustrated in Fig. 1) to answer the following questions. For a given product, does it contain silver? If the answer was yes, we then asked whether the form was particulate or ionic. If the silver was particulate, we characterized it to determine the size, morphology, agglomeration state, and chemical composition. In our studies, we used multiple complementary and confirmatory techniques to characterize the silver content of textiles, liquids, and plastics, including inductively coupled plasma (ICP) spectroscopy (mass and atomic emission), electron microscopy (scanning (SEM)/transmission (TEM)), energy dispersive X-ray analysis (EDX), electron energy loss spectroscopy (EELS), high-angle annular dark-field microscopy (HAADF), UV−vis absorption spectroscopy, dynamic light scattering (DLS), and ion selective electrode (ISE) detection (Fig. 1).
Fig. 1.
Tiered approach for the analysis of consumer products for AgNPs.
We identified 165 consumer products as potentially containing AgNPs. In consultation with CPSC, we selected 19 products for further analysis. These products were classified as a children’s toy (1), personal care product (1), textiles (8), storage containers (2), household cleaning products (5), dietary supplement (1), or control particles (1) for which characterization information was provided by the manufacturer. To report results from our analyses, the products were grouped by their physical matrix (textile, liquid, or plastic) rather than by their intended function. In addition, two products (t-shirt and toothbrush) that did not contain AgNPs were included in the analyses for quality control.
Chemical analysis for detection of total silver
Because no legislation in the United States regulates or requires labeling of products to disclose the presence of AgNPs, it is possible that some products claiming to be nano-enabled do not actually contain nanomaterials (and that other products not labeled nano-enabled could be nano-enabled). Thus, the first step was to verify the presence of silver in the selected consumer products. In this study, we selected inductively coupled plasma (ICP) spectroscopy to detect the presence of silver in products because it is a robust, sensitive, and relatively inexpensive detection method that is widely available. We used thermally assisted nitric acid sample digestion followed by quantification using ICP-MS (mass spectrometry) and ICP-AES (atomic emission spectroscopy). Details of the analytical techniques used to characterize the silver content for each matrix type are summarized in Table 1.
Table 1.
Summary of detection and characterization methods used to evaluate silver content of consumer products.
| Matrix | Techniqueb | Sample preparation and analysisa |
|
|---|---|---|---|
| EPA | NIOSH | ||
| Textile | ICP |
|
|
| SEM |
|
|
|
| TEM |
|
- | |
| UV–vis |
|
|
|
| Liquids | ICP |
|
|
| SEM | - |
|
|
| TEM |
|
|
|
| UV–vis |
|
|
|
| DLS |
|
|
|
| ISE | - |
|
|
| Plastics | ICP |
|
- |
| SEM |
|
- | |
HNO3, nitric acid; H2O2, hydrogen peroxide; HCl, hydrochloric acid; MDL, method detection limit; TEPC, track-etched polycarbonate; NaCl, sodium chloride; NaNO3, sodium nitrate; -, matrix not evaluated.
ICP, inductively coupled plasma (AES, atomic emission spectroscopy; MS, mass spectroscopy); SEM, scanning electron microscopy; TEM, transmission electron microscopy; UV-vis, ultraviolet-visible absorption spectroscopy; DLS, dynamic light scattering (photon correlation spectroscopy); ISE, ion selective electrode.
Electron microscopy methods
Silver particle size was measured using the freely available ImageJ software (http://rsbweb.nih.gov/ij/download.html). A thermal ashing approach was used to isolate particles for electron microscopy analysis. Details of the electron microscopy techniques used to measure the size of the silver particles for each matrix type are summarized in Table 1.
Results and discussion
Detection of silver in selected consumer products
The total silver content of the selected textile, plastic, and liquid products, as determined by ICP, is summarized in Tables 2–4, respectively. Silver was detected in all textile and liquid products and in all plastic products, except one sippy cup body. Among products in a given category, silver mass contributions were highly variable, as shown by the large concentration ranges reported in Tables 2–4. For example, among textile products, the total silver content ranged from 4 to 1100 mg/kg (Table 2); and for plastic products, the content spanned from <1 to >800 mg/kg (Table 3). The least variation in total silver content was observed for the liquid products (Table 4), whose concentrations were similar to those reported by the manufacturer.
Table 2.
Silver content and size for selected textile products.
| Product type | Product | Total Ag ICP (mg/kg) (mean ± standard deviation) |
Size and/or composition by SEM/EDX |
Size by TEM/EDX (nm) |
Size by UV−vis (nm) |
|---|---|---|---|---|---|
| Bandage | Wound dressing | 1133 ±82 | Micron aggregates Ag |
NA | 593–616 |
| Bandage | 7-Day wound dressing | 627 ±67 | Micron aggregates Ag |
NA | 593–616 |
| Fabric | Underwear | 1095 ±292 | 83 ±37 nm particles EDX-Ag |
NA | 425–430 |
| Fabric | Baby blanket | 108±3 | 100 nm | 30 (ashed) | NPD |
| Fabric | Gloves | 7–1070 | EDX-Ca, S | 300–500 (ashed) | 414–416 (weak) |
| Fabric | Pants | 4± 1 | Bumps | NA | 461 |
| Wipes | Surface wipes | 4.5 ± 8.9 | EDX-Ca, S ND |
NA | NPD |
| Wipes | Wet wipes | 4±1 | >100nm EDX-Ag, Cl, I, S |
NA | None |
NA, not applicable; NPD, no peak detected; Ag, silver; Ca, calcium; S, Sulfur; Cl, chlorine; I, iodine.
Table 4.
Silver content and size in selected liquid products.
| Product type | Total Ag ICP (mg/kg) |
Ionic Ag ISE (mg/L) |
DH diameter DLS (nm) |
Size by TEM/EDX (as Ag/AgCl; nm) |
Size by UV-vis (nm) |
|---|---|---|---|---|---|
| Disinfecting spray |
25.8 ± 1.0 (20 nominal#) |
7.7 ± 0.1 | 63.3 ± 1.1 | 5–30 (13.8 ± 0.4, average) NA |
390 |
| Spray cleaner | 24.4 ± 1.1 (30 nominal#) |
29.8 ± 0.6 | NA | NA | NA |
| Antibacterial spray |
19.3 ± 2.0 | 9.1 ± 1.2 | 107.3 ± 2.1 | 3–75 (18.5 ±9.4, average) |
400 |
| Antivirus spray |
ND | 70.0 ± 1.2 | 250.8 ± 4.9 | 10–30 | No peak |
| Dietary supplement |
29.0 ± 0.8 (20 nominal#) |
9.2 ± 0.2 | 54.9 ± 3.7 | 5–50 | 390 |
| Commercial silver nanoparticles |
17* (20 nominal#) |
ND | ND | 20 nm Ag |
400 |
NA, not applicable; ND, not determined.
Pilot study data, no replicates.
As reported by manufacturer.
Table 3.
Silver content and size in selected plastic products.
| Product type | Product component |
Total Ag ICP (mg/kg) (mean ± standard error) |
Size and/or composition by SEM/EDX |
Size by TEM/EDX (nm) |
Size by UV–vis (nm) |
|---|---|---|---|---|---|
| Breast milk storage bags | Average | 0.9 ± 0.6 | ND | NA | ND |
| Kitchen scrubber | Dry | 4.6 ± 0.3 | ND | NA | ND |
| Plush toy | Interior foam | 96±3 | ND | NA | ND |
| Plush toy | Interior foam (averaged) |
48 ±5 | ND | 20(ashed) | ND |
| Plush toy | Exterior fur | 0.6 ±0.1 | ND | NA | ND |
| Sippy cup | Rubber ring | 24±3 | 1 μm | NA | ND |
| Sippy cup | Transparent cap | 9±1 | ND | NA | ND |
| Sippy cup | Cup rim | 4.9 ± 0.2 | ND | NA | ND |
| Sippy cup | Cup body | ND | ND | NA | ND |
| Tooth brush | Bristles | 858* | ND | NA | ND |
NA, not applicable; ND, not determined.
Pilot study data, no replicates.
In general, the total silver content was relatively homogeneous within an individual textile product, as shown by the standard deviations reported in Table 2. However, for some textile products (e.g., the gloves), the measured silver content depended upon where a sample was collected from the product. For example, for the gloves, silver concentrations were lowest on the cuffs (3.8 ± 1.5 mg/kg) and outer side of the thumbs (6.9 ±3.4 mg/kg), and highest on the fingertips (593 ±118 mg/kg), inside of the thumbs (985 ±163 mg/kg), and palm (1070 ±140 mg/kg). Silver content of the sippy cup product ranged from <MDL (method detection limit) to 24 mg/kg, depending on the part of the cup analyzed. These data illustrate that silver content maybe heterogeneously distributed within a product and highlight the need to sample multiple regions of a product.
The silver concentration differed by about a factor of two between the wound dressing and the 7-day wound dressing, even though both were produced by the same manufacturer. The wound dressing is constructed of three layers; the outer layers are polyethylene net coated in silver and the middle layer is adsorbent rayon/polyester. Analysis of both silver-containing layers yielded 1133 mg/kg. The 7-day wound dressing has five layers with the outer and middle interior layers consisting of polyethylene net coated in silver; the other two interior layers are adsorbent rayon/polyester. Analysis of just one outer layer from one side of the 7-day dressing yielded 627 mg/kg.
Among the products analyzed, four were labeled with their nominal (manufacturer provided) silver content (Table 4). For these products, a dietary supplement, spray cleaner, disinfecting spray, and the commercial silver nanoparticles, the values measured using ICP closely matched the nominal silver content on the container labels (e.g., disinfecting spray: measured: 25.8 mg/kg; nominal: 20 mg/kg).
Characteristics of silver in selected consumer products
Selected consumer products that contained measurable amounts of total extracted silver were further characterized using the suite of techniques identified in Fig. 1 to determine the form of silver, and if particulate, to determine its size, morphology, agglomeration state, and composition.
Electron microscopy
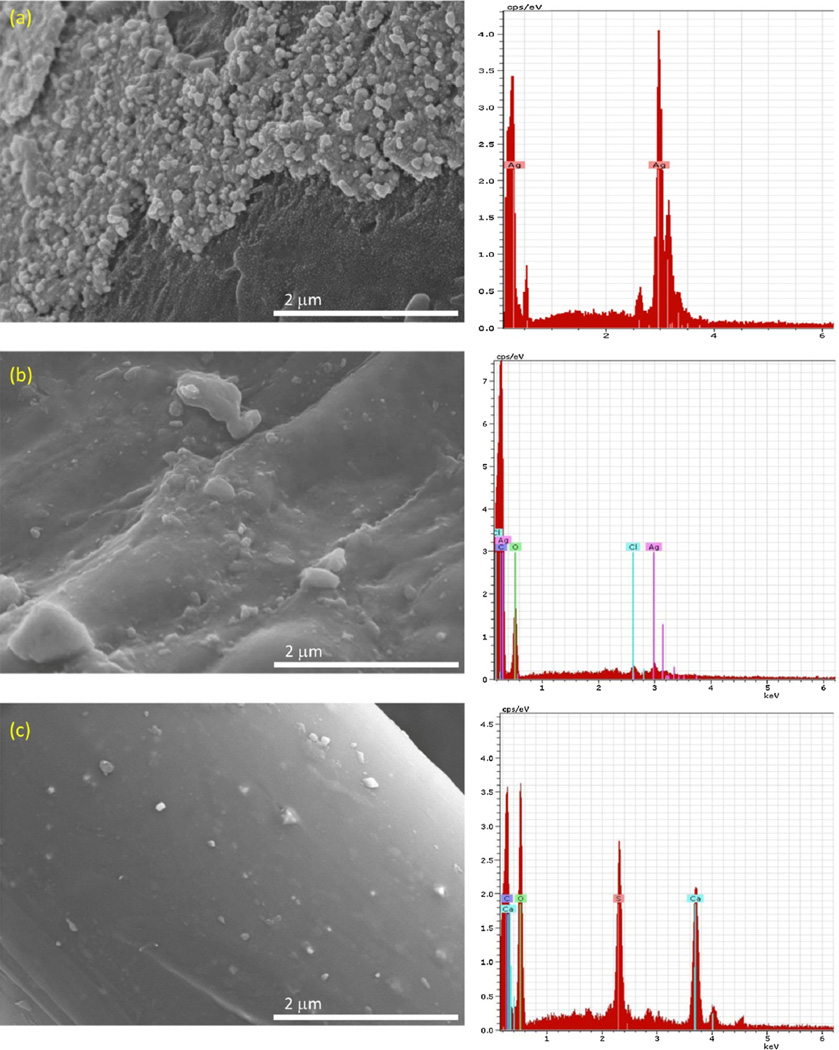
Figs. 2–8 are electron microscopy images of particles identified as silver by energy dispersive X-ray analysis (EDX) in the various selected consumer products. The surfaces of the gray fibers in the white fabric of the underwear (Fig. 2a) were coated with a hard material that contained many nanoscale particles composed of silver (visible as brighter spots on the fiber surface). The average silver particle size was 83 ± 37 nm with an aspect ratio of 1.4, indicating semi-spherical AgNP shapes. Fibers in the wet wipes were composed of cellulose and had a smooth appearance (Fig. 2b) with clusters of discrete primary particles composed of silver and chlorine that were generally larger than 100nm in size. No silver particles were identified on surfaces of fibers from either the polyester pants (data not shown) or the fingertips of the gloves (Fig. 2c); EDX analysis of fibers from both products identified only calcium and sulfur. Images of the wound dressing and 7-day wound dressing showed a high density of primary particles aggregated into micron-scale clusters; EDX analysis identified these particles as silver (data not shown).
Fig. 2.
SEM micrographs and EDX spectra of fibers from: (a) underwear, (b) wet wipes, and (c) fingertip of gloves (note variation in scale bars). EDX spectra were obtained from random points within the field of view of the images.
Fig. 8.
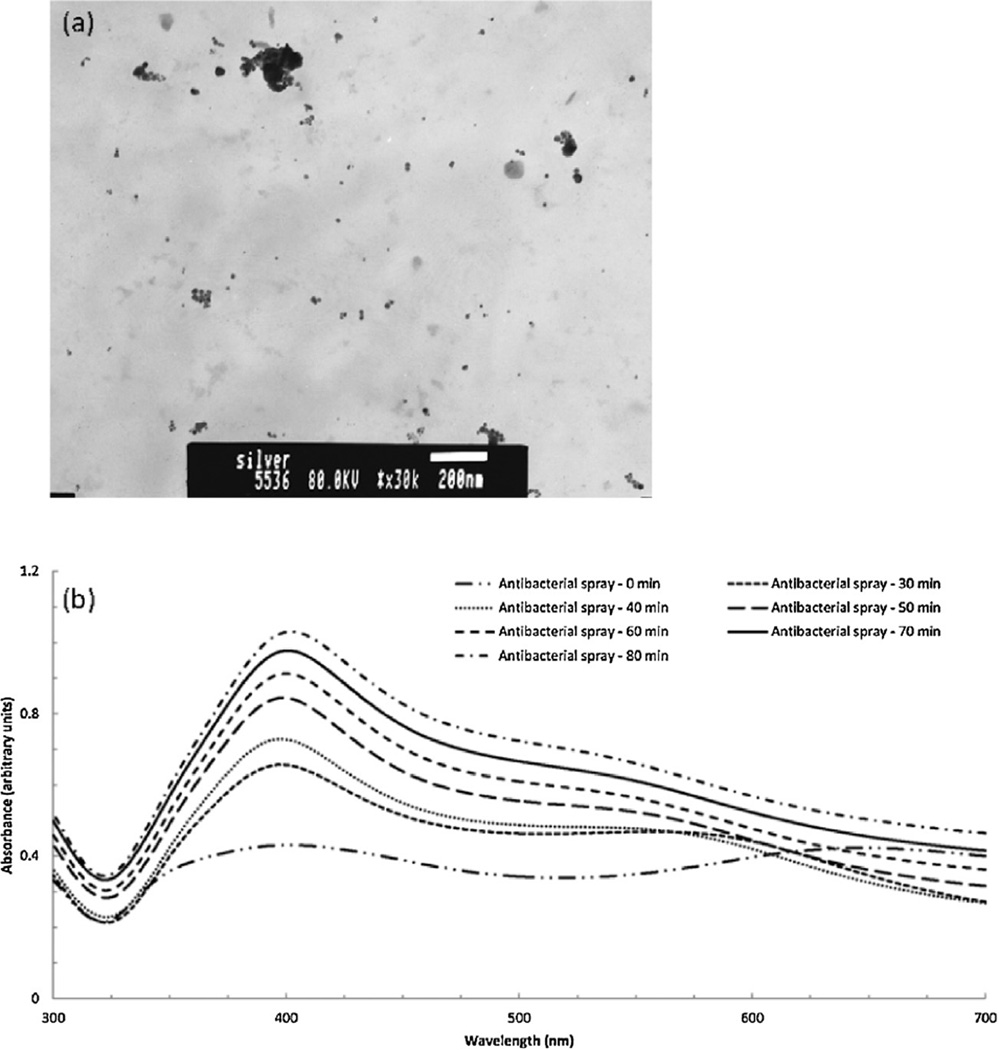
Antibacterial spray. (a) TEM micrograph illustrating both individual and agglomerated AgNPs (dark spots). (b) UV−vis absorption spectra indicating the effect of sonication time on agglomerate dispersion.
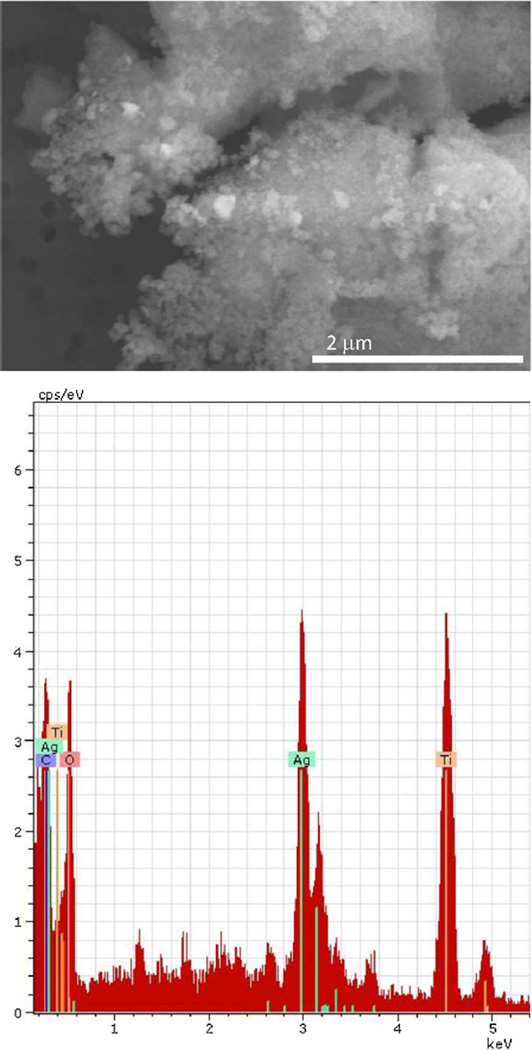
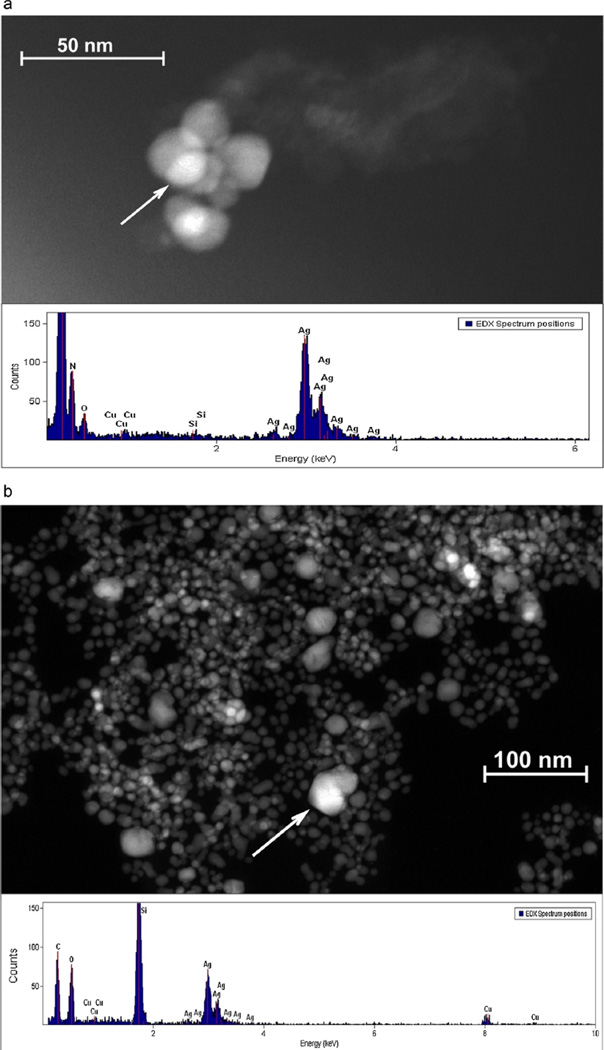
Some investigators report thermally ashing textiles at 550–600°C to isolate particles for electron microscopy analysis (Benn and Westerhoff, 2008; Kulthong et al., 2010). We used a thermal ashing approach to break down the glove textile matrix because chemical analysis showed it contained silver (Table 2), but SEM/EDX did not reveal silver on the surfaces of fibers. Fig. 3 is an SEM micrograph of particles in the ash of glove palm fabric which illustrates the presence of sub-micron scale silver particles (composition confirmed by EDX analysis). Silver is often added to textiles during finishing or masterbatch processing. Finishing (applicable for all fabric types) involves applying the silver by itself or in a matrix to the fibers after manufacture (Fig. 2a). In contrast, masterbatch processing is used for synthetic materials and involves embedding the silver in the fiber plastic during manufacture, a process that results in lower release of silver from a product and, hence, less potential for exposure (Stefaniak et al., 2014). In the case of the gloves, inspection of fiber surfaces using SEM did not identify any particles; however, ICP analysis indicated variable silver concentrations, and silver particles were identified in the textile ash. Collectively, these data indicate that for this product, the silver particles were incorporated into the polymer fibers, not applied to their surfaces (masterbatch process). As noted by Kulthong et al. (2010), it is possible that AgNPs may sinter into larger particles during ashing. To determine whether our ashing process was sintering AgNPs into larger particles, we treated a control fabric with AgNPs synthesized in Virginia Tech’s laboratory, ashed a sample of the treated fabric, and collected EDX spectra of several particles using high-resolution TEM imaging. The EDX spectra confirmed the presence of silver. Additionally, comparisons of our image with a TEM image of the synthesized AgNPs showed that the single primary particles remained unaltered, but the aggregated particles were sintered into larger particles. Consequently, the sizes determined from ashed samples (Figs. 3 and 4a and b) cannot be interpreted to be representative of the particles in the textiles in situ.
Fig. 3.
SEM micrograph and EDX spectrum of ashed glove palm fabric. Particles were composed of silver and titanium, which was probably used as an inert carrier material for the silver metal particles.
Fig. 4.
(a) HAADF micrograph of ashed sample from the interior foam of the plush toy. (b) HAADF micrograph of ashed sample from the baby blanket (detail showing one 40nm AgNP). The sample is composed of many small (6–15 nm) silicon dioxide particles, probably a by product from the ashing of the fabric, and larger (~ 40 nm) multifaceted AgNPs.
The ashing process was also used to identify AgNPs derived from the plush toy interior foam using high-angle annular dark-field (HAADF) microscopy (Fig. 4a). The particles were confirmed to be silver by electron energy loss spectroscopy (EELS). AgNPs were also observed in a HAADF micrograph of the ashed baby blanket (Fig. 4b). A limited surface analysis of the sippy cup rubber ring by SEM/EDX identified one isolated micron-sized silver particle. In the absence of additional observations, it is difficult to know if this is associated with any intent to enhance the product with AgNPs.
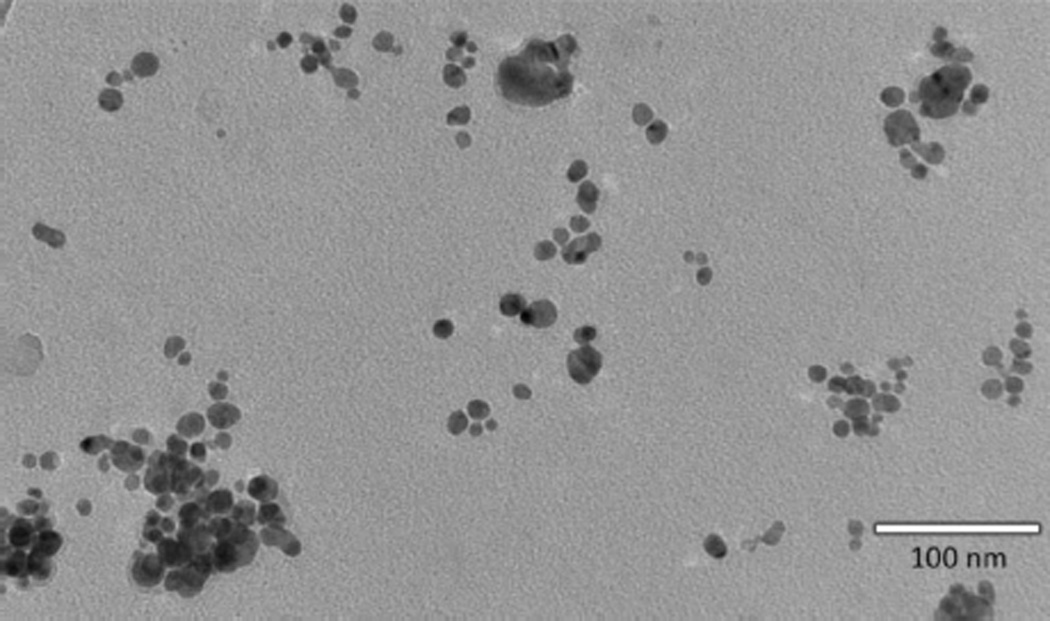
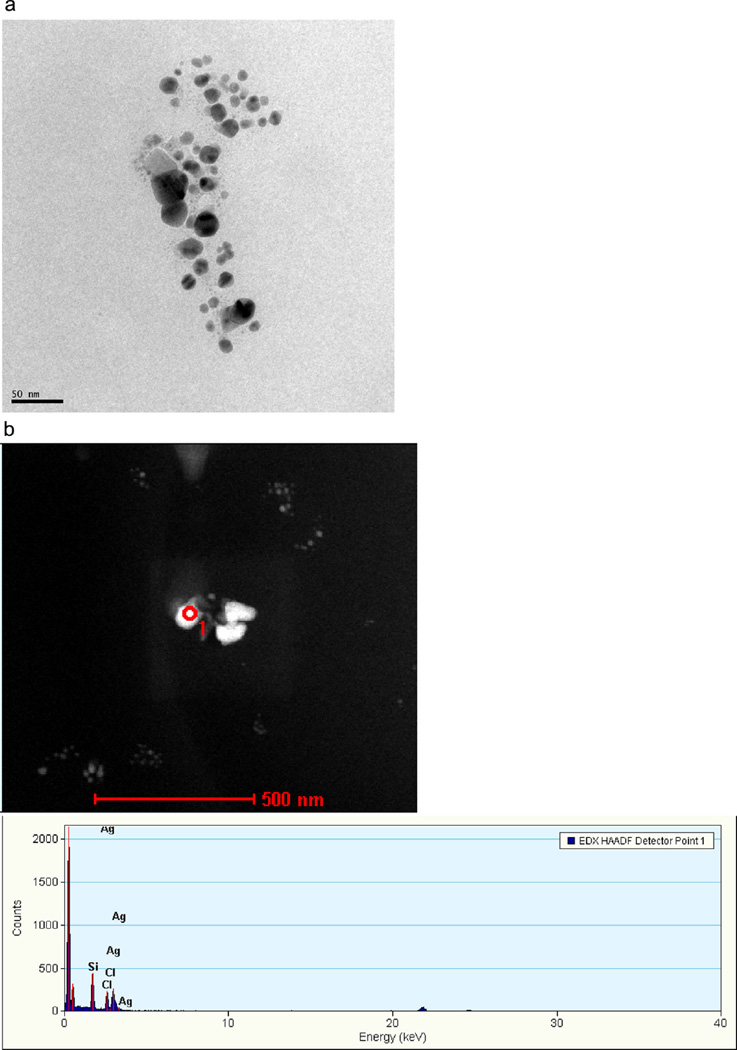
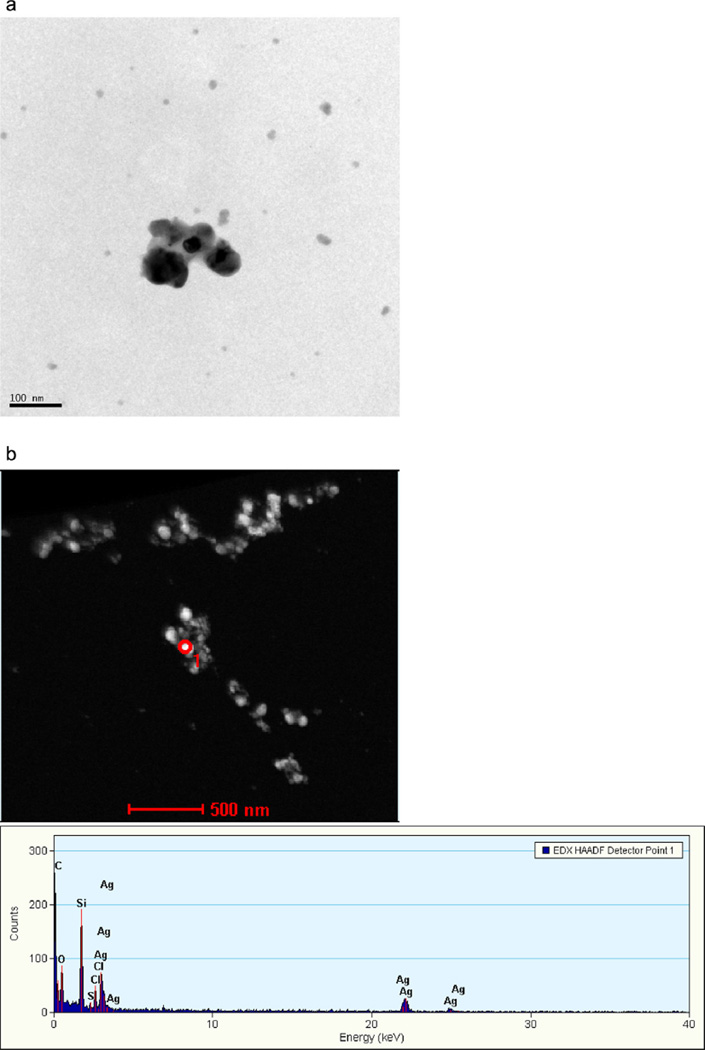
Analysis of the disinfecting spray by TEM showed the presence of individual and aggregated nanoscale silver particles (Fig. 5). Analysis of 253 particles using ImageJ software yielded AgNPs, ranging in size from 5 to 30 nm, with an average of 13.8 ±0.4 nm (clusters not included) (Fig. 6a). Elemental analysis by EDX showed the presence of both silver and chlorine in the nanoscale particles (Fig. 6b), suggesting the presence of nanoscale silver chloride (AgCl) particles. TEM analysis of the dietary supplement showed slightly larger particles that appeared to be slightly aggregated with a sintered appearance (Fig. 7a). EDX analysis also showed the presence of silver and chlorine; however, when compared to the antivirus spray, the silver features were more prominent than the chlorine features, suggesting the presence of both silver and AgCl particles (Fig. 7b).
Fig. 5.
TEM micrograph of the disinfecting spray.
Fig. 6.
(a) TEM micrograph of antivirus spray. (b) TEM micrograph and EDX spectrum of the antivirus spray collected from the central particle indicated by the dark ring in the image.
Fig. 7.
(a) TEM micrograph of the dietary supplement. (b) TEM micrograph and EDX spectrum of the dietary supplement.
Fig. 8a is a TEM micrograph of the AgNPs in the antibacterial spray. Both individual nanoparticles and clusters are visible in the micrograph. A total of 302 particles were sized from three images; the size of individual AgNPs (clusters were not sized) ranged from 3 to 75 nm with an average diameter (±standard deviation) of 18.5 ±9.4 nm. The average calculated circularity of the individual nanoparticles was 0.92 (a value of 1.0 is equivalent to a perfect circle).
UV−vis absorption spectroscopy
UV−vis absorption spectroscopy was used to confirm the SEM size and morphology results (Kelly et al., 2003; Zook et al., 2011). AgNPs have a surface plasmon resonance (SPR) peak, which causes a peak absorbance in the wavelength range of 390 to 420 nm for unagglomerated particles (silver oxide and salts do not exhibit an SPR). As AgNPs increase in size, or if the particles agglomerate, the absorption peak will shift toward longer (red) wavelengths (Kelly et al., 2003; Zook et al., 2011).
The UV−vis absorption results from the textile products are included in Table 2. Textile sections from the inside and outside of the thumbs and palms of the gloves were analyzed, with the resultant spectra identical at each location (weak maximum absorption peak at 414–416 nm). The underwear textile exhibited a peak at 425–430 nm, consistent with the presence of AgNPs larger than 50nm in this product. No SPR absorption peak was observed in the scan of the wet wipes, consistent with EDX data indicating that silver was present in salt form (chloride, iodide, and/or sulfur). Both wound dressing textiles exhibited strong broad absorption spectracentered at 593–616 nm; the observed shift in absorption wave-length confirms that silver particles in these products were not nanoscale.
Four of the six liquid products (disinfecting spray, antibacterial spray, dietary supplement, and commercial silver nanoparticles) exhibited absorption maxima at 390–400 nm which indicated the presence of AgNPs. As shown in Fig. 8b, the un-sonicated antibacterial spray displayed two absorption peaks (one near 400 nm and the other at 650 nm) indicative of un-agglomerated and agglomerated AgNPs, respectively (Zook et al., 2011). Importantly, if the sample preparation step alters the aggregation property being measured, this process must be characterized. Ultrasonic agitation is a technique that is commonly used to disperse nanoparticles in suspension prior to analysis. Fig. 8b also shows UV−vis spectra for a 1:1 dilution of antibacterial spray in water after ultrasonic agitation with a probe tip sonicator for 30, 40, 50, 60, 70, and 80 min; samples were kept cool during sonication using an ice bath. The spectra clearly illustrate that the AgNP agglomerates in the antibacterial spray were increasingly dispersed with longer sonication times. After 30min of sonication, the intensity of the original (no sonication) absorption peak at 650 nm had disappeared and a new peak had formed at 580 nm. After 80 min of sonication, the 580 nm absorption peak had largely disappeared and the amount of un-agglomerated AgNPs had increased (corresponding to a two-fold increase in absorption intensity at 400 nm).
This bimodal spectrum is consistent with the TEM image which shows a range of particle sizes in this product (Fig. 8a). Neither the antivirus spray nor the spray cleaner products displayed absorption peaks near 400 nm. The UV−vis spectrum for the antivirus spray confirmed the TEM-EDX results, which indicated the presence of AgCl particles. Interestingly, the UV−vis spectrum from the spray cleaner, by itself, was insufficient to characterize the form of silver in this product − either the silver in the product was all in ionic form or it was present in particulate form as an oxide or salt. This limitation of UV−vis absorption spectroscopy illustrates the importance of not relying on a single analytical technique for characterization and supports the need for multiple complementary and confirmatory analyses.
Ionic silver concentration of selected liquid products
An ion selective electrode (ISE) was used to determine whether any of the liquid products contained silver in ionic (Ag+) form and these results are summarized in Table 4. The Ag+ concentrations of the disinfecting spray, antibacterial spray, and dietary supplement were lower than the total silver concentrations determined using ICP. Hence, these products contain silver in both particulate and ionic form. The Ag+ concentration of the spray cleaner, 29.8 ± 0.6 mg/L, matched the nominal silver concentration reported on the bottle label (30mg silver/L). The total silver content of the spray cleaner determined by ICP was similar to the Ag+ content measured by the ISE, which indicated that silver in this product was in dissolved form (not particulate). Therefore, for the spray cleaner, a combination of ICP, UV−vis, and ISE analyses was necessary to accurately characterize the form and amount of silver in this product.
Hydrodynamic diameter of particles in selected liquid products
The size of particles in the liquid products was analyzed by dynamic light scattering (DLS) using cumulants analysis (Nano ZS90, Malvern Instruments, Worcestershire, UK). This technique calculates the hydrodynamic equivalent diameter (DH) of particles in suspension. The calculated DH values for the liquid products ranged from about 60 nm (disinfecting spray, dietary supplement) to 250 nm (antivirus spray) (Table 4). The measured DH is an equivalent particle size based on its diffusion in liquid and provides useful information on the behavior of nanoparticles in liquids. DH is a measure of the size of the particle core itself and the hydration shell surrounding the particle, ligands bound to particle surfaces for stabilization (e.g., citrate), and adsorption of ions in the suspending medium. Hence, values of DH will always be larger than the size of the dry core particle determined using high vacuum techniques such as TEM where this shell is collapsed.
Utility of a tiered approach
We described a tiered approach for detecting and characterizing AgNPs in commercially available consumer products. In this study, we chose ICP to provide information on the presence and amount of silver in fabric, liquid, and plastic samples (Tables 2–4). ICP is a reasonable technique for detecting silver in products because it has advantages of widespread availability, low cost, and, with appropriate sample preparation, good sensitivity and robustness for a wide range of consumer product materials. In lieu of ICP, other researchers have used acid-assisted digestion procedures followed by analysis via volumetric titration (Perelshtein et al., 2008) or X-ray fluorescence spectroscopy (Geranio et al., 2009) for solids such as textiles. Whether titration or X-ray fluorescence spectroscopy provide comparable sensitivities and cost efficiency to ICP for similar consumer product materials is not clear. Compilation of such data would be useful for identifying appropriate analytical techniques for the detection of silver (and other metals) in consumer products.
For the characterization step, we used electron microscopy and UV−vis spectroscopy for all product matrices, as well as DLS and ISE for liquid products. Electron microscopy is a powerful tool used to characterize particle dimensions. Electron microscopy, in conjunction with detection techniques such as EDX and EELS (used in this study) or selected area electron diffraction (Glover et al., 2011), provide verification that any observed nanoscale particles contain silver, as well as information on silver binding states and crystallinity, depending on the detector. However, electron microscopy cannot identify AgNPs if they are embedded in a product matrix like the synthetic fibers of the gloves (Fig. 2c). UV−vis spectroscopy is also a robust technique for characterizing AgNPs in a broad range of matrices by measuring SPR absorption; however, this technique is limited to metallic silver and will not respond to silver-containing particles with other chemical compositions, such as the silver salts found in the wet wipes (Table 2). For textiles, plastics, and other types of solids, investigators have used atomic force microscopy (Glover et al., 2011; MacCuspie et al., 2011), X-ray diffraction (Perelshtein et al., 2008; Sotiriou and Pratsinis, 2010; Rogers et al., 2012), and X-ray photoelectron spectroscopy (Levard et al., 2011). Although these techniques can yield detailed speciation information, this level of detail was outside the scope of the current study.
For liquid products, we used ISE to selectively measure free silver ion concentrations (Table 4). Use of ISE in conjunction with ICP provided information on the fraction of total silver in a product that was in free ion form versus particulate-associated form. Note that ICP can be used as a standalone technique to selectively quantify silver ions in liquids provided an appropriate fractionation protocol is used to remove particulate silver from the sample prior to analysis. Also, ISE only measures free silver ion in solution and will not account for any silver ions that are adsorbed to particle surfaces. DLS is another useful technique for liquid characterization; however, it is not chemical-specific, so additional complementary analyses are needed to verify the presence of silver. In addition to ISE and DLS, there are several other techniques that, with appropriate sample preparation, are useful for characterizing silver in liquids, including atomic force microscopy (Vasilev et al., 2010; MacCuspie et al., 2011), X-ray diffraction (Liu et al., 2010), nanoparticle tracking analysis (Geranio et al., 2009; Farkas et al., 2011; MacCuspie et al., 2011), zeta potential (El Badawy et al., 2011; Levard et al., 2011), small-angle X-ray scattering (MacCuspie et al., 2011), and atomic stripping voltammetry (Morones et al., 2005). Among these techniques, only X-ray diffraction, small-angle X-ray scattering, and atomic stripping voltammetry are chemical-specific; for all others, a complementary technique capable of identifying silver is necessary.
Example of children’s potential exposures to AgNPs
We used the data reported here and in Quadros et al. (2013) to illustrate a child’s potential non-dietary ingestion exposure to AgNPs when drinking milk formula from a sippy cup. This example is intended to show one approach and the associated data inputs needed to estimate a child’s potential non-dietary ingestion exposure. With the limited data presented in this manuscript, it is not possible to make conclusions on what the non-dietary ingestion exposure estimate means. However, this approach may have utility for complex datasets containing data on several consumer products where the data are presented with an intended purpose of estimating potential exposures.
For each microactivity resulting in non-dietary ingestion, exposure over a 24-h period can be defined as:
| (1) |
where x = sippy cup spout cover; End = non-dietary ingestion exposure from a specific mouthing event over a 24-h period [μg/day]; Cx = total AgNP loading in x [μg/cm2]; TEx = transfer efficiency, fraction transferred from x to mouth [unitless]; SAx = surface area of x that is mouthed [cm2/event]; EF = frequency of mouthing events over a 24-h period [event/day] (Tulve et al., 2002). The microenvironment is the kitchen of a residential dwelling where a 24-month-old female child (weight = 13.5 kg) spends 1 h playing and drinking from her sippy cup (μe.t = K.1 h). In this example, the concentration of AgNPs leached from the sippy cup spout cover is 0.159 μg Ag/cm2 [0.93 mg silver/kg plastic (Quadros et al., 2013) × 4.104 g plastic/spout cover ×1 kg/1000 g × 1/24 cm2 (area of spout cover) × 1000 μg/1 g]. Additionally, the following assumptions are made: (1) the child’s mouth comes into contact with 90% of the spout cover of the sippy cup during any mouthing event [SAspout cover = 24 cm2 × 0.9 = 21.6cm2/event]; (2) the amount of AgNPs leached from the spout of the sippy cup are constant as a function of time; and (3) TEspout cover is 50%. Using data available in Tulve et al. (2002), EF is 12 events/h. The child’s potential exposure is computed as follows:
Taking into account the time in the microenvironment and the child’s body mass, her potential non-dietary ingestion exposure is:
To obtain an estimate of this child’s total non-dietary ingestion exposure to Ag, potential exposure from all activities in all microenvironments where she spends time would have to be computed and summed. To place this example estimate of a child’s Ag exposure/intake from drinking milk formula from the sippy cup into context, we can estimate what the exposure would be if the cup contents were at a concentration of 0.1 mg/L, the EPA National Secondary Drinking Water Standard (a suggested non-enforceable guideline level) (40 CFR 143.3). At this concentration, the estimated intake of Ag by a 24-month-old female child ingesting 23 mL/kg-d of drinking water (U.S. EPA, 2011) would be 2.3 μg Ag/kg [0.1 mg Ag/L × 23 mL/kg-d × 1 d × 1 L/1000 mL × 1000 μg/1 mg]. Similar approaches can be used to estimate potential exposures to AgNPs for other vulnerable groups (e.g., pregnant women, adults with pre-existing diseases). More research is needed to understand the number and types of consumer products containing silver and the concentrations of silver in these products in order to more accurately predict children’s potential exposures. As described in this manuscript, this tiered approach for detecting and characterizing AgNPs in commercially available consumer products is important for characterizing products in the marketplace to understand the potential for exposure to AgNPs. While these data are limited, they suggest that as more nanotechnology-enabled products are introduced into the marketplace, aggregate and cumulative exposures to silver could become a concern.
Conclusions
Recent advances in technology have allowed the production and incorporation of nanosilver particles into a range of consumer products, including products intended for use by or near children or used in the home. In this manuscript, we described the product inventory and a tiered analytical strategy to detect and characterize AgNPs in a variety of consumer products. To evaluate our objectives, we selected consumer products claiming to contain AgNPs that may be used by or near children or in the home and that pose a potential exposure risk; and we tested selected products for the presence, release (Quadros et al., 2013), and speciation of silver in selected items from three product classes: fabrics, liquids, and plastics. We used the data to illustrate a child’s potential non-dietary ingestion exposure to AgNPs when drinking milk formula from a sippy cup. From a market survey, 165 products were identified. Of these, 19 were selected for further analyses. The experimental approach used to understand whether nanosilver may be present involved the following steps: measurement of total extractable silver; determination of the presence of nanosilver using electron microscopy; and analysis using selected confirmatory and complementary techniques.
Acknowledgements
We are grateful to our colleagues Ron Williams (EPA/ORD/NERL) and Lorenzo Cena (NIOSH) for their helpful review and comments on the draft manuscript.
Footnotes
Disclaimer
This work is part of interagency agreements between the U.S. Environmental Protection Agency (EPA) and the U.S. Consumer Product Safety Commission (CPSC) (EPA-IA-RW-61–92317001-0) and NIOSH and CPSC (CPSC-I-10-006). The EPA, through its Office of Research and Development, partially funded and collaborated in the research described here under contract number RFQ-RT-10–00249 to Virginia Tech. This work has been subjected to EPA administrative review and approved for publication. The findings and conclusions in this paper are those of the authors and do not necessarily represent the views of the CPSC or NIOSH. Mention of trade names or commercial products does not constitute endorsement or recommendation for use, nor does it imply that alternative products are unavailable or unable to be substituted after appropriate evaluation.
Conflict of interest
The authors declare no competing financial interests.
References
- Arora S, Jain J, Rajwade JM, Paknikar KM. Interactions of silver nanoparticles with primary mouse fibroblasts and liver cells. Toxicol. Appl. Pharmacol. 2009;236:310–318. doi: 10.1016/j.taap.2009.02.020. [DOI] [PubMed] [Google Scholar]
- Benn T, Cavanagh B, Hristovski K, Posner JD, Westerhoff P. The release of nanosilver from consumer products used in the home. J. Environ. Qual. 2010;39:1875–1882. doi: 10.2134/jeq2009.0363. [DOI] [PMC free article] [PubMed] [Google Scholar]
- Benn TM, Westerhoff P. Nanoparticle silver released into water from commercially available sock fabrics. Environ. Sci. Technol. 2008;42:4133–4139. doi: 10.1021/es7032718. [DOI] [PubMed] [Google Scholar]
- Braydich-Stolle L, Hussain S, Schlager JJ, Hofmann MC. In vitro cytotoxicity of nanoparticles in mammalian germline stem cells. Toxicol. Sci. 2005;88:412–419. doi: 10.1093/toxsci/kfi256. [DOI] [PMC free article] [PubMed] [Google Scholar]
- Choi OK, Hu ZQ. Nitrification inhibition by silver nanoparticles. Water Sci. Technol. 2009;59:1699–1702. doi: 10.2166/wst.2009.205. [DOI] [PubMed] [Google Scholar]
- Cleveland D, Long SE, Pennington PL, Cooper E, Fulton MH, Scott GI, Brewer T, Davis J, Petersen EJ, Wood L. Pilot estuarine mesocosm study on the environmental fate of silver nanomaterials leached from consumer products. Sci. Total Environ. 2012;421–422:267–272. doi: 10.1016/j.scitotenv.2012.01.025. [DOI] [PubMed] [Google Scholar]
- Code of Federal Regulations (CFR) 40 CFR 143.3. Title 40: Protection of Environment. Part 143 - National Secondary Drinking Water Regulations. 143.3: Secondary maximum contaminant levels. Available online at: http://www.ecfr.gov/cgi-bin/text-idx?SID=9ffc22b5d6026909d85e97b4ece4015c&node=40:24.0.1.1.5.0.39.3&rgn=div8.
- Cohen Hubal EA, Sheldon LS, Burke JM, McCurdy TR, Berry MR, Rigas ML, Zartarian VG, Freeman NCG. Children’s exposure assessment: a review of factors influencing children’s exposure, and the data available to characterize and assess that exposure. Environ. Health Perspect. 2000;108:475–486. doi: 10.1289/ehp.108-1638158. [DOI] [PMC free article] [PubMed] [Google Scholar]
- El Badawy AM, Silva RG, Morris B, Scheckel KG, Suidan MT, Tolaymat TM. Surface charge-dependent toxicity of silver nanoparticles. Environ. Sci. Technol. 2011;45:283–287. doi: 10.1021/es1034188. [DOI] [PubMed] [Google Scholar]
- Farkas J, Peter H, Christian P, Urrea JAG, Hassellov M, Tuoriniemi J, Gustafsson S, Olsson E, Hylland K, Thomas KV. Characterization of the effluent from a nanosilver producing washing machine. Environ. Int. 2011;37:1057–1062. doi: 10.1016/j.envint.2011.03.006. [DOI] [PubMed] [Google Scholar]
- Geranio L, Heuberger M, Nowack B. The behavior of silver nanotextiles during washing. Environ. Sci. Technol. 2009;43:8113–8118. doi: 10.1021/es9018332. [DOI] [PubMed] [Google Scholar]
- Glover RD, Miller JM, Hutchison JE. Generation of metal nanoparticles from silver and copper objects: nanoparticle dynamics on surfaces and potential sources of nanoparticles in the environment. ACS Nano. 2011;5:8950–8957. doi: 10.1021/nn2031319. [DOI] [PubMed] [Google Scholar]
- Griffitt RJ, Luo J, Gao J, Bonzongo JC, Barber DS. Effects of particle composition and species on toxicity of metallic nanomaterials in aquatic organisms. Environ. Toxicol. Chem. 2008;27:1972–1978. doi: 10.1897/08-002.1. [DOI] [PubMed] [Google Scholar]
- Hagendorfer H, Lorenz C, Kaegi R, Sinnet B, Gehrig R, Goetz NV, Scheringer M, Ludwig C, Ulrich A. Size-fractionated characterization and quantification of nanoparticle release rates from a consumer spray product containing engineered nanoparticles. J. Nanoparticle Res. 2010;12:2481–2494. [Google Scholar]
- Hayashi Y, Engelmann P, Foldbjerg R, Szabo M, Somogyi I, Pollak E, Molnar L, Autrup H, Sutherland DS, Scott-Fordsmand J, Heckmann LH. Earthworms and humans in vitro: characterizing evolutionarily conserved stress and immune responses to silver nanoparticles. Environ. Sci. Technol. 2012;46:4166–4173. doi: 10.1021/es3000905. [DOI] [PubMed] [Google Scholar]
- Hussain SM, Hess KL, Gearhart JM, Geiss KT, Schlager JJ. In vitro toxicity of nanoparticles in BRL3A rat liver cells. Toxicol. In Vitro. 2005;19:975–983. doi: 10.1016/j.tiv.2005.06.034. [DOI] [PubMed] [Google Scholar]
- Kelly KL, Coronado E, Zhao LL, Schatz GC. The optical properties of metal nanoparticles: the influence of size, shape, and dielectric environment. J. Phys. Chem. B. 2003;107:668–677. [Google Scholar]
- Klaine SJ, Alvarez PJJ, Batley GE, Fernandes TF, Handy RD, Lyon DY, Mahendra S, McLaughlin MJ, Lead JR. Nanomaterials in the environment: behavior, fate, bioavailability, and effects. Environ. Toxicol. Chem. 2008;27:1825–1851. doi: 10.1897/08-090.1. [DOI] [PubMed] [Google Scholar]
- Kulthong K, Srisung S, Boonpavanitchakul K, Kangwansupamonkon W, Manitratanachote R. Determination of silver nanoparticle release from antibacterial fabrics into artificial sweat. Part Fibre Toxicol. 2010;7:8. doi: 10.1186/1743-8977-7-8. http://dx.doi.org/10.1186/1743-8977-7-8. [DOI] [PMC free article] [PubMed] [Google Scholar]
- Levard C, Reinsch BC, Michel FM, Oumahi C, Lowry GV, Brown GE. Sulfidation processes of PVP-coated silver nanoparticles in aqueous solution: impact on dissolution rate. Environ. Sci. Technol. 2011;45:5260–5266. doi: 10.1021/es2007758. [DOI] [PubMed] [Google Scholar]
- de Lima R, Seabra AB, Duran N. Silver nanoparticles: a brief review of cytotoxicity and genotoxicity of chemically and biogenically synthesized nanoparticles. J. Appl. Toxicol. 2012;32:867–879. doi: 10.1002/jat.2780. [DOI] [PubMed] [Google Scholar]
- Liu HL, Dai SA, Fu KY, Hsu SH. Antibacterial properties of silver nanoparticles in three different sizes and their nanocomposites with a new waterborne polyurethane. Int. J. Nanomed. 2010;5:1017–1028. doi: 10.2147/IJN.S14572. [DOI] [PMC free article] [PubMed] [Google Scholar]
- MacCuspie RI, Rogers K, Patra M, Suo Z, Allen AJ, Martin MN, Hackley VA. Challenges for physical characterization of silver nanoparticles under pristine and environmentally relevant conditions. J. Environ. Monit. 2011;13:1212–1226. doi: 10.1039/c1em10024f. [DOI] [PubMed] [Google Scholar]
- Morones JR, Elechiguerra JL, Camacho A, Holt K, Kouri JB, Ramirez JT, Yacaman MJ. The bactericidal effect of silver nanoparticles. Nanotechnology. 2005;16:2346–2353. doi: 10.1088/0957-4484/16/10/059. [DOI] [PubMed] [Google Scholar]
- Mukherjee SG, O’Claonadh N, Casey A, Chambers G. Comparative in vitro cytotoxicity study of silver nanoparticle on two mammalian cell lines. Toxicol. In Vitro. 2012;26:238–251. doi: 10.1016/j.tiv.2011.12.004. [DOI] [PubMed] [Google Scholar]
- Navarro E, Piccapietra F, Wagner B, Marconi F, Kaegi R, Odzak N, Sigg L, Behra R. Toxicity of silver nanoparticles to Chlamydomonas reinhardtii. Environ. Sci. Technol. 2008;42:8959–8964. doi: 10.1021/es801785m. [DOI] [PubMed] [Google Scholar]
- Perelshtein I, Applerot G, Perkas N, Guibert G, Mikhailov S, Gedanken A. Sonochemical coating of silver nanoparticles on textile fabrics (nylon, polyester and cotton) and their antibacterial activity. Nanotechnology. 2008;19:245705. doi: 10.1088/0957-4484/19/24/245705. [DOI] [PubMed] [Google Scholar]
- Project on Emerging Nanotechnologies. Consumer Products Inventory. 2014 Retrieved [2012] from http://www.nanotechproject.org/cpi.
- Quadros ME, Marr LC. Silver nanoparticles and total aerosols emitted by nanotechnology-related consumer spray products. Environ. Sci. Technol. 2011;45:10713–10719. doi: 10.1021/es202770m. [DOI] [PubMed] [Google Scholar]
- Quadros ME, Pierson R, Tulve NS, Willis R, Rogers K, Thomas TA, Marr LC. Release of silver from nanotechnology-based consumer products for children. Environ. Sci. Technol. 2013;47:8894–8901. doi: 10.1021/es4015844. [DOI] [PubMed] [Google Scholar]
- Rogers KR, Bradham K, Tolaymat T, Thomas DJ, Hartmann T, Ma LZ, Williams A. Alterations in physical state of silver nanoparticles exposed to synthetic human stomach fluid. Sci. Total Environ. 2012;420:334–339. doi: 10.1016/j.scitotenv.2012.01.044. [DOI] [PubMed] [Google Scholar]
- Roh JY, Sim SJ, Yi J, Park K, Chung KH, Ryu DY, Choi J. Ecotoxicity of silver nanoparticles on the soil nematode Caenorhabditis elegans using functional ecotoxicogenomics. Environ. Sci. Technol. 2009;43:3933–3940. doi: 10.1021/es803477u. [DOI] [PubMed] [Google Scholar]
- Som C, Wick P, Krug H, Nowack B. Environmental and health effects of nanomaterials in nanotextiles and facade coatings. Environ. Int. 2011;37:1131–1142. doi: 10.1016/j.envint.2011.02.013. [DOI] [PubMed] [Google Scholar]
- Sotiriou GA, Pratsinis SE. Antibacterial activity of nanosilver ions and particles. Environ. Sci. Technol. 2010;44:5649–5654. doi: 10.1021/es101072s. [DOI] [PubMed] [Google Scholar]
- Stefaniak AB, Duling MG, Lawrence RB, Thomas TA, LeBouf RF, Wade EE, Virji MA. Dermal exposure potential from textiles that contain silver nanoparticles. Int. J. Occup. Environ. Health. 2014;20:220–234. doi: 10.1179/2049396714Y.0000000070. [DOI] [PMC free article] [PubMed] [Google Scholar]
- Sun RWY, Chen R, Chung NPY, Ho CM, Lin CLS, Che CM. Silver nanoparticles fabricated in Hepes buffer exhibited cytoprotective activities toward HIV-1 infected cells. Chem. Commun. 2005;40:5059–5061. doi: 10.1039/b510984a. [DOI] [PubMed] [Google Scholar]
- Tulve NS, Suggs JC, McCurdy T, Hubal EAC, Moya J. Frequency of mouthing behavior in young children. J. Expo. Anal. Environ. Epidemiol. 2002;12:259–264. doi: 10.1038/sj.jea.7500225. [DOI] [PubMed] [Google Scholar]
- U.S. EPA, EPA/600/R-09/052F. Exposure Factors Handbook, 2011 edition. Washington, DC: U.S. Environmental Protection Agency; 2011. Available online at: http://cfpub.epa.gov/ncea/risk/recordisplay.cfm?deid=236252. [Google Scholar]
- Vasilev K, Sah VR, Goreham RV, Ndi C, Short RD, Griesser HJ. Antibacterial surfaces by adsorptive binding of polyvinyl-sulphonate-stabilized silver nanoparticles. Nanotechnology. 2010;21:215102. doi: 10.1088/0957-4484/21/21/215102. [DOI] [PubMed] [Google Scholar]
- Weir E, Lawlor A, Whelan A, Regan F. The use of nanoparticles in antimicrobial materials and their characterization. Analyst. 2008;133:835–845. doi: 10.1039/b715532h. [DOI] [PubMed] [Google Scholar]
- Wijnhoven SWP, Peijnenburg WJGM, Herberts CA, Hagens WI, Oomen AG, Heugens EHW, Roszek B, Bisschops J, Gosens I, Van de Meent D, Dekkers S, De Jong WH, Van Zijverden M, Sips AJAM, Geertsma RE. Nanosilver - a review of available data and knowledge gaps in human and environmental risk assessment. Nanotoxicology. 2009;3:109–138. [Google Scholar]
- Xiang DX, Chen Q, Pang L, Zheng CL. Inhibitory effects of silver nanoparticles on H1N1 influenza A virus in vitro. J. Virol. Methods. 2011;178:137–142. doi: 10.1016/j.jviromet.2011.09.003. [DOI] [PubMed] [Google Scholar]
- Yoon KY, Byeon JH, Park JH, Ji JH, Bae GN, Hwang J. Antimicrobial characteristics of silver aerosol nanoparticles against Bacillussubtilisbioaerosols. Environ. Eng. Sci. 2008;25:289–293. [Google Scholar]
- Zook JM, Long SE, Cleveland D, Geronimo CLA, MacCuspie RI. Measuring silver nanoparticle dissolution in complex biological and environmental matrices using UV-visible absorbance. Anal. Bioanal. Chem. 2011;401:1993–2002. doi: 10.1007/s00216-011-5266-y. [DOI] [PubMed] [Google Scholar]


