

Abstract
Objective
To evaluate the associations between quantitative 18F-fluorodeoxyglucose positron-emission tomography (FDG-PET) uptake metrics, optimal debulking (OD) and progression-free survival (PFS) in patients with recurrent ovarian cancer undergoing secondary cytoreductive surgery.
Methods
Fifty-five patients with recurrent ovarian cancer underwent FDG-PET/CT within 90 days prior to surgery. Standardized uptake values (SUVmax); metabolically active tumour volumes (MTV), and total lesion glycolysis (TLG) were measured on PET. Logistic regression, Kaplan-Meier curves and the log-rank test were used to assess associations between imaging metrics, OD and PFS.
Results
MTV (p=0.0025) and TLG (p=0.0043) were associated with OD; however, there was no significant association between SUVmax and debulking status (p=0.83). Patients with an MTV above 7.52 mL and/or a TLG above 35.94 g had significantly shorter PFS (p=0.0191 for MTV and p=0.0069 for TLG). SUVmax was not significantly related to PFS (p=0.10). PFS estimates at 3.5 years after surgery were 0.42 for patients with an MTV≤ 7.52 mL and 0.19 for patients with an MTV>7.52 mL; 0.46 for patients with a TLG≤35.94 g and 0.15 for patients with a TLG>35.94 g.
Conclusion
FDG-PET metrics that reflect metabolic tumour burden are associated with optimal secondary cytoreductive surgery and progression-free survival in patients with recurrent ovarian cancer.
Keywords: Ovarian cancer, PET/CT, Imaging, Recurrence, Secondary cytoreduction
INTRODUCTION
The majority of women with ovarian cancer initially respond to standard treatment approaches consisting of a combination of primary surgical cytoreduction and platinum-based chemotherapy [1]. Despite this, 80% of patients with treated ovarian cancer relapse within 5 years [2; 3]. Patients in whom recurrent ovarian cancer is suspected based on clinical symptoms and/or rising CA-125 undergo diagnostic procedures with the aim of confirming the presence and defining the extent of recurrent disease [4]. Secondary cytoreductive surgery is considered in patients with recurrent platinum-sensitive ovarian cancer if complete tumour resection appears to be achievable [5]. A recent meta-analysis of more than 2000 patients showed that complete secondary cytoreduction without macroscopic residual tumour was the clinical factor most strongly associated with prolonged survival [6]. Factors that increased the likelihood of a complete secondary cytoreduction included complete resection at first surgery, absence of ascites and good performance status [5]. However, in general, patients with recurrent ovarian cancer constitute a heterogeneous group with variable prognoses and unpredictable responses to further treatment [7].
Imaging has a well-established role in the evaluation of recurrent ovarian cancer. Computed tomography (CT) provides a “roadmap” of the disease distribution and facilitates surgical planning and assessment of the feasibility of optimal secondary cytoreduction [8]. There is also burgeoning evidence that combining anatomical and functional imaging through 18F-fluorodeoxyglucose (FDG) positron emission tomography (PET)/CT may be helpful for evaluating patients with suspected ovarian cancer recurrence but negative or indeterminate CT findings. In a recent meta-analysis of 34 studies, the pooled area under the curve (AUC) of PET/CT for the detection of recurrent ovarian cancer was significantly higher than that of CT or MRI [9]. While PET/CT can be evaluated qualitatively, the degree of FDG accumulation in tumour deposits can also be assessed quantitatively through metrics such as the standardized uptake value (SUV), total lesion glycolysis (TLG) and metabolically-active tumour volume (MTV). Quantitative FDG uptake metrics have been linked with clinical outcomes in several gynaecological cancers [10–12]. Thus, the aim of this study was to evaluate the use of quantitative FDG uptake metrics as predictive biomarkers for optimal debulking and progression-free survival in patients with recurrent ovarian cancer undergoing secondary cytoreductive surgery.
MATERIALS AND METHODS
The Institutional Review Board approved this retrospective study and issued a waiver of informed consent. Inclusion criteria were: (i) recurrent ovarian cancer as evidenced by a rising CA-125 and/or radiographic evidence of recurrent disease; (ii) secondary surgical cytoreduction and (iii) FDG PET/CT performed less than 90 days before surgery. No patients were excluded from analysis. Thirty-five of the patients in the current study were included in a prior publication (reference blinded for review). The purpose of the prior study was to compare accuracy and interobserver variability in the detection and localization of recurrent ovarian cancer with contrast material–enhanced CT and PET/CT. Although there was a brief description of the association of SUVs in specific sites and clinical outcomes, there was no assessment of the volume-based PET metrics which are evaluated in the current manuscript.
PET/CT acquisition
Examinations were performed on dedicated PET/CT systems (Discovery STE, LS or 690 [GE Medical Systems], Biograph 16 [Siemens Medical Systems] and Biograph CPS 1080 [Siemens Medical Systems]). After at least 6 hours of fasting and documentation of blood glucose < 200 mg/dL, 400–455 MBq FDG was injected intravenously and followed by a 68 +/− 13-minute uptake period. A low-dose, attenuation correction CT scan (120–140 kV, approximately 80 mA) was acquired, followed by PET emission images from the floor of the pelvis to the skull. Oral contrast material was administered 30 minutes before imaging to patients without contraindications.
PET/CT interpretation
A physician dually trained in diagnostic radiology and nuclear medicine evaluated all PET/CT examinations, blinded to the patients’ clinical data. The reader identified areas suspicious for recurrent tumour based on abnormal FDG accumulation on PET (defined as uptake higher than blood pool activity). No maximum or minimum uptake values were set as inclusion or exclusion criteria. Abnormal CT findings at sites of abnormal FDG uptake, although assessed during PET/CT evaluation as per our standard clinical practice, were not necessary to consider a lesion suspicious. Size on CT was not one of the parameters evaluated in this study, which focused on FDG uptake on PET, therefore no minimum or maximum size criteria on CT were used. The reader then placed a volume-of-interest (VOI) covering each suspicious area using dedicated analytic software (Advantage Workstation version 4.1, GE Medical Systems). Care was taken to avoid inclusion of physiologic FDG uptake (e.g., excreted tracer in the bladder) within the tumour VOIs. The following quantitative FDG uptake metrics were recorded at a per-patient level: (i) the highest standardized uptake value (SUV) found for a single voxel among all the voxels included in the tumour VOI (SUVmax); (ii) the metabolically active tumour volume (MTV), defined as the sum of all voxels with an SUV above 42% of SUVmax and (iii) the total lesion glycolysis (TLG), defined as the metabolic tumour volume multiplied by the mean SUV (SUVmean) of the voxels used to calculate the MTV. Forty-two percent of SUVmax was identified as the optimal cut-off to delineate the true volumes of spherical lesions in a study by Erdi et al. [13], and it has been widely accepted as a cut-off for calculating MTV.
Statistical analysis
Clinical and histopathological characteristics, as well as PET/CT metrics, were summarized using descriptive statistics. Medians and ranges were used for continuous variables, and frequencies with corresponding percentages were used for discrete variables.
Exact univariate logistic regression was used to assess the ability of imaging metrics to predict optimal debulking, with the imaging metrics being treated as continuous predictors. Optimal debulking was defined as less than 1 cm of residual disease remaining after surgery, as assessed as part of standard of care by the surgeon performing the procedure. To examine the relationship between quantitative PET/CT metrics and progression-free survival, patients were divided into groups based on the median SUVmax, MTV, and TLG. Using these strata, Kaplan-Meier survival estimates were generated and the log-rank test was performed. Progression was determined by the treating physician using a combination of clinical, radiographic and biochemical (serum CA-125) findings. Progression-free survival was defined as the interval from the secondary cytoreductive surgery to the diagnosis of progression or death. Patients alive and disease free at last follow up were censored. Patients were followed up as per standard clinical care, and assessment of progression was made blinded to the PET/CT metrics. P-values ≤ 0.05 were considered statistically significant. All analyses were performed with SAS 9.2 software (SAS Institute, Cary, NC).
RESULTS
Patient characteristics
Fifty-five patients with a median age of 57.0 years (range: 29.6–75.3 years) were included in the study. All patients had been treated with surgical debulking and carboplatin-based chemotherapy at the time of their initial ovarian cancer diagnosis. Median time between PET/CT and secondary cytoreduction was 25.5 days (range: 7.0–86 days). After a median follow up of 49.6 months (range: 1.6–98.6 months), the median time to progression was 13.0 months (range: 0.1–85.5 months). Patient characteristics and tumour histology are summarized in Table 1.
Table 1.
Patient characteristics
| Continuous Variables | Median | (Min- Max) |
|---|---|---|
| Age (years) | 57.0 | (29.6 – 75.3) |
| Follow up Time (months) | 49.6 | (1.6 – 98.6) |
| Time to Progression (months) | 13.0 | (0.1 – 85.5) |
| Categorical Variables | N | (%) |
|---|---|---|
| Surgical Debulking | ||
| Complete | 42 | (76.3) |
| <=1cm | 8 | (14.6) |
| >1cm | 5 | (9.1) |
| Histology | ||
| Clear Cell Adenocarcinoma, | 2 | (3.6) |
| Endometrioid Carcinoma | 4 | (7.3) |
| Mixed/unspecified adenocarcinoma | 4 | (7.3) |
| Mucinous Adenocarcinoma | 1 | (1.8) |
| Papillary Serous Carcinoma | 37 | (67.3) |
| Serous Cystadenocarcinoma | 7 | (12.7) |
Distribution of FDG-avid lesions
A total of 128 FDG-avid lesions were identified in the 55 patients. The most common sites of disease were the peritoneal/serosal surfaces (n=52) and lymph nodes in the abdomen (n=28), pelvis (n=29) and chest (n=5). There were 6 vaginal cuff recurrences. Solid organ metastases were identified in the liver (n=4). Three soft tissue lesions (anterior abdominal wall nodules) and 1 adrenal lesion were also present.
Quantitative 18F-FDG PET metrics and their association with clinical outcomes
Of the 55 patients, 50 (91%) had optimal debulking (less than 1 cm of residual disease) and 5 (9%) had subtoptimal debulking at secondary cytoreduction. Both TLG (p=0.0043) and MTV (p=0.0025) were associated with optimal debulking; however, we found no significant association between SUVmax and debulking status (p=0.83).
The median SUVmax, MTV and TLG at the patient level were 9.00 (0.00–18.1), 7.52 ml (0.00–546.70 ml), and 35.94 g (0.00–4274.90 g). When these median values were used to group patients, Kaplan-Meier analysis showed significant associations between progression-free survival and MTV and TLG (Figure 1). Patients with an MTV above 7.52 mL and/or a TLG above 35.94 g had significantly shorter progression-free survival (p = 0.0191 for MTV and p= 0.0069 for TLG). SUVmax was not significantly related to progression-free survival (p=0.10) (Table 2 and Figure 1).
Figure 1.


Kaplan-Meier curves for progression-free survival using the median as a cut off for each FDG uptake metric (A) SUVmax, (B) Metabolic tumour volume (MTV) and (C) Total lesion glycolysis (TLG).
Table 2.
Prediction of Debulking Status by FDG PET/CT parameters using Exact Logistic Regression
| Parameter | OR | 95% CI | p-value |
|---|---|---|---|
| SUVmax | 0.98 | [0.78– 1.20] | 0.83 |
| MTV | 1.04 | [1.01– 1.09] | 0.0025 |
| TLG | 1.01 | [1.00– 1.02] | 0.0043 |
SUVmax = maximum standardized uptake value; TLG = total lesion glycolysis; MTV = metabolic tumour volume
Progression-free survival estimates at 3.5 years after secondary cytoreduction were as follows: 0.42 for patients with an MTV ≤ 7.52 mL and 0.19 for patients with an MTV > 7.52 mL; 0.46 for patients with a TLG ≤ 35.94 g and 0.15 for patients with a TLG > 35.94 g. Figure 2 shows a representative example of a patient with low SUVmax and high MTV and TLG according to the median values of the study population.
Figure 2.
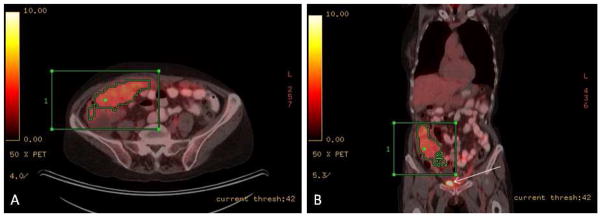
64y old female patient with recurrent ovarian cancer. Axial (A) and coronal (B) fused PET/CT images demonstrated abnormal FDG accumulation within the omentum extending to the right paracolic gutter (note that white arrow in B indicated FDG accumulation in the bladder). The tumour had a high metabolic activity, SUVmax 6.7, MTV 329 mL and TLG 1226.1 g. Patients had suboptimal secondary debulking surgery with residual disease > 1cm and had a short progression-free survival interval of 4.87 months.
DISCUSSION
Our results indicate that in patients with recurrent ovarian cancer who undergo FDG PET/CT before secondary debulking surgery, quantitative metrics that reflect the extent of metabolically active disease burden are associated with clinical outcomes. Specifically, we found that MTV and TLG were associated with optimal debulking and progression-free survival, while SUVmax did not demonstrate a relationship with neither of these outcomes.
FDG PET/CT has been found to be useful in patients with suspected ovarian cancer recurrence who have rising CA-125 levels despite negative results on standard CT or MRI [9; 14–17]. In addition, several prospective studies have shown that FDG PET/CT can modify patient management by accurately mapping the distribution of recurrent ovarian cancer [18–20]. For example, Fulham et al prospectively evaluated 90 women with suspected recurrent ovarian cancer and found that FDG PET/CT altered management in 60% of them [18].
In a previous retrospective study we evaluated associations between survival and the SUVmax at six specific sites of recurrent ovarian cancer on FDG PET/CT (reference blinded for review). Although the SUVmax of peritoneal deposits and distant lymph nodes were predictors of poor survival, there were no significant associations between survival and the SUVmax of distant metastases, pelvic recurrence, or pelvic or para-aortic lymph nodes. The results from our current study are consistent with those of a recent retrospective study by Choi et al. that included 55 patients with primary ovarian cancer who underwent FDG PET/CT before surgical staging [10]. In the latter study, Cox proportional hazard analysis showed that poor outcome (i.e., shorter progression-free survival) was associated with higher values of both MTV (p = 0.022) and TLG (p = 0.037), whereas SUVmax was not associated with outcome (p = 0.764).
The poor performance of SUVmax as a predictive biomarker in our study can be at least partially explained by the fact that SUVmax is a single-voxel measurement that does not take into account the number of voxels included in the region of interest (i.e., the tumour volume). It may be easily affected by statistical noise and not reflect the metabolism of the whole tumour burden. The small cohort size may have also contributed to the lack of statistical significance. Several metrics for evaluating FDG PET/CT data that incorporate the volume of metabolically active tumours have been developed. The metabolic tumour volume (MTV) is the sum of all voxels with an SUV above a predetermined threshold, and the total lesion glycolysis (TLG) is essentially the MTV multiplied by the mean SUV of the voxels within the ROI. The results of our study suggest that to accurately predict outcome in patients with recurrent ovarian cancer with FDG PET/CT, the use of such volume-based metrics may be necessary. Previous studies in other gynaecologic malignancies have also suggested a need for volume-based quantification of tumour FDG uptake on PET/CT [10–12].
Significant associations between quantitative FDG uptake metrics and debulking status have not been previously reported. In our study, both TLG and MTV were associated with optimal debulking, while SUVmax was not. This is an important finding, as optimal secondary cytoreduction is a strong predictor of outcome. In a study of 153 patients who underwent secondary cytoreductive surgery for recurrent ovarian cancer, Chi et al. found that residual disease measuring ≤0.5 cm was associated with significant survival benefits [21].
To our knowledge, this is the first study to evaluate whether PET/CT metrics reflecting tumour burden are significantly associated with progression-free survival in patients with recurrent ovarian cancer. Our study has, however, several limitations. First, it is a retrospective analysis of a relatively small number of patients with recurrent ovarian cancer who underwent secondary cytoreductive surgery at a single institution, and we cannot extrapolate our results to patients with recurrent ovarian cancers that are not treated surgically. Second, while we applied the most commonly used method for measuring MTV and TLG (by using a threshold of 42% of SUVmax), FDG uptake quantification metrics are dependent on technical metrics and the segmentation algorithm used. Third, we did not evaluate inter-reader agreement in this specific context, although our prior experience has shown that the metrics reported in this study are highly reproducible when measured both in tumours and normal background activity [22; 23]. Fourth, our sample size was small and did not allow for meaningful analysis of the relationships between quantitative metrics of FDG uptake and overall survival partially due to the limited number of events. In some scenarios overall survival may be a stronger end point for clinical studies. However in this particular study population in addition to the limited number of events there were multiple confounding factors that could influence overall survival (patient age, comorbidities, treatment received at the time of progression after the cytoreductive surgery evaluated in this study, etc) and therefore it was felt progression-free survival would be a more adequate (and statistically plausible) measure to consider for evaluating associations with imaging. Nevertheless, our findings could form the basis of a larger prospective evaluation to further determine the potential role of such metrics as both predictive and prognostic biomarkers of progression-free and overall survival in patients with recurrent ovarian cancer.
In conclusion, our results suggest that FDG PET/CT quantitative metrics that reflect the metabolic tumour burden are associated with optimal secondary cytoreductive surgery and progression-free survival in patients with recurrent ovarian cancer.
Table 3.
Associations between FDG PET/CT quantitative metrics and progression-free survival
| Parameter | Group | 3.5 yr survival est. (95% CI) | p-value |
|---|---|---|---|
| SUVmax | ≤ 9.00 | 0.38 (0.24–0.62) | |
| > 9.00 | 0.22 (0.11–0.45)) | 0.10 | |
| MTV | ≤7.52 | 0.42 (0.27–0.65) | |
| >7.52 | 0.19 (0.08–0.41) | 0.0191 | |
| TLG | ≤ 35.94 | 0.46 (0.30–0.69) | |
| >35.94 | 0.15 (0.06–0.37) | 0.0069 |
Key points.
Both TLG and MTV were associated with optimal tumour debulking.
There was no significant association between SUVmax and tumour debulking status.
Patients with higher MTV and/or TLG had significantly shorter PFS.
SUVmax was not significantly related to PFS.
Acknowledgments
The scientific guarantor of this publication is Evis Sala. The authors of this manuscript declare no relationships with any companies, whose products or services may be related to the subject matter of the article. This project was supported in part by NIH grant P30 CA008748. HA Vargas is supported by the Kaleidoscope of Hope Foundation. One of the authors (Debra A Goldman) has significant statistical expertise. Institutional Review Board approval was obtained. Written informed consent was waived by the Institutional Review Board. Some study subjects or cohorts have been previously reported in: Sala, E., et al., (2010) Recurrent ovarian cancer: use of contrast-enhanced CT and PET/CT to accurately localize tumor recurrence and to predict patients’ survival. Radiology 257(1):125–34. Methodology: retrospective, diagnostic or prognostic study, performed at one institution.
Abbreviations
- FDG
18F-fluorodeoxyglucose
- MTV
metabolically-active tumour volume
- PET
positron-emission tomography
- SUV
standardized uptake value
- TLG
total lesion glycolysis
References
- 1.Hennessy BT, Coleman RL, Markman M. Ovarian cancer. Lancet. 2009;374:1371–1382. doi: 10.1016/S0140-6736(09)61338-6. [DOI] [PubMed] [Google Scholar]
- 2.Piccart MJ, Bertelsen K, Stuart G, et al. Long-term follow-up confirms a survival advantage of the paclitaxel-cisplatin regimen over the cyclophosphamide-cisplatin combination in advanced ovarian cancer. Int J Gynecol Cancer. 2003;13(Suppl 2):144–148. doi: 10.1111/j.1525-1438.2003.13357.x. [DOI] [PubMed] [Google Scholar]
- 3.Rochon J, du Bois A. Clinical research in epithelial ovarian cancer and patients’ outcome. Ann Oncol. 2011;22(Suppl 7):vii16–vii19. doi: 10.1093/annonc/mdr421. [DOI] [PubMed] [Google Scholar]
- 4.Baumann KH, Wagner U, du Bois A. The changing landscape of therapeutic strategies for recurrent ovarian cancer. Future Oncol. 2012;8:1135–1147. doi: 10.2217/fon.12.112. [DOI] [PubMed] [Google Scholar]
- 5.Harter P, Sehouli J, Reuss A, et al. Prospective validation study of a predictive score for operability of recurrent ovarian cancer: the Multicenter Intergroup Study DESKTOP II. A project of the AGO Kommission OVAR, AGO Study Group, NOGGO, AGO-Austria, and MITO. Int J Gynecol Cancer. 2011;21:289–295. doi: 10.1097/IGC.0b013e31820aaafd. [DOI] [PubMed] [Google Scholar]
- 6.Bristow RE, Puri I, Chi DS. Cytoreductive surgery for recurrent ovarian cancer: a meta-analysis. Gynecol Oncol. 2009;112:265–274. doi: 10.1016/j.ygyno.2008.08.033. [DOI] [PubMed] [Google Scholar]
- 7.Friedlander M, Trimble E, Tinker A, et al. Clinical trials in recurrent ovarian cancer. Int J Gynecol Cancer. 2011;21:771–775. doi: 10.1097/IGC.0b013e31821bb8aa. [DOI] [PubMed] [Google Scholar]
- 8.Forstner R, Sala E, Kinkel K, Spencer JA. ESUR guidelines: ovarian cancer staging and follow-up. Eur Radiol. 2010;20:2773–2780. doi: 10.1007/s00330-010-1886-4. [DOI] [PubMed] [Google Scholar]
- 9.Gu P, Pan LL, Wu SQ, Sun L, Huang G. CA 125, PET alone, PET-CT, CT and MRI in diagnosing recurrent ovarian carcinoma: a systematic review and meta-analysis. Eur J Radiol. 2009;71:164–174. doi: 10.1016/j.ejrad.2008.02.019. [DOI] [PubMed] [Google Scholar]
- 10.Chung HH, Kwon HW, Kang KW, et al. Prognostic value of preoperative metabolic tumor volume and total lesion glycolysis in patients with epithelial ovarian cancer. Ann Surg Oncol. 2012;19:1966–1972. doi: 10.1245/s10434-011-2153-x. [DOI] [PubMed] [Google Scholar]
- 11.Yoo J, Choi JY, Moon SH, et al. Prognostic significance of volume-based metabolic parameters in uterine cervical cancer determined using 18F-fluorodeoxyglucose positron emission tomography. Int J Gynecol Cancer. 2012;22:1226–1233. doi: 10.1097/IGC.0b013e318260a905. [DOI] [PubMed] [Google Scholar]
- 12.Burger IA, Vargas HA, Donati OF, et al. The value of 18F-FDG PET/CT in recurrent gynecologic malignancies prior to pelvic exenteration. Gynecol Oncol. 2013;129:586–592. doi: 10.1016/j.ygyno.2013.01.017. [DOI] [PMC free article] [PubMed] [Google Scholar]
- 13.Erdi YE, Mawlawi O, Larson SM, et al. Segmentation of lung lesion volume by adaptive positron emission tomography image thresholding. Cancer. 1997;80:2505–2509. doi: 10.1002/(sici)1097-0142(19971215)80:12+<2505::aid-cncr24>3.3.co;2-b. [DOI] [PubMed] [Google Scholar]
- 14.Kitajima K, Murakami K, Yamasaki E, et al. Performance of integrated FDG-PET/contrast-enhanced CT in the diagnosis of recurrent ovarian cancer: comparison with integrated FDG-PET/non-contrast-enhanced CT and enhanced CT. Eur J Nucl Med Mol Imaging. 2008;35:1439–1448. doi: 10.1007/s00259-008-0776-3. [DOI] [PubMed] [Google Scholar]
- 15.Nanni C, Rubello D, Farsad M, et al. (18)F-FDG PET/CT in the evaluation of recurrent ovarian cancer: a prospective study on forty-one patients. Eur J Surg Oncol. 2005;31:792–797. doi: 10.1016/j.ejso.2005.02.029. [DOI] [PubMed] [Google Scholar]
- 16.Sironi S, Messa C, Mangili G, et al. Integrated FDG PET/CT in patients with persistent ovarian cancer: correlation with histologic findings. Radiology. 2004;233:433–440. doi: 10.1148/radiol.2332031800. [DOI] [PubMed] [Google Scholar]
- 17.Thrall MM, DeLoia JA, Gallion H, Avril N. Clinical use of combined positron emission tomography and computed tomography (FDG-PET/CT) in recurrent ovarian cancer. Gynecol Oncol. 2007;105:17–22. doi: 10.1016/j.ygyno.2006.10.060. [DOI] [PubMed] [Google Scholar]
- 18.Fulham MJ, Carter J, Baldey A, Hicks RJ, Ramshaw JE, Gibson M. The impact of PET-CT in suspected recurrent ovarian cancer: A prospective multi-centre study as part of the Australian PET Data Collection Project. Gynecol Oncol. 2009;112:462–468. doi: 10.1016/j.ygyno.2008.08.027. [DOI] [PubMed] [Google Scholar]
- 19.Simcock B, Neesham D, Quinn M, Drummond E, Milner A, Hicks RJ. The impact of PET/CT in the management of recurrent ovarian cancer. Gynecol Oncol. 2006;103:271–276. doi: 10.1016/j.ygyno.2006.03.004. [DOI] [PubMed] [Google Scholar]
- 20.Soussan M, Wartski M, Cherel P, et al. Impact of FDG PET-CT imaging on the decision making in the biologic suspicion of ovarian carcinoma recurrence. Gynecol Oncol. 2008;108:160–165. doi: 10.1016/j.ygyno.2007.07.082. [DOI] [PubMed] [Google Scholar]
- 21.Chi DS, McCaughty K, Diaz JP, et al. Guidelines and selection criteria for secondary cytoreductive surgery in patients with recurrent, platinum-sensitive epithelial ovarian carcinoma. Cancer. 2006;106:1933–1939. doi: 10.1002/cncr.21845. [DOI] [PubMed] [Google Scholar]
- 22.Burger IA, Vargas HA, Apte A, et al. PET quantification with a histogram derived total activity metric: superior quantitative consistency compared to total lesion glycolysis with absolute or relative SUV thresholds in phantoms and lung cancer patients. Nucl Med Biol. 2014;41:410–418. doi: 10.1016/j.nucmedbio.2014.02.006. [DOI] [PMC free article] [PubMed] [Google Scholar]
- 23.Burger IA, Vargas HA, Beattie BJ, et al. How to assess background activity: introducing a histogram-based analysis as a first step for accurate one-step PET quantification. Nucl Med Commun. 2014;35:316–324. doi: 10.1097/MNM.0000000000000045. [DOI] [PubMed] [Google Scholar]