

Abstract
Circulating tumor cells (CTCs) express epithelial and stem cell like genes, though current approved detection methods mainly employ epithelial markers. We optimized a CTC isolation method which could capture their molecular heterogeneity and predict overall survival (OS) in metastatic CRC (mCRC) patients receiving various chemotherapy regimens. We combined immunomagnetic enrichment of CD45-negative, EpCAM-positive circulating cancer cells with qRT-PCR amplification of CK20 and survivin expression in 88 mCRC patients and 20 healthy controls. We then evaluated the prognostic value of baseline CTC CK20 and survivin expression in mCRC patients. The presence of elevated CTC CK20 or survivin expression distinguished mCRC patients from controls with sufficient sensitivity (79.6%) and specificity (85%). In univariate analysis, patients with high CTC-CK20 expression (9 v. 33.2+ months, log-rank P < 0.001) or high CTC-survivin expression (10 v. 33.2+ months, log-rank P = 0.032) had a significantly worse median OS than those with low expression of either marker. In multivariable analysis, the high CTC-CK20 group had significantly shortened OS (HR = 3.11, adjusted P = 0.01), and there was a trend towards inferior OS in the high CTC-survivin group (HR = 1.76, adjusted P = 0.099). Patients with either high CTC CK20 or survivin expression had inferior OS compared to those with low expression of both markers (HR = 4.39, 95% CI 1.56, 12.35; adjusted P = 0.005). CRC CTCs can be reliably isolated using epithelial and stem-cell markers. CTC CK20 and survivin expression may effectively predict OS in mCRC patients receiving chemotherapy.
Keywords: CK20, circulating tumor cell, metastatic colorectal cancer, immunomagnetic selection, qRT-PCR, survivin
Introduction
Colorectal cancer (CRC) is the leading cause of death from gastrointestinal malignancy in the United States(1), and mortality is invariably linked to metastatic disease. The development of metastases is largely mediated by circulating tumor cells (CTCs) which are shed by the primary tumor and survive within the circulation to home to distant organs(2, 3). CTC detection provides a non-invasive liquid biopsy that heralds the onset of metastases prior to conventional radiographic imaging and predicts therapeutic response and clinical outcomes once metastases have formed. Among CRC patients, CTC enumeration and biomarker expression have been associated with clinicopathologic stage(4, 5), surgical resection of metastases(6), tumor recurrence(4) and response(7), as well as overall survival (OS)(7-9).
While definitions vary between studies, it is widely accepted that CTCs lack CD45 and express epithelial cell adhesion molecule (EpCAM) and cytokeratins (CKs). In gastrointestinal tumors, CK20 is a sensitive and specific marker for circulating cancer cells(10, 11), with prognostic utility in CRC patients(8, 12). Recent data suggests that CTCs share characteristics of cancer stem cells(13-18), and the canonical Wnt pathway is integral to both stem cell function and colorectal carcinogenesis(19). Survivin(20, 21), a downstream signaling target of Wnt activation, is highly conserved in colorectal tumors(22-24) and rarely detected in normal tissue(25). Histologic(26-29) and CTC survivin expression have been shown to predict disease stage(11) and survival(30)in CRC.
Current CTC detection platforms, including the immunomagnetic-based CellSearch® assay(31), primarily utilize epithelial markers and may not fully capture the stemness of CTCs(19, 32). Moreover, studies have shown that quantitative real time-PCR (qRT-PCR) affords improved sensitivity compared to immunomagnetic enrichment techniques alone(33, 34). Constructing an optimized CTC isolation method with sufficient sensitivity, specificity, and efficiency has the potential to better inform therapeutic decisions.
We hypothesized that isolation of CTCs which co-express epithelial and stem cell-like genes may predict clinical outcomes in metastatic CRC (mCRC) patients. Using commercially available kits, we coupled immunomagnetic enrichment of CD45-negative, EpCAM-positive circulating cancer cells with qRT-PCR amplification of epithelial (CK20) and stem cell (survivin) markers in mCRC patients. We validated our approach by comparing mRNA expression of CK20 and surviving in healthy controls and cancer patients, using four different colon cancer cell lines (HT29, SW480, HCT116, Caco2). We then used our hybrid platform to determine the prognostic value of baseline CTC CK20 and surviving gene expression in mCRC patients receiving different chemotherapy regimens.
Patients and Methods
Patient Population and Study Design
We conducted a feasibility study of a combined immunomagnetic qRT-PCR method to determine the prognostic significance of CTC CK20 and surviving gene expression in patients with histologically confirmed metastatic colorectal cancer, defined as metastatic disease at initial presentation or measureable tumor recurrence after curative surgical resection. Patients consented solely for peripheral blood collection and received standard FDA-approved therapies (including varying combinations of fluoropyrimidines, oxaliplatin, irinotecan, bevacizumab, cetuximab, panitumumab) or received experimental agents being tested in phase I or II clinical trials and consented for molecular correlate studies. Patients were enrolled at the Norris Comprehensive Cancer Center-University of Southern California (NCCC-USC) or the Los Angeles County-USC (LAC-USC) Medical Center, between June 2009 and April 2014. Prior to treatment initiation, all patients underwent baseline serum measurements of carcinoembryonic antigen (CEA) and lactate dehydrogenase (LDH) levels, as well as contrast-enhanced computed tomography (CT) scans of the chest, abdomen, and pelvis to determine extent of metastatic disease. The Institutional Review Board at USC approved the study. All study participants signed informed consent for the analysis of molecular correlates in accordance with the Declaration of Helsinki. Twenty-four healthy blood donors (aged ≥ 18 years), who had no known medical illness or history of malignant disease, served as control subjects. Each patient and control subject provided two sets of peripheral blood to confirm reproducibility. All CTC studies were performed without knowledge of patients' clinical status.
Sample Collection and Peripheral Blood Mononuclear Cell (PBMC) Isolation
A total of 16 ml of blood was drawn from each patient into two Vacutainer® CPT™ Tubes (8 ml per tube) with Sodium Citrate (BD). All samples were maintained at room temperature and centrifuged within two hours of collection. Blood samples were centrifuged at room temperature (18-25°C) in a horizontal rotor (swing-out head) for a minimum of 30 minutes at 2,700-2,800 RPM, and peripheral blood mononuclear cells were then collected.
Positive and Negative Immunomagnetic Separation using CD45+ Depletion and EpCAM+Tumor Cell Enrichment
Negative immunomagnetic selection using anti-CD45 specific antibodies (Dynabeads™ M-450 CD45 pan Leukocyte, Invitrogen) was performed to enrich for tumor cells following the manufacturer's instructions. The CD45-negative (CD45-) supernatant was transferred to 15-ml tubes for immune separation employing Dynabeads™ (Dynabeads™ Epithelial Enrich, #161.02, Invitrogen). Using Dynabeads™ coated with a monoclonal antibody towards human EpCAM, tumor cell selection was performed following the manufacturer's instructions.
Isolation of poly(A) mRNA and cDNA Synthesis
mRNA was isolated from enriched cell fractions using the Dynabeads™ mRNA DIRECT Micro Kit (Life Technologies, NY, USA). Following the manufacturer's instructions, highly purified and intact mRNA was isolated. cDNA was reverse transcribed with 12.5 μl mRNA (total 25 μl), using the qScript™ cDNA Synthesis Kit (BioRad #170-8891; Quanta Biosciences, MD, USA) according to the manufacturer's instructions.
qRT-PCR and Multiplex-PCR Analysis
CK20 and survivin mRNA expression levels were analyzed by the iTaq™ Fast SYBR Green Supermix (BioRad #172-5101; BioRad, CA, USA) and an Applied Biosystems 7500 PCR Detection System (Applied Biosystems, Inc). Gene expression levels were determined by normalization against the reference, β-actin, using the 2–ΔΔCT method (yielding the fold expression compared to the average ΔCq of control subjects; ΔCq = Cq (target) - Cq(β-actin)). Values are presented as the mean ± SD.
Analysis of mRNA Expression
The forward primer, 5′-AGAACTGGCCCTTCTTGGAGG-3′, and reverse primer, 5′-CTTTTTATGTTCCTCTATGGGGTC-3′, were used to measure survivin expression. The forward primer, 5′-CTGAATAAGGTCTTTGATGACC-3′, and reverse primer 5′-ATGCTTGTGTAGGCCATCG-3′ were used to measure CK20 expression. The forward primer, 5′-CAACTGGGACGACATGGA-3′, and reverse primer, 5′-GTTGGCCTTGGGGTTCAG-3′, were used to measure β-actin expression. Primers were validated by standard curves with an R2 > 0.95, and PCR efficiency at 100 ± 2% was confirmed for each primer. Threshold cycle values (CT) were determined from three independently isolated RNA samples run in triplicate.
Cell Spiking Experiments
The sensitivity and specificity of CK20 and survivin expression for CTC detection were investigated using whole blood from healthy controls and human colon cancer cell lines: HT29, SW480, HCT116 and Caco2. All cell lines were purchased from American Type Culture Connection (ATCC, Lockville, MD) in 2007 (HCT116) and 2011(HT29, SW480 and Caco2) (no authentication was done by the authors). HT29, SW480, HCT116 and Caco2 cell lines were maintained in McCoy's 5A and DMEM media, respectively, and supplemented with 10% fetal bovine serum (Lonza, East Rutherford, NJ), 5% penicillin/streptomycin, sodium pyruvate and L-Glutamine (Mediatech, Inc. Manassas, VA). We tested whether CK20 and surviving could be detected from live-captured cancer cells by spiking normal blood with HT29, SW480, HCT116 and Caco2 cancer cells. After using trypsin to dissociate the cells, the number of colon cancer cells was counted three times and their mean was determined. Predetermined numbers of cells (10, 100, and 1000) were spiked in 8 ml peripheral blood samples from healthy controls to test our enrichment method with Dynabeads. After mRNA isolation, CK20 and surviving expression were analyzed by RT-PCR and q-RT-PCR.
Statistical Analysis
A descriptive analysis was used to determine the precision of mRNA levels of CK20 and survivin in blood samples. The mean, standard deviation, and coefficient of variation (CV) of the mRNA levels of CK20 and survivin in blood samples among healthy controls were calculated per level of tumor cells added. The distribution of the mRNA levels of CK20 and surviving in the blood samples of mCRC patients and healthy controls was summarized with medians and ranges. The difference in the mRNA level of CK20 and surviving between patients with mCRC and healthy controls was tested using the AUC of the ROC curve. With 20 healthy controls and 88 mCRC patients, we had 98% power to detect a difference of 0.25 between the area under the ROC curve (AUC) under the null hypothesis of 0.5 and an AUC under the alternative hypothesis of 0.75 using a two-sided z-test at a significance level of 0.05. The cutoff values of CK20 and surviving were determined in the blood samples of healthy donors with and without added tumor cells using the maximal chi-square method. P values were adjusted from multiple testing using 2000 bootstrap like simulations.
Overall survival (OS) was defined as the period from the date of CTC collection to the date of death. The relationships between mRNA levels of CK20 and surviving and OS in mCRC patients were assessed using the cutoff values determined in the previous step by Kaplan-Meier curves, the log-rank test in the univariable analysis, and by Cox regression model in multivariable analysis adjusting for the baseline patient characteristics and treatment.
Results
Patient and Tumor Characteristics
Patient demographics and clinical characteristics are summarized in Table 1. Among the 88 mCRC patients, the median duration of follow-up was 23.5 months (range: 1.3, 44.1 months), and median OS was 11.0 months (95% CI: 9.0, 17.2 months). Patients received a median of 3 prior lines of therapy for metastatic disease (range 0-5). The majority of patients had received fluoropyrimidines (96.6%), oxaliplatin (89.8%), irinotecan (72.7%), and bevacizumab (86.3%) prior to CTC collection. After CTC collection, 64.8% of patients received experimental therapies on clinical trials. There was an even distribution of primary tumor site between patients, and most did not have liver-limited metastases. There was a modest positive correlation between CTC CK20 expression and baseline CEA level (Spearman correlation coefficient = 0.25, P = 0.023).
Table 1. Patient Demographics and Clinical Characteristics (N = 88).
| N | Median (95%CI), months | HR (95%CI), Univariable analysis | P | HR (95%CI), multivariable analysis† | P† | |
|---|---|---|---|---|---|---|
| Age, yrs | 0.14 | 0.31 | ||||
| <45 | 14 | 38.6 (4.7, 44.1+) | 1 (reference) | 1 (reference) | ||
| 45-64 | 51 | 10.3 (8.4, 19.3) | 1.95 (0.82, 4.60) | 1.35 (0.54, 3.38) | ||
| ≥65 | 23 | 10.0 (7.6, 17.4) | 2.26 (0.92, 5.56) | 1.92 (0.75, 4.92) | ||
| Sex | 0.62 | 0.86 | ||||
| Male | 48 | 10.3 (8.0, 16.9) | 1 (reference) | 1 (reference) | ||
| Female | 40 | 14.5 (8.6, 21.5) | 0.88 (0.52, 1.49) | 1.05 (0.61, 1.79) | ||
| Race | 0.096 | 0.43 | ||||
| White | 56 | 15.6 (10.0, 26.5) | 1 (reference) | 1 (reference) | ||
| African American | 3 | 8.9 (7.7, 10.2) | 1.66 (0.38, 7.16) | 1.71 (0.37, 7.96) | ||
| Asian | 11 | 9.2 (3.6, 14.5) | 2.28 (1.11, 4.67) | 1.55 (0.74, 3.23) | ||
| Hispanic | 18 | 8.0 (5.1, 21.1) | 1.54 (0.80, 2.93) | 1.57 (0.80, 3.09) | ||
| Primary Tumor Site | 0.41 | 0.49 | ||||
| Right colon | 24 | 16.7 (7.2, 21.5) | 1 (reference) | 1 (reference) | ||
| Left CRC | 61 | 11.4 (8.4, 19.3) | 0.88 (0.50, 1.56) | 0.93 (0.52, 1.65) | ||
| Unspecified | 3 | 10.0 (5.4, 10.0) | 1.87 (0.54, 6.54) | 1.91 (0.55, 6.65) | ||
| Liver only metastases | 0.20 | 0.092 | ||||
| Yes | 16 | 16.9 (6.4, 33.2+) | 1 (reference) | 1 (reference) | ||
| No | 72 | 10.0 (8.0, 16.7) | 1.61 (0.76, 3.41) | 1.93 (0.90, 4.15) | ||
| ECOG | 0.49 | 0.086 | ||||
| 0 | 32 | 14.5 (7.7, 23.8) | 1 (reference) | 1 (reference) | ||
| 1-2 | 56 | 10.4 (8.6, 17.4) | 1.20 (0.69, 2.07) | 1.63 (0.93, 2.85) | ||
| Number of prior treatments | 0.001 | 0.11 | ||||
| 0-1 | 20 | 33.3 (16.7, 38.6) | 1 (reference) | 1 (reference) | ||
| 2 | 23 | 6.6 (4.5, 11.0) | 4.45 (1.90, 10.43) | 3.09 (1.13, 8.44) | ||
| 3 | 25 | 10.0 (7.8, 21.1) | 2.63 (1.11, 6.23) | 2.23 (0.84, 5.91) | ||
| 4-5 | 20 | 10.3 (7.7, 14.5) | 2.72 (1.12, 6.61) | 1.74 (0.61, 5.00) | ||
| Therapy initiated after CTC collection | <.001 | <.001 | ||||
| Standard therapy | 31 | 33.3 (15.6, 38.6) | 1 (reference) | 1 (reference) | ||
| Experimental | 57 | 8.6 (6.9, 10.3) | 3.65 (1.93, 6.89) | 4.47 (2.28, 8.76) | ||
| Baseline CEA | 0.000 | 0.016 | ||||
| ≤36 | 41 | 21.1 (10.3, 35.5) | 1 (reference) | 1 (reference) | ||
| >36 | 42 | 8.0 (6.9, 10.0) | 2.59 (1.45, 4.64) | 2.16 (1.15, 4.05) | ||
| Baseline LDH | 0.001 | 0.048 | ||||
| ≤300 | 53 | 17.4 (10.0, 33.3) | 1 (reference) | 1 (reference) | ||
| >300 | 15 | 8.0 (3.6, 11.0) | 3.20 (1.43, 7.18) | 2.44 (1.01, 5.88) |
Based on the multivariable Cox regression model adjusting for the current treatment (experimental vs. standard therapy) and the primary tumor site (right colon vs. left CRC vs. unspecified)
Validation of Immunomagentic Enrichment Followed by RT-PCR/qRT-PCR in Healthy Controls with Colon Cancer Cells
We optimized the capture of CRC CTCs by using the following protocol sequence: negative immunomagnetic selection of CD45- cells, enrichment for EpCAM positive cells using Dynabeads™, and selection of CK20 and survivin mRNA-positive cells by qRT-PCR amplification.
We first determined the sensitivity, specificity, and accuracy of using CK20 and survivin mRNA expression for CTC detection by immunomagnetic RT-PCR and qRT-PCR. Spiking experiments were carried out using four CRC cell lines (HCT116, SW480, HT29 and Caco2) in healthy control samplesto determine the limit of detection and optimal cutoff values of CK20 and survivin mRNA expression.
To validate the CK20 and survivin primers, 1 μg mRNA was isolated from Caco2 cells. The amount of Caco2 mRNA was then serially diluted (1 μg, 100 ng, 10 ng, 1 ng, 100 pg, 10 pg, 0.1 pg) in 1xPBS, and qRT-PCR was performed. Primers were validated by standard curves, and PCR-efficiency at 100 ±2% was confirmed for each primer (Figure 1A). Next, we tested whether CK20 and surviving could be detected from live-captured cancer cells by spiking healthy donor blood with HT29, SW480, HCT116 and Caco2 cancer cells. After using trypsin to dissociate the cells, the number of colon cancer cells was counted three times, and their mean was determined. Predetermined numbers of HCT116 (5, 10, 20, 50, 100, 1000) (qRT-PCR) and HT29 (10, 20 50, 100) (RT-PCR) were spiked in 8 ml peripheral blood from healthy donors to optimize tumor cell enrichment using Dynabeads. After mRNA isolation, CK20 and survivin were analyzed by RT-PCR and qRT-PCR (Figures 1B and 1C). All CRC cell lines expressed both CK20 and survivin, whereas neither marker was detected in the peripheral blood from healthy controls. The limit of detection for each was 0-10 colon cancer cells per 8 ml of healthy donor peripheral blood. As shown in Figure 1D, after varying numbers (0, 10, 100, 1000) of HT29, HCT116, SW480 and Caco2 cells were spiked into the whole blood of 4 healthy donors, CK20 and survivin gene expression were measured by immunomagnetic bead-based qRT-PCR. Based on these experiments, the optimal cutoff values for the level of mRNA gene expression were: CK20: 0.14 and survivin: 0.092.
Figure 1. Cell Spiking Experiments.
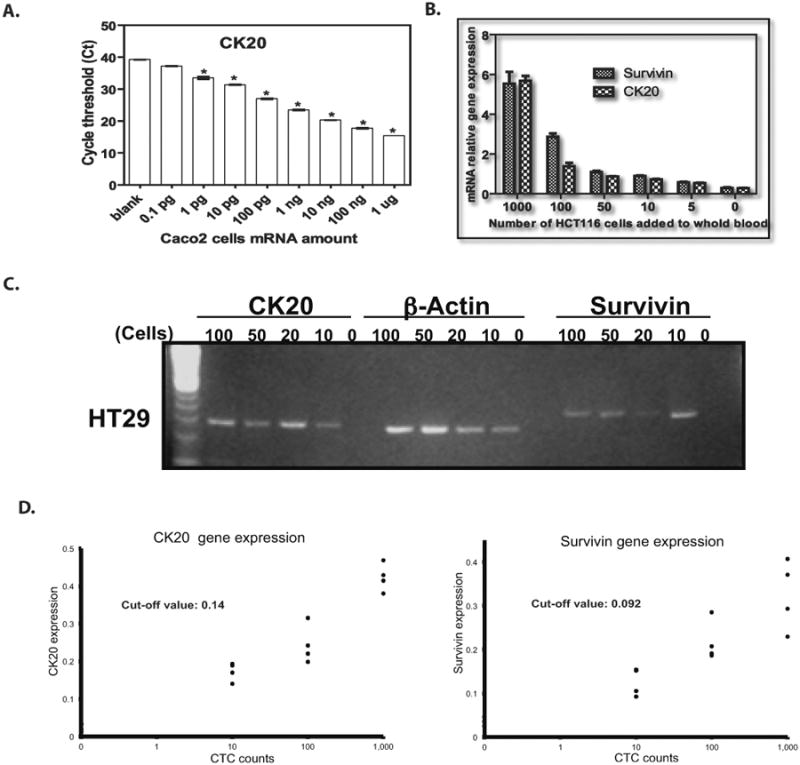
CK20 expression level detected from serial dilutions of Caco2 cells mRNA. All histogram results are means of triplicate independent experiments (P < 0.05).
B. CK20 and survivin gene expression were measured by immunomagnetic qRT-PCR by adding varying numbers of HCT 116 colon cancer cells (5, 10, 50, 100, 1000) into the whole blood of one healthy donor.
C. CK20 and survivin gene expression on 2% agarose gel from HT29 colon cancer cells (10, 20, 50, 100) by immunomagnetic RT-PCR.
D. The cutoff values for the level of mRNA gene expression were: CK20: 0.14 and survivin: 0.092.
Validation of CTC Detection by Immunomagnetic qRT-PCR in mCRC Patients
Next, we determined the sensitivity and specificity of using CK20 and survivin mRNA expression, as measured by immunomagnetic qRT-PCR, for CTC detection by using peripheral blood samples from 20 healthy donors and 88mCRC patients. Cutoff values for CK20 and survivin gene expression were established to obtain sufficient sensitivity and specificity. With regards to CK20 expression, receiver-operating characteristic (ROC) curves showed that a cutoff value of 0.16 for CK20 yielded a sensitivity of 76% and specificity of 85% (Figure 2A). Among 88 mCRC patients, 67 had high CK20 expression (> 0.16) compared to 3 of 20 healthy donors (P < 0.005) (Figure 2B). Similarly, a cutoff value of 0.15 for surviving was found to yield a sensitivity of 72% and specificity of 100% (Figure 2A). Within the mCRC cohort, 63 of 88 patients had high levels of survivin expression (> 0.15), compared to 0 of 20 healthy donors (P < 0.001) (Figure 2B). Sixty-eight percent (N = 60) of mCRC patients had elevated levels of both CK20 and survivin expression, and 79% (N = 70) had elevations in either marker. Taken together, using either elevated CTC CK20 or surviving expression yielded a sensitivity of 79.6% and specificity of 85% for CTC detection in mCRC patients (Supplementary figure 1). Twenty percent of mCRC patients (18 of 88) had decreased expression of both markers compared with 85% (17 of 20) of healthy donors (Table 2).
Figure 2. ROC Analysis of CTC CK20 and Survivin Gene Expression.
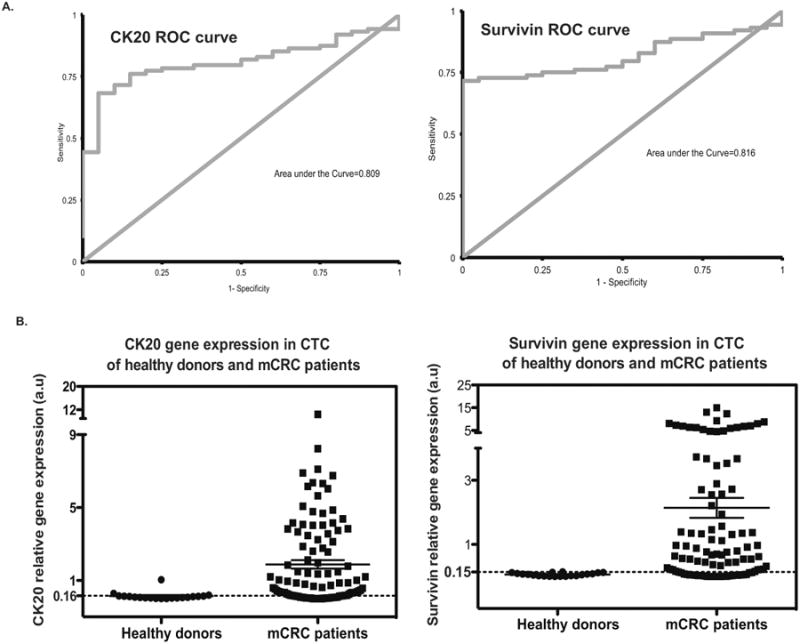
A. ROC curves of CK20 and surviving expression in mCRC patients compared to healthy donors.
B. CTC CK20 and survivin gene expression by using immunomagnetic qRT-PCR approach were analyzed following the cutoff values established with sufficient sensitivity and specificity from 20 healthy donors and 88 mCRC patients. Left: An optimal cutoff value of 0.16 for CK20 yields a sensitivity of 76% and specificity of 85%; Right: An optimal cutoff value of 0.15 for survivin yields a sensitivity of 72% and specificity of 100%.
Table 2. Detection of CTC Biomarkers in mCRC Patients and Healthy Controls by Immunomagnetic qRT-PCR.
| Control Group (N = 20) | mCRC Patients (N = 88) | |
|---|---|---|
| Biomarker | ||
| CK20 | 3 (15%) | 67 (76%) |
| Survivin | 0 | 63 (71%) |
|
| ||
| Numbers of Markers Detected | ||
| 0 | 17 (85%) | 18 (20%) |
| ≥ 1 | 3 (15%) | 70 (79%) |
| 2 | 0 | 60 (68%) |
Cutoff Points: CK20 > 0.16, Survivin > 0.15
Prognostic Utility of CTC CK20 and Survivin Expression in mCRC Patients by Immunomagnetic qRT-PCR
We determined the association between CTC CK20 and survivin gene expression and overall survival (OS) in our cohort of mCRC patients. In univariate analysis, patients with high CTC CK20 (> 0.16) or survivin (> 0.15) gene expression had a significantly worse median OS than those with low expression of either marker (CK20: HR = 4.01; 95% CI 1.73, 9.27, log-rank P < 0.001; survivin: HR = 1.99; 95% CI 1.03, 3.85, log-rank P = 0.032) (Table 3).
Table 3. Association Between CTC Gene Expression Levels and Overall Survival (OS) in mCRC Patients.
| Gene | N | Median (95%CI), months | HR (95%CI), univariable analysis | P | HR (95%CI), multivariable analysis† | P† |
|---|---|---|---|---|---|---|
| CK20 | <0.001 | 0.010 | ||||
| ≤0.16 | 21 | 33.2+ (15.6, 33.2+) | 1 (reference) | 1 (reference) | ||
| >0.16 | 67 | 9.0 (7.8, 11.4) | 4.01 (1.73, 9.27) | 3.11 (1.31, 7.41) | ||
| Survivin | 0.032 | 0.099 | ||||
| ≤0.15 | 25 | 33.2+ (8.4, 33.2+) | 1 (reference) | 1 (reference) | ||
| >0.15 | 63 | 10.0 (8.0, 16.7) | 1.99 (1.03, 3.85) | 1.76 (0.90, 3.44) | ||
| CK20/Survivin | <0.001 | 0.005 | ||||
| ≤0.16 and ≤0.15 | 18 | 33.2+ (9.2, 33.2+) | 1 (reference) | 1 (reference) | ||
| >0.16 or >0.15 | 70 | 9.4 (7.8, 13.1) | 5.16 (1.89, 14.09) | 4.39 (1.56, 12.35) | ||
Based on the multivariable Cox regression model adjusting for the current treatment (experimental vs. standard therapy) and the primary tumor site (right colon vs. left CRC vs. unspecified)
Baseline variables associated with OS included number of prior therapies, treatment received after CTC collection, and LDH level. In a multivariate model stratified for these variables, high CTC CK20 expressing patients had significantly shortened survival relative to those with low CTC CK20 expression (HR = 3.11; 95% CI 1.31, 7.41; adjusted P = 0.01), and patients with high CTC survivin expression had a trend towards inferior OS (HR = 1.76; 95% CI 0.90, 3.44; adjusted P = 0.099)(Figure 3, Table 3). Patients with either high CTC CK20 or survivin expression had significantly worse OS than those with low expression of both genes in univariate (HR = 5.16; 95% CI 1.89, 14.09; log-rank P < 0.001), and multivariate analyses (HR = 4.39; 95% CI 1.56, 12.35; log-rank P = 0.005) (Figure 3, Table 3).
Figure 3. Kaplan-Meier Cumulative Survival Curves Stratified by CTC CK20 and Survivin Expression.
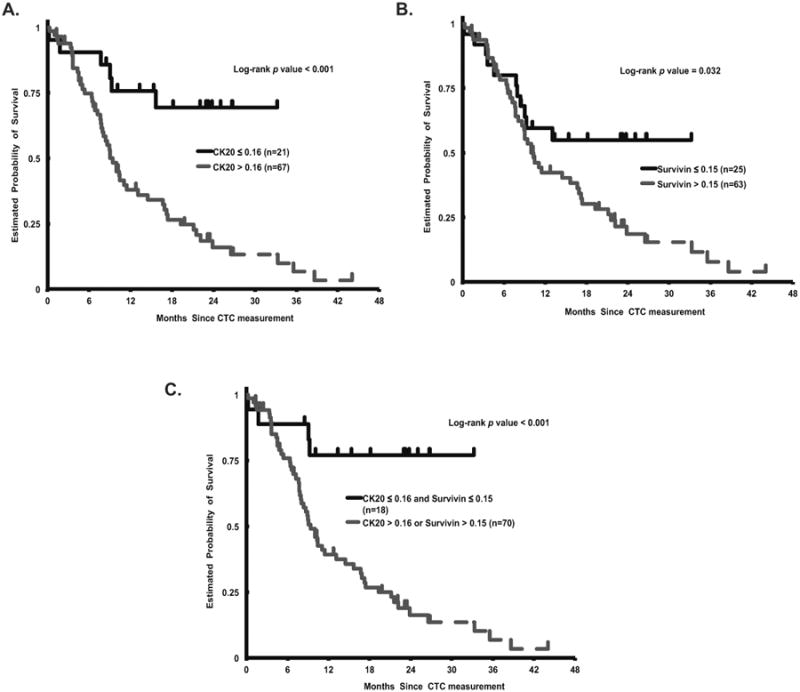
Overall survival (OS) curves according to A. CTC CK20 expression (log-rank P < 0.001) B. CTC survivin expression (log-rank P = 0.032) C. CTC elevated CK20 or survivin expression (log-rank P < 0.001).
Discussion
CTC isolation allows for an assessment of cancer recurrence, therapeutic response and resistance, and prognosis. Efforts to molecularly characterize CTCs have advanced our understanding of how metastases develop, but what defines a CTC and the role of stem cell markers in shaping this definition is not fully elucidated. We optimized a combined immunomagnetic qRT-PCR protocol for colorectal CTC characterization based on epithelial and stem cell biomarkers. Using this assay, we evaluated the clinical relevance of pretreatment CTC CK20 and survivin expression in mCRC patients receiving various chemotherapeutic and experimental agents and found this molecular signature to predict survival.
Circulating tumor cells are as heterogeneous as the tumors from which they originate, and this has made CTC detection methods vulnerable to limitations in efficiency, sensitivity and standardization(32). For instance, in the study by Cohen et al. which examined the prognostic utility of CTC count using the CellSearch assay in mCRC patients(7), 52% of patients had no detectable baseline CTCs in a 7.5 ml blood sample, and only 27% of patients with radiographic disease progression had a corresponding unfavorable CTC profile (as defined by ≥ 3 CTCs). In a subsequent investigation of 836 individuals with metastatic breast, colorectal or prostate cancer, all patients were found to have at least one CTC using the CellSearch method, but only after extrapolating the individual blood volume to 5 L with a logistic regression model(32). These findings underscore the need for improving diagnostic yield, either by modifying the enrichment procedure and/or adjusting the biomarker criteria for CTC detection.
With regards to enrichment techniques, Guo and colleagues(33) compared the additive value of using negative and positive immunomagnetic selection to RT-PCR and found the combination of both separation methods to yield the best sensitivity. Furthermore, qRT-PCR has consistently demonstrated superior sensitivity relative to CellSearch and other immunomagnetic-based tools for CTC detection in CRC patients(34), and combining this modality with an immunomagnetic enrichment step eliminates a substantial source of false-positive results. With respect to marker selection, the use of multiple genes may lower the detection limit of a particular assay but at the cost of decreased specificity. To circumvent these obstacles and balance diagnostic yield with specificity, we selected CK20 as a well-established marker for CTC detection in CRC patients(35) and survivin, which is more specific to malignant tissue and has been associated with the development of CRC metastases(28). In our study, CTC CK20 and survivin expression each showed acceptable sensitivity (CK20: 76%; survivin: 72%) and high specificity (CK20: 85%; survivin: 100%). Using both markers together, our combined immunomagnetic qRT-PCR assay demonstrated 79.6% sensitivity and 85% specificity for CTC identification in mCRC patients. This compares more favorably to the only other study(11) examining these biomarkers in mCRC patients using an immunomagnetic qRT-PCR method (sensitivities 47.4%, 57.7% and specificities 83.2%, 80.0% for CTC CK20 and survivin expression, respectively), though the caveats inherent to cross-study comparison and the different cancer cell lines used limit definitive conclusions.
In our cohort of mCRC patients, the presence of CTCs and baseline expression of each measured biomarker independently predicted OS. Specifically, patients whose CTCs had either elevated CK20 or survivin gene expression had anover 3-times increased risk of death, as compared to patients with low CTC expression of both markers. Our findings are consistent with that of prior investigations examining the prognostic utility of these biomarkers in CRC patients, though these studies mainly evaluated either CK20(10, 12) or survivin(30) in isolation, did not use a combined immunomagnetic qRT-PCR assay(12), or did not explicitly evaluate associations with survival(10, 11). To the best of our knowledge, our study represents the largest cohort of CRC patients with metastatic disease evaluated for both CTC CK20 and survivin expression using a combined enrichment and amplification approach.
Our study has its limitations, the first of which is its retrospective nature. Importantly, by examining only baseline peripheral blood samples, we could not explore the predictive utility of this gene signature with each chemotherapeutic regimen. One of the main limitations of qRT-PCR-based techniques is the potential for false-positive results. For instance, circulating epithelial cells from non-malignant disease states (such as inflammatory bowel disease, polyps, etc.) may express CK20, though previous studies(12) have shown this to not be the case. Moreover, we accounted for this potential limitation by incorporating two immunomagnetic enrichment steps and determining optimal cutoff values to better distinguish cancer cells from non-malignant cells. Another potential limitation is that a proportion of CTCs may lose their epithelial marker expression as they undergo the epithelial mesenchymal transition (EMT) and therefore may not be detected by our method. In subsequent studies, we plan to incorporate and compare the predictive and prognostic value of different CTC EMT and stem cell associated markers.
Predicting the onset of metastatic disease and monitoring response to treatment with a non-invasive, reproducible method remains a fundamental objective in individualizing cancer care. CTC enumeration and biomarker assessment may provide a safe and simple means of achieving this objective by exposing the dynamic molecular alterations driving disease progression and therapeutic efficacy. However, the implementation of CTC technology into clinical decision-making is still in its infancy, as our approach to defining and detecting CTCs continues to evolve. Using an immunomagnetic qRT-PCR platform, we validated a gene expression signature based on epithelial and stem cell markers capable of CTC detection with sufficient sensitivity, specificity, and efficiency. This model effectively predicted prognosis in mCRC patients. Future investigations should determine the predictive utility of this model by incorporating it into biomarker-driven therapeutic trials.
Supplementary Material
Acknowledgments
This work was supported by the National Institute of Health (P30CA014089 to H-J. Lenz) and the Gloria Borges Wunderglo Foundation (H-J. Lenz). M.D. Berger received a grant from the Swiss Cancer League (BIL KLS-3334-02-2014).
Footnotes
Disclosure of Potential Conflicts of Interest: All authors have no potential conflicts of interest to disclose.
References
- 1.Siegel R, Desantis C, Jemal A. Colorectal cancer statistics, 2014. CA Cancer J Clin. 2014;64:104–17. doi: 10.3322/caac.21220. [DOI] [PubMed] [Google Scholar]
- 2.Engell HC. Cancer cells in the circulating blood; a clinical study on the occurrence of cancer cells in the peripheral blood and in venous blood draining the tumour area at operation. Acta chirurgica Scandinavica Supplementum. 1955;201:1–70. [PubMed] [Google Scholar]
- 3.Pantel K, Alix-Panabieres C, Riethdorf S. Cancer micrometastases. Nat Rev Clin Oncol. 2009;6:339–51. doi: 10.1038/nrclinonc.2009.44. [DOI] [PubMed] [Google Scholar]
- 4.Wang JY, Wu CH, Lu CY, Hsieh JS, Wu DC, Huang SY, et al. Molecular detection of circulating tumor cells in the peripheral blood of patients with colorectal cancer using RT-PCR: significance of the prediction of postoperative metastasis. World J Surg. 2006;30:1007–13. doi: 10.1007/s00268-005-0485-z. [DOI] [PubMed] [Google Scholar]
- 5.Sastre J, Maestro ML, Puente J, Veganzones S, Alfonso R, Rafael S, et al. Circulating tumor cells in colorectal cancer: correlation with clinical and pathological variables. Ann Oncol. 2008;19:935–8. doi: 10.1093/annonc/mdm583. [DOI] [PubMed] [Google Scholar]
- 6.Jiao LR, Apostolopoulos C, Jacob J, Szydlo R, Johnson N, Tsim N, et al. Unique localization of circulating tumor cells in patients with hepatic metastases. Journal of clinical oncology : official journal of the American Society of Clinical Oncology. 2009;27:6160–5. doi: 10.1200/JCO.2009.24.5837. [DOI] [PubMed] [Google Scholar]
- 7.Cohen SJ, Punt CJ, Iannotti N, Saidman BH, Sabbath KD, Gabrail NY, et al. Relationship of circulating tumor cells to tumor response, progression-free survival, and overall survival in patients with metastatic colorectal cancer. Journal of clinical oncology : official journal of the American Society of Clinical Oncology. 2008;26:3213–21. doi: 10.1200/JCO.2007.15.8923. [DOI] [PubMed] [Google Scholar]
- 8.Katsumata K, Sumi T, Mori Y, Hisada M, Tsuchida A, Aoki T. Detection and evaluation of epithelial cells in the blood of colon cancer patients using RT-PCR. Int J Clin Oncol. 2006;11:385–9. doi: 10.1007/s10147-006-0590-5. [DOI] [PubMed] [Google Scholar]
- 9.Cohen SJ, Punt CJ, Iannotti N, Saidman BH, Sabbath KD, Gabrail NY, et al. Prognostic significance of circulating tumor cells in patients with metastatic colorectal cancer. Annals of oncology : official journal of the European Society for Medical Oncology / ESMO. 2009;20:1223–9. doi: 10.1093/annonc/mdn786. [DOI] [PubMed] [Google Scholar]
- 10.Guo J, Xiao B, Jin Z, Qin L, Chen J, Chen H, et al. Detection of cytokeratin 20 mRNA in the peripheral blood of patients with colorectal cancer by immunomagnetic bead enrichment and real-time reverse transcriptase-polymeras chain reaction. Journal of gastroenterology and hepatology. 2005;20:1279–84. doi: 10.1111/j.1440-1746.2005.03894.x. [DOI] [PubMed] [Google Scholar]
- 11.Shen C, Hu L, Xia L, Li Y. Quantitative real-time RT-PCR detection for survivin, CK20 and CEA in peripheral blood of colorectal cancer patients. Jpn J Clin Oncol. 2008;38:770–6. doi: 10.1093/jjco/hyn105. [DOI] [PubMed] [Google Scholar]
- 12.Wong SC, Chan CM, Ma BB, Hui EP, Ng SS, Lai PB, et al. Clinical significance of cytokeratin 20-positive circulating tumor cells detected by a refined immunomagnetic enrichment assay in colorectal cancer patients. Clinical cancer research : an official journal of the American Association for Cancer Research. 2009;15:1005–12. doi: 10.1158/1078-0432.CCR-08-1515. [DOI] [PubMed] [Google Scholar]
- 13.Reya T, Morrison SJ, Clarke MF, Weissman IL. Stem cells, cancer, and cancer stem cells. Nature. 2001;414:105–11. doi: 10.1038/35102167. [DOI] [PubMed] [Google Scholar]
- 14.Al-Hajj M, Clarke MF. Self-renewal and solid tumor stem cells. Oncogene. 2004;23:7274–82. doi: 10.1038/sj.onc.1207947. [DOI] [PubMed] [Google Scholar]
- 15.Chaffer CL, Weinberg RA. A perspective on cancer cell metastasis. Science. 2011;331:1559–64. doi: 10.1126/science.1203543. [DOI] [PubMed] [Google Scholar]
- 16.Aktas B, Tewes M, Fehm T, Hauch S, Kimmig R, Kasimir-Bauer S. Stem cell and epithelial-mesenchymal transition markers are frequently overexpressed in circulating tumor cells of metastatic breast cancer patients. Breast Cancer Res. 2009;11:R46. doi: 10.1186/bcr2333. [DOI] [PMC free article] [PubMed] [Google Scholar]
- 17.Armstrong AJ, Marengo MS, Oltean S, Kemeny G, Bitting RL, Turnbull JD, et al. Circulating tumor cells from patients with advanced prostate and breast cancer display both epithelial and mesenchymal markers. Molecular cancer research : MCR. 2011;9:997–1007. doi: 10.1158/1541-7786.MCR-10-0490. [DOI] [PMC free article] [PubMed] [Google Scholar]
- 18.Kasimir-Bauer S, Hoffmann O, Wallwiener D, Kimmig R, Fehm T. Expression of stem cell and epithelial-mesenchymal transition markers in primary breast cancer patients with circulating tumor cells. Breast cancer research : BCR. 2012;14:R15. doi: 10.1186/bcr3099. [DOI] [PMC free article] [PubMed] [Google Scholar]
- 19.Zeuner A, Todaro M, Stassi G, De Maria R. Colorectal cancer stem cells: from the crypt to the clinic. Cell stem cell. 2014;15:692–705. doi: 10.1016/j.stem.2014.11.012. [DOI] [PubMed] [Google Scholar]
- 20.Fukuda S, Pelus LM. Elevation of Survivin levels by hematopoietic growth factors occurs in quiescent CD34+ hematopoietic stem and progenitor cells before cell cycle entry. Cell cycle. 2002;1:322–6. [PubMed] [Google Scholar]
- 21.Zhang T, Otevrel T, Gao Z, Gao Z, Ehrlich SM, Fields JZ, et al. Evidence that APC regulates survivin expression: a possible mechanism contributing to the stem cell origin of colon cancer. Cancer research. 2001;61:8664–7. [PubMed] [Google Scholar]
- 22.Ponnelle T, Chapusot C, Martin L, Bouvier AM, Plenchette S, Faivre J, et al. Cellular localisation of survivin: impact on the prognosis in colorectal cancer. J Cancer Res Clin Oncol. 2005;131:504–10. doi: 10.1007/s00432-005-0682-z. [DOI] [PMC free article] [PubMed] [Google Scholar]
- 23.Hernandez JM, Farma JM, Coppola D, Hakam A, Fulp WJ, Chen DT, et al. Expression of the antiapoptotic protein survivin in colon cancer. Clin Colorectal Cancer. 2011;10:188–93. doi: 10.1016/j.clcc.2011.03.014. [DOI] [PMC free article] [PubMed] [Google Scholar]
- 24.Yie SM, Lou B, Ye SR, Cao M, He X, Li P, et al. Detection of survivin-expressing circulating cancer cells (CCCs) in peripheral blood of patients with gastric and colorectal cancer reveals high risks of relapse. Annals of surgical oncology. 2008;15:3073–82. doi: 10.1245/s10434-008-0069-x. [DOI] [PubMed] [Google Scholar]
- 25.Ambrosini G, Adida C, Altieri DC. A novel anti-apoptosis gene, survivin, expressed in cancer and lymphoma. Nat Med. 1997;3:917–21. doi: 10.1038/nm0897-917. [DOI] [PubMed] [Google Scholar]
- 26.Kawasaki H, Altieri DC, Lu CD, Toyoda M, Tenjo T, Tanigawa N. Inhibition of apoptosis by survivin predicts shorter survival rates in colorectal cancer. Cancer research. 1998;58:5071–4. [PubMed] [Google Scholar]
- 27.Sarela AI, Macadam RC, Farmery SM, Markham AF, Guillou PJ. Expression of the antiapoptosis gene, survivin, predicts death from recurrent colorectal carcinoma. Gut. 2000;46:645–50. doi: 10.1136/gut.46.5.645. [DOI] [PMC free article] [PubMed] [Google Scholar]
- 28.Chu XY, Chen LB, Wang JH, Su QS, Yang JR, Lin Y, et al. Overexpression of survivin is correlated with increased invasion and metastasis of colorectal cancer. J Surg Oncol. 2012;105:520–8. doi: 10.1002/jso.22134. [DOI] [PubMed] [Google Scholar]
- 29.Goossens-Beumer IJ, Zeestraten EC, Benard A, Christen T, Reimers MS, Keijzer R, et al. Clinical prognostic value of combined analysis of Aldh1, Survivin, and EpCAM expression in colorectal cancer. British journal of cancer. 2014;110:2935–44. doi: 10.1038/bjc.2014.226. [DOI] [PMC free article] [PubMed] [Google Scholar]
- 30.Gazzaniga P, Gradilone A, Petracca A, Nicolazzo C, Raimondi C, Iacovelli R, et al. Molecular markers in circulating tumour cells from metastatic colorectal cancer patients. Journal of cellular and molecular medicine. 2010;14:2073–7. doi: 10.1111/j.1582-4934.2010.01117.x. [DOI] [PMC free article] [PubMed] [Google Scholar]
- 31.Allard WJ, Matera J, Miller MC, Repollet M, Connelly MC, Rao C, et al. Tumor cells circulate in the peripheral blood of all major carcinomas but not in healthy subjects or patients with nonmalignant diseases. Clinical cancer research : an official journal of the American Association for Cancer Research. 2004;10:6897–904. doi: 10.1158/1078-0432.CCR-04-0378. [DOI] [PubMed] [Google Scholar]
- 32.Coumans FA, Ligthart ST, Uhr JW, Terstappen LW. Challenges in the enumeration and phenotyping of CTC. Clinical cancer research : an official journal of the American Association for Cancer Research. 2012;18:5711–8. doi: 10.1158/1078-0432.CCR-12-1585. [DOI] [PubMed] [Google Scholar]
- 33.Guo J, Xiao B, Zhang X, Jin Z, Chen J, Qin L, et al. Combined use of positive and negative immunomagnetic isolation followed by real-time RT-PCR for detection of the circulating tumor cells in patients with colorectal cancers. Journal of molecular medicine. 2004;82:768–74. doi: 10.1007/s00109-004-0590-8. [DOI] [PubMed] [Google Scholar]
- 34.Iinuma H, Watanabe T, Mimori K, Adachi M, Hayashi N, Tamura J, et al. Clinical significance of circulating tumor cells, including cancer stem-like cells, in peripheral blood for recurrence and prognosis in patients with Dukes' stage B and C colorectal cancer. Journal of clinical oncology : official journal of the American Society of Clinical Oncology. 2011;29:1547–55. doi: 10.1200/JCO.2010.30.5151. [DOI] [PubMed] [Google Scholar]
- 35.Kamiyama H, Noda H, Konishi F, Rikiyama T. Molecular biomarkers for the detection of metastatic colorectal cancer cells. World J Gastroenterol. 2014;20:8928–38. doi: 10.3748/wjg.v20.i27.8928. [DOI] [PMC free article] [PubMed] [Google Scholar]
Associated Data
This section collects any data citations, data availability statements, or supplementary materials included in this article.