

Abstract
Nonclassic actions of vitamin D include potential regulation of immune function and glucose homeostasis. The bone-metabolism loop has recently been expanded to include osteocalcin, which appears to play a more direct role in pancreatic beta cell function and energy metabolism. We hypothesized that both vitamin D and osteocalcin would correlate negatively with indices of adiposity-related co-morbidity risk in periadolescents, varying by ethnic group. We analyzed anthropometric, metabolic and inflammatory markers from a multi-ethnic population of 106 school children 11–14 yrs of age studied as part of the ROAD (Reduce Obesity and Diabetes) consortium. As expected, 25-hydroxyvitamin D was inversely correlated with intact parathyroid hormone (iPTH); total (OCN) and uncarboxylated osteocalcin (uOCN) were directly correlated with each other. OCN, and uOCN concentrations correlated inversely with age. Vitamin D deficiency was most prevalent among East Asians (EA) and African Americans (AA). The highest lipid risk scores and HOMA-IR values (a measure of insulin resistance) were seen in the South Asian (SA) group. Overall, adiposity measures were inversely correlated with OCN and iPTH, whereas such relationships were not observed for vitamin D. Acute insulin response to glucose challenge correlated negatively with uOCN in all subjects, however, lipid risk score correlated negatively with uOCN only in Caucasians. The relationships between markers of calcium metabolism and body composition, glucose homeostasis, lipids, and inflammation all showed racial and ethnic differences. No consistent relationship was found between Vitamin D, and adiposity or glucose metabolism, rather vitamin D levels varied by race and ethnicity in this school-based group. These findings are consistent with the hypothesis that markers of calcium and bone metabolism may reflect risk for adiposity-related co-morbidities in children.
Keywords: Vitamin D, osteocalcin, adiposity, type 2 diabetes mellitus, inflammation
INTRODUCTION
As the prevalence of vitamin D deficiency has increased across all age groups, reports have proliferated documenting putative co-morbidities(1). NHANES data from 2008 indicate that 9% of the pediatric population in the United States have vitamin D levels below 15 ng/ml and are considered vitamin D deficient (2). Another 61% of children have vitamin D levels between 15 and 30 ng/ml and are considered vitamin D insufficient (2). Such cut-points vary by laboratory and are not strictly evidence-based (3). Recent Institute of Medicine guidelines suggest a universal definition of deficiency as a 25-hydroxyvitamin D serum level below 20 ng/ml (4).
Vitamin D is acknowledged to be especially important for normal bone growth and avoidance of rickets in childhood. The vitamin D-mediated accretion of calcium from childhood through early adulthood is a major determinant of bone integrity in old age (1). Apart from these functions, the vitamin D receptor has been found in the pancreas, brain, liver and immune system (5), and it has been hypothesized that vitamin D modulates endocrine, CNS, hepatic and immunological functions. A corollary to these hypotheses is that, beyond bone health, vitamin D deficiency might have negative implications for systemic health. Studies done in animals and in adult humans have reported negative correlations of circulating vitamin D concentrations with adiposity, insulin sensitivity, and immune function (6,7). Increased vitamin D levels during weight loss has been independently correlated with improved insulin sensitivity (8) and decreased circulating concentrations of pro-inflammatory cytokines and triglycerides (9).
These links between vitamin D, obesity, and adiposity-related co-morbidities suggest the involvement of a wider array of bone markers (10,11,12) in relevant metabolic systems. One such marker of bone metabolism is osteocalcin (OCN). This noncollagenous protein expressed in osteoblasts and adipocytes (13,14,12) exists in two forms, uncarboxylated and carboxylated, and is used as a marker for bone formation. In adults(15,16) and children(17), circulating osteocalcin levels are positively correlated with insulin sensitivity, while low levels of uncarboxylated osteocalcin correlate with beta cell dysfunction in pre-diabetic children(17). Knockout mice lacking the osteocalcin gene have more visceral fat, higher insulin resistance and higher glucose levels than wild type mice. Replacing OCN reverses these effects in mice (11,12). Interestingly, a vitamin D receptor binding site has been detected in the promoter region of the OCN gene (18). However, the exact relationship between vitamin D and OCN remains unclear, since vitamin D supplementation has no apparent effect on percent serum uOCN in adolescent girls (19), and vitamin D receptor polymorphisms are not correlated with serum OCN levels (20).
Another hormone important in bone metabolism is PTH. Typically, high levels of vitamin D inhibit PTH and vitamin D deficiency stimulates PTH secretion. Studies of parathyroid hormone (iPTH) levels in adults (21) and children (22) have reported positive correlations of iPTH and BMI, as would be expected from the negative correlation between adiposity and vitamin D. This inverse relationship between vitamin D and PTH is more variable among youth than in adults (23). There is also an independent negative correlation between circulating iPTH and insulin sensitivity in adults (24).
To further explore these observations, we investigated the relationship of serum vitamin D, OCN and iPTH to measures of adiposity, lipids, glucose metabolism and inflammatory markers in children aged 11–14. We hypothesized that both vitamin D and osteocalcin would correlate negatively with indices of adiposity-related co-morbidity risk in periadolescents. Specifically, we asked whether observations in obese pediatric clinic populations would hold true in a school-based population sample. Other aims included recruitment of an ethnically varied population and analysis of such correlations by gender, ethnicity and race.
SUBJECTS AND METHODS
Study Subjects
Blood samples were obtained from 106 middle school children (age 11–14, mean age 12.6; 61 males, 45 females). Subjects were enrolled in the ROAD (Reduce Obesity and Diabetes) study involving 5 ethnically diverse schools in the New York metropolitan area. The ethnic distribution of subjects was 22 African Americans, 21 Caucasian Americans, 24 Hispanic Americans, and 38 Asian Americans (28 East Asian, 10 South Asian); one subject could not be so classified and is not included in the table of ethnic distribution, but is included in the other data analyses. The ROAD project, a five year study, was directed through a research consortium consisting of Columbia University Medical Center, Maimonides Medical Center, Mt. Sinai School of Medicine, Cohen Children’s Medical Center of NY, and Winthrop University Hospital that has been assembled via AMDeC (Academy for Medical Development and Collaboration, New York, NY). Detailed methods for this study have been described elsewhere(25). An initial population of 619 subjects was divided into 4 groups: African American, Caucasian, Hispanic, and Asian American. For this sub-study, subjects were selected from initial screening tests performed in the Fall of the first year they were enrolled. Within each group, subjects were ranked from the lowest to the highest values for measures of insulin secretion and resistance (GDI, AIR, HOMA-IR). Subjects in the first 3 groups with the highest HOMA-IR in each 10%ile rank were chosen, followed by the highest glucose disposal index in each 10%ile rank to generate a total of 22–25 subjects per group. In the case of Asian-Americans, a similar procedure was used for the highest values of HOMA-IR and GDI each 5%ile rank to generate a total of 38 subjects to include a mixed population of East Asians (from China, Japan, Taiwan, and Korea) and South Asians (from India, Pakistan, Ceylon, Bangladesh). Outliers for fasting insulin or inflammatory markers (IL-6, TNF-alpha, CRP) more than 3 SD from the mean were eliminated prospectively on the assumption that such subjects were probably either not truly fasting or were ill. More specifically, 5 subjects were excluded for insulin > 40 mIU/ml; 3 subjects were excluded because of IL-6 > 4.2 pg/ml; 2 subjects were excluded because of TNF-alpha > 9.6 pg/ml. and 3 subjects were excluded because of CRP >36.2 pg/ml. There was some overlap between these groups and a total of 12 subjects were excluded from individual analyses. An additional 2 subjects were excluded because of inadequate sample collection. The clinical protocol was approved by the Institutional Review Board for each participating hospital, school boards and the Department of Health and Education. This study was conducted in conformity with the guiding principles for research involving humans (26). Written informed consent and assent were obtained from all parents and students, respectively.
Procedures
Height, weight, BMI and waist circumference (at the iliac crest) were measured; BMI Z-score (27) and waist Z-score (28) were calculated. Body composition was measured by bioimpedance using an Omron Body Fat Analyzer HBF-300 (Omron Health Care, Inc., Vernon Hills, IL). Dietary history of vitamin D and daily dairy intake were estimated from the Block Food Frequency Questionnaire(29). Fasting blood samples were assayed for glucose, insulin, 25-hydroxy vitamin D(25-OH vitamin D), iPTH, uncarboxylated osteocalcin (uOCN), total osteocalcin (tOCN), c-reactive protein (CRP), interleukin 6 (IL-6), tumor necrosis factor- α (TNF-α), and adiponectin (ACRP30). Participants received an intravenous infusion of 0.5 gm/kg dextrose (maximum 25 g) over 3 minutes. Blood was drawn for insulin concentrations at 1, 3 and 5 minutes after the infusion.
Laboratory Analyses
Serum vitamin D was measured by radioimmunoassay (RIA) (Diasorin, Stillwater, MN). The intra- and inter-assay variability were 8.2% and 10.5%, respectively. In view of uncertainty as to cut-points for vitamin D deficiency, measurements were analyzed as a continuous variable. Total OCN levels were measured in serum samples using enzyme-linked immunosorbent assay (ELISA) (IDS, Fountain Hills, AZ). The intra and inter-assay variability were 1.8% and 2.7%, respectively. Uncarboxylated OCN levels were also measured in serum samples using a separate ELISA (Takara Bio Inc, Madison, WI). The intra and inter-assay variability were 4.4% and 9.5%, respectively. Intact PTH was measured by immunoradiometric assay (IRMA) (Scantibodies, Santee, CA). The intra-assay variability ranged from 3.2 – 4.8% and the interassay variability ranged from 3.6 – 6.8%. Vitamin D, OCN, and iPTH levels were all measured in duplicate. Glucose was measured by the hexokinase method (Glucose/HK; Roche Molecular Biochemicals, Werk Penzbuerg, Federal Republic of Germany). Plasma insulin was measured by solid phase 125-I-RIA (Coata-count; DPC, Los Angeles, CA). CRP, TNF-α, and adiponectin (ACRP30) were determined by ELISA. IL-6 was assayed by RIA (R+D Systems, Minneapolis, MN).
Statistical analysis and calculations
Fat mass was calculated from the weight and the % body fat using the following equation {fat mass = (weight)(% body fat)/100}. The homeostatic model for assessment of insulin resistance (HOMA-IR) was calculated as described (30). First phase insulin release was examined using the acute insulin response (AIR) which was calculated as the mean rise in circulating concentrations of insulin 3 and 5 minutes following administration of intravenous dextrose. Because insulin sensitivity and insulin release are significantly correlated, the glucose disposal index (GDI) was calculated as log10 (AIR x fasting glucose concentration/fasting insulin concentration) to examine insulin secretory capacity once corrected for insulin sensitivity (31,32).
Data are presented as mean ± SD unless otherwise indicated. Whenever possible, data were converted into Z-scores to control for the effects of age and gender. This was done for BMI and waist circumferences as indices of adiposity, truncal adiposity, and for total cholesterol, triglyceride, HDL, and LDL for lipids. In addition, we calculated a “lipid risk score” similar to the Framingham risk score (33), as the Z-scores for LDL plus triglycerides minus the Z-score for HDL. Further analyses of individual components of the lipid panel were conducted only if there were significant differences between ethnic groups in the lipid risk score, or if there was a significant correlation of bone markers with the lipid risk score. Multiple linear regression analyses were performed and partial correlation coefficients calculated, using the entire data set for race and each bone marker as independent variables and measures of glucose homeostasis, lipids, and inflammation as individual dependent variables, respectively. Similar analyses were conducted using BMI Z-score as an independent variable and each bone marker as a dependent variable. When race was a significant covariate, further analyses comparing individual ethnic groups were conducted. Using this technique significantly reduces the number of comparisons being made. The initial hypotheses were that bone markers are significantly correlated with fat (BMI Z-score), truncal adiposity (waist circumference Z-score), insulin resistance (HOMA-IR), insulin secretory capacity (GDI), lipids (lipid risk score), and inflammatory markers. Because these dependent variables are all inter-related, post-hoc adjustments, which assume that the tests are independent, were not made (34,35,36).
Correlation coefficients were calculated among: a) vitamin D, tOCN, uOCN and iPTH; b) measures of adiposity as dependent and bone markers as independent variables and c) measures of glucose homeostasis and inflammation as dependent, and bone markers as independent variables. In the event that both circulating concentrations of bone markers and other variables were found to be significantly correlated with adiposity, we performed an ANCOVA adding age, gender and % body fat as covariates. Normality of distribution was assessed by Wilk-Shapiro testing. Statistical significance was prospectively defined as Pα<0.05. All p values <0.10 are reported.
RESULTS
Demographic and Anthropometric Characteristics (Tables 1 & 2)
Table 1.
Baseline subject characteristics by ethnic/racial group. Mean (SD) anthropometric variables
| Variable | African- American (N=22] | Caucasian- American (N=21) | Hispanic- American (N=24) | East Asian- American (N=28) | South Asian- American (N=10) | All Subjects* (N=106) |
|---|---|---|---|---|---|---|
| Gender | 12M/10F | 10M/11F | 13M/9F | 19M/9F | 6M/4F | 61M/45F |
| Age (years) | 12.9 (0.8) | 12.7 (1.0) | 13.3 (0.9) | 12.4 (0.8) | 13.1 (1.1) | 12.6 (1.0) |
| Height (cm) | 159.9 (7.9) | 156.5 (6.8) | 161.6(11.6) | 155.7 (8.5) | 160.5 (9.1) | 158.3 (9.2) |
| Weight (kg) | 60.9 (14.7) | 62.2 (15.2) | 63.0 (17.2) | 50.7 (16.2) | 56.2 (11.5) | 58.2 (15.9) |
| BMI (kg/m2) | 23.7 (5.1) | 24.9 (5.6) | 23.9 (5.2) | 20.6 (5.1) | 21.7 (3.3) | 22.9 (5.3) |
| BMI Z-score | 1.06 (1.24) | 1.84 (1.52)† | 1.53 (5.19) | 0.88 (1.67) | 0.48 (0.73) | 0.86 (1.30) |
| Waist (cm) | 78.3 (11.9) | 80.4 (13.7) | 81.0 (13.7) | 72.5 (13.9) | 78.8 (12.4) | 77.7 (13.4) |
| Waist Z-score | 0.70 (0.90) | 0.86 (1.07) | 0.98 (1.22) | 0.37 (1.12) | 0.66 (0.91) | 0.67 (1.04) |
| % Body Fat | 29.0 (9.1) | 29.7 (8.8) | 28.4 (8.3) | 25.5 (6.9) | 29.1 (7.7) | 28.0 (8.1) |
| Fat Mass (kg) | 18.6 (8.9)† | 19.3 (9.1)† | 18.8 (9.5)† | 13.5 (7.9) | 16.7 (6.7)† | 17.1 (8.7) |
| Calcium Intake (mg/day) | 917 (678)‡ | 502 (275) | 730 (368)‡ | 525 (339) | 644 (218) | 653 (438) |
| Vit. D Intake (IU/day) | 158 (97) | 104 (73) | 128 (65) | 106 (80) | 129 (31) | 122 (77) |
| Dairy Intake (#servings/day) | 1.45 (1.13)# | 0.87 (0.66) | 1.07 (0.65) | 0.73 (0.64) | 1.03 (0.31) | 1.00 (0.78) |
Includes 3 subjects (1 male, 2 female) classified as “other” because ethnicity could not be ascertained.
Bold indicates statistically significant differences.
P<0.05 vs. East Asian-Americans;
p<0.05 compared to Caucasians and East Asians;
p<0.01 compared to East Asians.
Table 2.
Mean (SD) anthropometric and biochemical variables by gender Bold indicates statistically significant differences.
| Variable | Males (n=45) | Females (n=61) |
|---|---|---|
| Demographics | ||
| Age (years) | 12.7 (0.9) | 13.0 (0.9) |
| Height (cm) | 156.5 (7.0) | 160.0 (9.9)* |
| Weight (kg) | 56.4 (14.9) | 59.5 (16.5) |
| BMI (kg/m2) | 22.9 (5.4) | 22.9 (5.1) |
| BMI Z-score | 0.80 (1.07) | 0.94 (0.92) |
| Waist circumference (cm) | 77.5 (13.1) | 77.8 (13.7) |
| % Body Fat | 29.4 (7.3) | 27.0 (8.6) |
| Fat Mass (kg) | 17.3 (8.1) | 16.9 (9.1) |
| Calcium Intake (mg/day) | 719 (481) | 549 (345) |
| Vit. D Intake (IU/day) | 135 (80) | 103 (66)* |
| Dairy Intake (#servings/day) | 1.08 (0.80) | 0.85 (0.76) |
| Bone Mineralization Markers | ||
| 25 OHD (ng/ml) | 18.7 (6.6) | 20.6(9.7) |
| %25OHD<20 ng/ml | 51% | 52% |
| %25OHD<30 ng/ml | 88% | 84% |
| Total OCN (ng/ml) | 68.7 (52.3) | 91.4 (47.0) † |
| Uncarboxylated OCN (ng/ml) | 23.9 (23.9) | 40.6 (26.9) * |
| Intact PTH (pg/ml) | 33.1 (12.9) | 30.2(11.0) |
| Lipids | ||
| Cholesterol (mg/dl) | 172 (27) | 159 (34) * |
| Cholesterol Z-score | 0.33 (1.01) | −0.04 (0.76)* |
| Triglycerides (mg/dl) | 81 (35) | 72(39) |
| Triglyceride Z-score | 0.02 (0.65) | −0.05(0.67) |
| HDL (mg/dl) | 54 (12) | 52(12) |
| HDL Z-score | 0.25 (0.90) | 0.16(0.88) |
| LDL (mg/dl) | 101 (31) | 93(23) |
| LDL Z-score | 0.14 (0.46) | 0.03(0.36) |
| Lipid Risk Score† | −0.09 (1.47) | −0.18(1.36) |
| Glucose Homeostasis | ||
| Glucose (mg/dl) | 91 (7) | 94 (7) |
| Insulin (mU/ml) | 10.7 (7.4) | 9.6(6.8) |
| QUICKI | 0.34 (0.03) | 0.35 (0.03) |
| HOMA-IR | 2.52 (1.75) | 2.21 (1.57) |
| AIR (mIU/ml) | 88.4 (91.4) | 98.0(79.6) |
| GDI | 2.84 (0.41) | 2.92(0.23) |
| Inflammatory Markers | ||
| IL-6 (pg/ml) | 1.06 (0.71) | 1.02(0.64) |
| CRP (ug/ml) | 2.81 (3.40) | 4.82 (5.83)* |
| TNF-α (pg/ml) | 2.24 (2.06) | 1.96 (1.33) |
| Adiponectin (ug/ml) | 13.7 (4.8) | 11.1 (4.7)† |
p<0.05 compared to males,
p<0.01 compared to males.
All data were normally distributed once corrected for significant age, ethnic, and gender effects as described below. Ethnic distribution is shown in Table 1; gender-specific data are shown in Table 2. The mean population BMI Z-score was 0.86 (± 1.3) and BMI Z-scores in Caucasians were significantly greater than those for East Asian subjects. Total fat mass was significantly greater in African-, Caucasian-, Hispanic- and South Asian- American children compared to East Asian-Americans. Mean waist Z-scores were 0.67 (± 1.04) without significant inter-ethnic differences. Females were significantly taller.
Metabolic measures (Tables 1–4)
Table 4.
R and p values of significant correlations.[Note to Editor: Consider using Tables 3 & 4 in supplemental online appendix.]Figures are attached separately as TIFF files.
| Variable | 25OHD | OCN | uOCN | iPTH |
|---|---|---|---|---|
| Age (years) | All: r=0.20, p=0.048 HA: r=0.44, p=0.046 |
All: r=−0.32, p=0.015 Boys: r=−0.38, p=0.003 Girls: r==0.35, p=0.032 EA: r=−0.56, p=0.004 HA:r=−0.51, p=0.021 |
All: r=−0.25, p=0.017 Boys: r=−0.35, p=0.01 EA: r=−0.54, p=0.008 HA: r=−0.51, p=0.021 |
|
| BMI (kg/m2) | All: r=−0.27, p=0.008 | Boys: r=−0.32, p=0.020 | All: r=−0.20, p=0.040 | |
| BMI Z-score | All: r=−0.20, p=0.048 | All: r=−0.24, p=0.016 | ||
| Waist (cm) | Girls: r=0.32, p=0.048 | |||
| Waist Z-score | CA: r=−0.45, p=0.044 | |||
| % Body Fat | HA: r=−0.45, p=0.050 | All: r=−0.25, p=0.014 | All: r=−0.26, p=0.007 Boys: r=−0.34, p=0.009 SA: r=−0.70, p=0.023 |
|
| Fat Mass (kg) | All: r=−0.29, p=0.004 Boys: r=−0.29, p=0.030 |
Boys: r=−0.36, p=0.007 | All: r=−0.23, p=0.021 Boys: r=−0.25, p=0.05 SA: r=−0.64, p=0.045 |
|
| 25OHD | All: r=−0.34, p<0.001 Boys: r=−0.27, p=0.05 Girls: r=−0.46, p=0.012 HA: r=−0.58, p=0.001 |
|||
| OCN | All: r=0.65, p<0.001 Boys: r=0.78, p<0.001 Girls: r=0.43, p=0.008 AA: r=0.76, p<0.001 CA: r=0.56, p=0.023 EA: r=0.89, p<0.001 HA: r=0.86, p<0.001 |
CA: r=0.61, p=0.01 | ||
| uOCN | CA: r=0.61, p=0.01 | All: r=0.65, p<0.001 Boys: r=0.78, p<0.001 Girls: r=0.43, p=0.008 AA: r=0.76, p<0.001 CA: r=0.56, p=0.023 EA: r=0.89, p<0.001 HA: r=0.86, p<0.001 |
Girls: r=0.33, p=0.048 | |
| iPTH | All: r=−0.34, p<0.001 Boys: r=−0.27, p=0.05 Girls: r=−0.46, p=0.012 HA: r=−0.58, p=0.001 |
CA: r=0.61, p=0.01 | Girls: r=0.33, p=0.048 | |
| Cholesterol (mg/dl) | Boys: r=−0.27, p=0.032 | |||
| Cholesterol Z- score | Boys: r=−0.28, p=0.031 | |||
| Triglycerides (mg/dl) | ||||
| Triglyceride Z- score | ||||
| HDL (mg/dl) | ||||
| HDL Z-score | ||||
| LDL (mg/dl) | AA: r=−0.52, p=0.021 EA: r=0.52, p=0.005 |
|||
| LDL Z-score | AA: r=−0.50, p=0.022 EA: r=0.51, p=0.006 |
CA: r=−0.68, p=0.003 | ||
| Lipid Risk Score† | AA: r=−0.44, p=0.048 | CA: r=−0.62, p=0.008 | ||
| Glucose (mg/dl) | All: r=0.20, p=0.049 | HA: r=0.52, p=0.015 | ||
| Insulin (mU/ml) | ||||
| HOMA-IR | CA: r=−0.72, p=0.006 | |||
| AIR (mIU/ml) | CA: r=−0.56, p=0.038 | All: r=−0.24, p=0.043 CA: r=−0.53, p=0.049 |
||
| GDI | All: r=−0.21, p=0.047 Girls: r=−0.45, p=0.013 |
|||
| IL-6 (pg/ml) | CA: r=−0.45, p=0.047 | AA: r=−0.50, p=0.026 | ||
| CRP (ug/ml) | ||||
| TNF-α (pg/ml) | HA: r=0.51, p=0.022 |
Boys: r=−0.37, p=0.007 HA:r=0.52, p=0.015 |
||
| Adiponectin (ug/ml) | EA: r=−0.44, p=0.036 | EA: r=−0.54, p=0.008 SA: r=−0.65, p=0.042 |
Daily vitamin D intake was significantly greater in males than females (Table 2), as reported elsewhere(37). Daily calcium intake was significantly higher in African- and Hispanic- Americans compared to Caucasian and East Asian- Americans (Table 1). Vitamin D in all subjects was significantly correlated with iPTH (r= −0.34, p<0.001). The majority of subjects in all ethnic groups had circulating 25OHD levels below 30 ng/ml, but African-, South Asian-, and East Asian-Americans had 25OHD levels below 20 ng/ml. Vitamin D deficiency was most prevalent among East Asians (EA) and African Americans (AA). Diet recall surveys indicated that on average subjects consumed only one daily dairy serving with vitamin D intake estimated at <200 IU daily. As expected, serum vitamin D levels correlated with both dairy servings & vitamin D intake by diet recall surveys in the whole cohort.
Intact PTH was significantly lower in Caucasian-Americans than in African-Americans, the groups with the highest and lowest vitamin D levels, respectively.
Total (OCN) and uncarboxylated osteocalcin (uOCN) correlated positively with each other. OCN and uOCN concentrations correlated inversely with age. Females had significantly higher total OCN (91.4±47.0 ng/ml vs. 68.7±52.3 ng/ml, p=0.03) and uOCN (40.6±26.9 ng/ml vs. 23.9±23.9 ng/ml, p=0.002). The significant effect of gender on circulating concentrations of osteocalcin remained significant even when corrected for BMI, % body fat, and fat mass (see Figure 1). Total OCN was significantly higher in East Asian-Americans than in all other ethnic groups except South Asian-Americans. Although there is no standard range for total and uOCN, levels found in our cohort were consistent with ranges demonstrated in previous pediatric studies (38).
Figure 1.

Figure 1A. Regression of BMI and tOCN in males (open squares) and females (closed squares). Overall regression equation is: Osteocalcin (ng/ml) = −2.5[BMI (kg/m2)] +141.1; r=−0.27, p=0.008. When data were analyzed as a multiple linear regression analysis treating BMI and gender (dichotomous variable) as independent variables, the overall regression equation was improved to an adjusted r2 value of 0.12, p=0.002. There were significant effects on of both BMI (semipartial r = −0.26, p=0.009) and gender (semipartial r = −0.22, p=0.025) indicating that tOCN relative to BMI was significantly lower in females.
Figure 1B. Regression of % Body Fat and tOCN in males (open circles) and females (closed circles). Overall regression equation is: Osteocalcin (ng/ml) = −1.54 (% Body Fat) +125.1; r=−0.25, p=0.014. When data were analyzed as a multiple linear regression analysis treating % Body Fat and gender (dichotomous variable) as independent variables, the overall regression equation was improved to an adjusted r2 value of 0.10, p=0.007. There were significant effects of both BMI (semipartial r = −0.23, p=0.028) and gender (semipartial r = −0.20, p=0.048) indicating that tOCN relative to % Body Fat was significantly lower in females.
Figure 1C. Regression of Fat Mass and tOCN in males (open triangles) and females (closed triangles). Overall regression equation is: Osteocalcin (ng/ml) = −1.7 [Fat Mass(kg)] – 110.9; r=−0.29, p=0.004. When data were analyzed as a multiple linear regression analysis treating Fat Mass and gender (dichotomous variable) as independent variables, the overall regression equation was improved to an adjusted r2 value of 0.13, p=0.001. There were significant effects on of both Fat Mass (semipartial r = −0.29, p=0.004) and gender (semipartial r = −0.22, p=0.027) indicating that tOCN relative to Fat Mass was significantly lower in females.
Males had higher total cholesterol (172±35 mg/dl vs 159±27 mg/dl, P<0.05), total cholesterol Z-scores (0.33±1.01 vs. −0.04±0.76, p<0.05), adiponectin (13.7±4.8 ug/ml vs. 11.1±4.7 ug/ml, p<0.01) and lower CRP (2.8±3.4 μg/ml vs. 4.8±5.8 μg/ml). None of the subjects had evidence of diabetes.
Correlations between Bone and Anthropometric Markers (Table 4, Figures 1–2)
Figure 2.
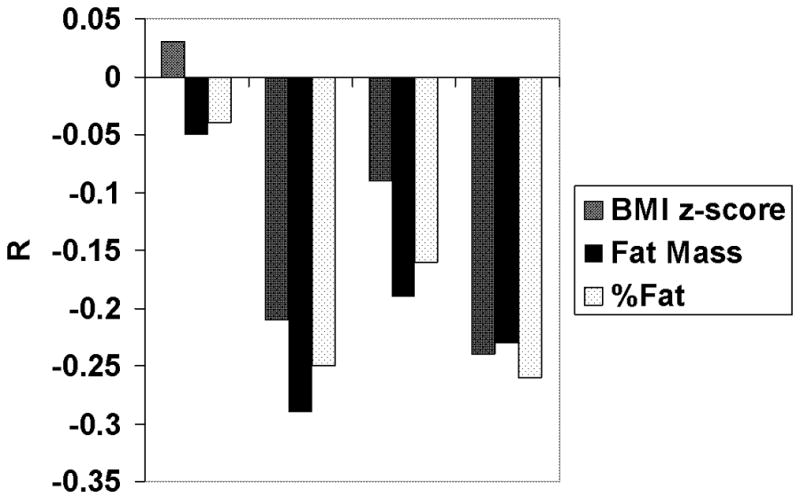
R values of correlations between bone markers and indices of body fatness corrected for age and gender (BMI Z-score), fat mass, and fractional body fat content (% body fat). No significant correlations were found with 25OHD or uOCN for any of these variables. *P<0.05.
Vitamin D was not significantly correlated with any anthropometric variables. Indices of body fatness (% fat, BMI, and BMI Z-score) and absolute fat mass correlated inversely with iPTH and OCN.
Correlations between Bone Markers and Glucose Metabolism (Table 4)
Vitamin D showed a weak negative correlation with GDI, a measure of insulin secretory capacity, in all subjects, but a stronger negative correlation in females. Greater significance was observed in the negative associations of uOCN with HOMA-IR, a measure of insulin resistance. Among Caucasians, both OCN and uOCN were inversely related to AIR, a measure of beta cell function. AIR also correlated with uOCN in the group as a whole. Fasting glucose concentrations were positively correlated with iPTH.
Correlations between Bone Markers and Inflammatory Markers (Table 4)
Vitamin D and iPTH correlated negatively with IL6 in Caucasians. OCN & uOCN correlated positively with TNFα in Hispanic Americans, and negatively with adiponectin in East Asians.
DISCUSSION
To our knowledge, this is the first pediatric study to simultaneously examine vitamin D, iPTH and osteocalcin in relation to adiposity, glucose metabolism and inflammation. Our major findings are that tOCN and iPTH, but not vitamin D itself, are negatively correlated with markers of adiposity. There were also inverse correlations between the uncarboxylated form of osteocalcin and beta cell function (AIR) and insulin resistance (HOMA-IR), respectively, that varied by racial and ethnic group. We found no direct correlation between vitamin D and OCN levels.
Our findings differ from previous studies showing vitamin D levels to be significantly lower in obese children and adults (5,6,7,20,21,22). The absence of a direct correlation between vitamin D and adiposity measures in our cohort is consistent with the observation that vitamin D supplementation to raise serum levels had no effect on body composition over a 4 year period in adults (39). Because most of the students in this study were vitamin D deficient, we examined the possibility that the significant correlations of adiposity and vitamin D noted in other studies were asymmetrically evident in vitamin D sufficient vs. vitamin D deficient populations. However, stratifying our population by vitamin D quartiles, analyzing those with levels below 20 ng/ml separately, or omitting apparent outliers, did not alter our results; no significant correlations between adiposity and vitamin D were noted in any cohorts. In multiple regression analysis vitamin D levels differed significantly by race and/or ethnicity, even when corrected for BMI Z-score. Vitamin D levels were lowest in African Americans and East Asians, whose dark skin pigment may interfere with light-induced vitamin D synthesis (40). It is interesting to note that Caucasian and Hispanic Americans had the highest vitamin D levels, and Caucasians had the lowest PTH levels. While dietary habits and vitamin supplementation practices may differ in these groups, average calcium and vitamin D intakes were low in all students based on diet recall. The ethnic specific vitamin D levels and difficulties demonstrating a robust correlation between vitamin D and adiposity measures in children of color are similar to recently published data from Rajakumar et al (41), whose Pittsburgh population was categorized solely as either African American or Caucasian. This group was only able to show a correlation between vitamin D and BMI in African Americans if they omitted an outlier with normal serum vitamin D and high BMI. However, unlike our cohort, the former group did demonstrate more highly significant inverse relationships between vitamin D levels and BMI as well as visceral fat in Caucasians (41). Future studies examining vitamin D associations must consider race, ethnicity, gender, age, existing dietary habits, subject ascertainment mode (school or population-based vs. clinic-based), and weight range of subjects (within normal weight range vs mainly overweight or obese).
Osteocalcin has been correlated inversely with both BMI and % body fat in adult humans and in mice (12,42). OCN null mice have excess visceral fat (12), whereas mice given OCN exhibit a dose-dependent decrease in fat mass (11). Thus, unlike vitamin D administration to humans which does not affect adiposity (39), OCN diminishes adiposity in animal models. We have found a strong inverse association between serum osteocalcin levels and several measures of adiposity in a school-based group of adolescents. In concordance with our results, Reinehr et al (43) found that obese children tended to have lower osteocalcin levels than the non-obese controls, and that osteocalcin was inversely correlated with HOMA-IR, a measure of insulin resistance. Interestingly, in the latter study, substantial weight loss in the obese group was associated with an increase in osteocalcin levels. We do not have a mechanistic explanation for why a significant association between AIR and OCN was only seen in Caucasians. It is quite possible that with a larger population, this association would be detected in other ethnic groups. It is also possible that other variables related to adiposity, such as pubertal status, which may affect OCN but were not assessed in this cohort, would account for some of the differences observed. This study was not powered to perform beta-analyses of non-significant associations. There is a complex interaction of age, pubertal status and gender with OCN levels. In contrast to our study, and using a different OCN assay, the HELENA cross-sectional study of bone markers in adolescents found higher serum OCN levels in males compared with females (44). Other pediatric studies showed a marginally significant OCN increment in boys (43), however puberty was not addressed. Since OCN levels seem to rise earlier in pubertal female subjects compared with males (45), this could explain the inter-study gender discrepancies. In a longitudinal study of adults, older women had higher total OCN levels compared with men (46).
With respect to glucose metabolism, mice with increased levels of osteocalcin secondary to a gain-of-function mutation exhibit greater insulin sensitivity (12). The few retrospective studies done in humans, in both children and adults, have shown a comparable inverse relationship between osteocalcin levels and measures of insulin resistance (47,43,42). Our data further refine these observations, indicating that it is the uncarboxylated form of OCN exerting major effects on beta cell function and insulin resistance, in concordance with observations in mice (11,12). The only robust correlation for vitamin D in this regard was with insulin secretory capacity as measured by GDI in females.
Our observations of associations between OCN, iPTH, measures of absolute fat mass, fractional fat mass, as well as gender effects on these parameters have not been previously reported in children. The correlation between OCN and body composition was most significant for absolute fat mass compared to other indices of adiposity (% body fat, BMI, or BMI Z-score). This suggests that OCN is more influenced by absolute fat mass than by the proportion of body fat. The existence of gender effects on the relationship of OCN to indices of body fatness indicates that there are primary gender differences in OCN production or clearance. In contrast to OCN, iPTH was most strongly correlated with % body fat, suggesting that iPTH is more influenced by the proportion of body fat, rather than by absolute fat mass. This type of relationship may be analogous to the relationships of leptin and circulating insulin concentrations to body fat: Leptin levels tend to vary by total fat mass (48), whereas insulin levels correlate better with relative fat mass, i.e. % body fat. The absence of direct correlations between vitamin D and adiposity measures suggests that OCN and iPTH may exert effects independent from vitamin D.
Several lines of evidence indicate that the nonclassic actions of vitamin D include suppression of inflammatory cytokines [reviewed in (49)]. Administration of exogenous vitamin D to adult subjects undergoing weight loss resulted in decreased circulating concentrations of pro-inflammatory cytokines (7), despite the fact that there were no significant associations between vitamin D and cytokines prior to weight loss. The inflammatory markers analyzed in the present study all reflect cytokines produced in adipocytes. Low adiponectin levels have been particularly associated with high risk for cardiovascular morbidity in adult men (50), and with early atherosclerotic changes in children (51). Based on murine studies, Lee et. al postulated that tOCN regulates insulin sensitivity partially through adiponectin (ACRP30) (12). In the elderly, there is a direct positive association of OCN and adiponectin, both negatively associated with insulin resistance (52). In our cohort, we found rather weak inverse correlations between vitamin D, PTH and IL6, and only in select ethnic groups, while OCNs displayed positive correlations with TNFα, and negative correlations with adiponectin in different ethnic populations. Reinehr and colleagues found no relationship between OCN and adiponectin in a smaller cohort of obese children (43). The source of these apparent discrepancies is unknown, but it is possible that cross-sectional sampling in growing children does not readily reveal such relationships.
One strength of the present study is the inclusion of an ethnically diverse school-based peri-adolescent population, rather than clinic-based obese subjects. A weakness is that these data represent only a single set of cross-sectional samples from a five year study. Budget constraints prevented us from measuring these many parameters in the entire subject population. It is perhaps surprising that although OCN correlated with fat mass and other adiposity measures, it was uOCN that more strongly correlated with measures of insulin resistance. We attribute this to the relatively small subject population and gender-based variability of OCN. It is important to note that this field is under active investigation, and published reports have differed. Variances have also been detected in adult men between higher serum uOCN levels which correlated with improved beta cell function, and higher OCN levels which correlated with lower insulin resistance (15) and lower risk for type 2 diabetes (16). Yet another larger study of adult men found uOCN correlated inversely with insulin resistance (53). Definitive statements about the effects of race, ethnicity, gender, age and pubertal status would require a much larger population.
In summary, our study expands upon the relationship between vitamin D, osteocalcin, iPTH, adiposity and insulin sensitivity in children. Osteocalcin seems to correlate better than vitamin D in all areas we explored: measures of adiposity, lipid risk score, insulin resistance, and inflammatory cytokines associated with metabolic syndrome. We have further demonstrated that race, ethnicity, gender and age must be considered when evaluating metabolic phenotypes. Our findings should be considered hypothesis-generating and further studies need to be done to more fully evaluate these relationships.
Table 3.
Mean (SD) biochemical variables by ethnic/racial group.
| Variable | African- American (N=22) | Caucasian-American (N=21) | Hispanic- American (N=22) | East Asian- American (N=28) | South Asian-Amer (N=10) |
|---|---|---|---|---|---|
| 25 OHD (ng/ml) | 16.0 (6.3) | 24.9 (9.4)† | 22.5 (8.2)† | 16.1 (7.1) | 18.7 (7.5) |
| %25OHD<20 ng/ml | 68% | 19% | 36% | 79% | 50% |
| %25OHD<30 ng/ml | 100% | 76% | 82% | 97% | 90% |
| Total OCN (ng/ml) | 66.7 (40.3) | 66.8 (37.5) | 70.1 (50.3) | 103.3 (52.6)‡ | 80.8 (27.5) |
| Uncarboxylated OCN (ng/ml) | 28.4 (27.7) | 34.4 (23.2) | 34.4 (29.8) | 36.2 (29.1) | 40.7 (23.6) |
| Intact PTH (pg/ml) | 34.8 (10.5) | 26.7 (8.2)# | 32.0 (14.4) | 31.2 (12.0) | 31.0 (14.8) |
| Cholesterol (mg/dl) | 174 (43) | 165 (28) | 151 (24) | 168 (22) | 169 (30) |
| Cholesterol Z-score | 0.40 (1.25) | 0.17 (0.84) | −0.22 (0.66) | 0.12 (0.74) | 0.30 (0.82) |
| Triglycerides (mg/dl) | 60 (22) | 80 (30) | 83 (36) | 78 (50) | 85 (42) |
| Triglyceride Z-score | −0.29 (0.39) | 0.05 (0.51) | 0.11 (0.63) | 0.02 (0.88) | 0.15 (0.77) |
| HDL (mg/dl) | 55 (11) | 50 (10) | 47 (12) | 59 (13) | 50 (10) |
| HDL Z-score | 0.35 (0.85) | −0.03 (0.73) | −0.15 (0.91) | 0.59 (0.97) | 0.04 (0.74) |
| LDL (mg/dl) | 107 (38) | 100 (25) | 87 (21) | 93 (21) | 102 (23) |
| LDL Z-score | 0.25 (0.57) | 0.13 (0.38) | −0.06 (0.32) | 0.01 (0.32) | 0.18 (0.35) |
| Lipid Risk Score† | −0.40 (1.19) | 0.20 (1.12) | 0.20 (1.46) | −0.56 (1.64) | 0.29 (1.45) |
| Glucose (mg/dl) | 90 (8) | 93 (7) | 92 (7) | 95 (6) | 96 (5) |
| Insulin (mU/ml) | 10.2 (6.6) | 9.0 (4.4) | 10.0 (5.4) | 9.7 (9.5) | 14.1 (7.9) |
| QUICKI | 0.35 (0.03) | 0.35 (0.03) | 0.34 (0.02) | 0.35 (0.03) | 0.32 (0.02) |
| HOMA-IR | 2.31 (1.51) | 2.30 (1.33) | 2.32 (1.24) | 2.30 (2.19) | 3.32 (1.86) |
| AIR (mIU/ml) | 140.5 (128.3) | 70.4 (44.8) | 72.1 (37.1) | 105.3 (96.7) | 79.2 (26.6) |
| GDI | 2.99 (0.27) | 2.76 (0.24) † | 2.82 (0.19) † | 3.03 (0.30) | 2.75 (0.280) |
| IL-6 (pg/ml) | 1.10 (0.68) | 0.84 (0.45) | 1.09 (0.58) | 0.99 (0.54) | 1.44 (1.24) |
| CRP (ug/ml) | 3.56 (4.40) | 3.71 (4.43) | 4.54 (6.12) | 4.30 (5.87) | 3.52 (2.88) |
| TNF-α (pg/ml) | 2.26 (2.38) | 2.31 (1.70) | 2.71 (1.50) | 1.34 (0.67) | 1.93 (2.03) |
| Adiponectin (ug/ml) | 13.7 (7.2) | 12.4 (4.3) | 11.3 (3.4) | 12.2 (4.9) | 11.4 (3.3) |
Includes 3 subjects (1 male, 2 female) classified as “other” because ethnicity could not be ascertained;
calculated as the sum of the LDL and triglyceride Z-scores minus the HDL Z-score.
Bold indicates statistically significant differences.
P<0.01 vs. African- and East Asian – Americans.
P<0.05 vs African- Caucasian- and Hispanic-Americans,
P<0.01 vs. African-Americans
Acknowledgments
Grant Support: Funding was provided through AMDeC by the Starr Foundation as well as with support from NIH grant numbers UL1RR024156, UL1RR0023568 and CTSA grant # UL1 RR024156 to Columbia University and NIH/NCRR GCRC grant #M01 RR018535 to NSLIJHS.
Grant support is detailed above. Study design: CBB, PWS, MR, DEC, SPS, SA, IF, RR. Study conduct: CBB. Data collection: CBB, PWS, MR, YE. Data interpretation: CBB, PWS, MR, DEC, SPS, SA, IF, RR, YE. Drafting and revising manuscript: CBB, PWS, MR, DEC, SPS, SA, IF, RR. Approval of final manuscript: CBB, PWS, MR, DEC, SPS, SA, IF, RR, YE. Dr. Speiser served as Dr. Boucher-Berry’s research mentor; Drs. Carey, Rosenbaum and Shelov served on the scholarly oversight committee. Dr. Speiser, as corresponding author, accepts responsibility for data integrity. ROAD Collaborators who were not included in the Writing Group helped recruit subjects, performed anthropometric measurements, collected questionnaire data and blood samples, and participated in monthly group discussions. We would like to gratefully acknowledge the invaluable participation of all the students, teachers, and school administrators, as well as the NYC Board of Health and Department of Education. Funding was provided through AMDeC by the Starr Foundation as well as with support from NIH grant numbers UL1RR024156, UL1RR0023568 and CTSA grant # UL1 RR024156 to Columbia University and NIH/NCRR GCRC grant #M01 RR018535 to NSLIJHS. We thank the GCRC nurses for assistance with sample collection. We thank Serge Cremers, PhD for technical assistance, Steven Holleran, PhD for statistical guidance, and Drs. Alan Jacobson and Stuart Weinerman for helpful comments.
Abbreviations
- ACRP30
adiponectin
- AIR
acute insulin response
- BMI
body mass index
- CRP
c reactive protein
- ELISA
enzyme linked immunosorbent assay
- FBG
fasting blood glucose
- GDI
glucose disposal index
- HgbA1c
hemoglobin A1c
- HOMA-IR
homeostatic model assessment
- IL-6
interleukin 6
- OCN
osteocalcin
- tOCN
total osteocalcin
- uOCN
uncarboxylated osteocalcin
- iPTH
intact parathyroid hormone
- QUICKI
quantitative insulin sensitivity check index
- RIA
radioimmunoassay
- IRMA
immunoradiometric assay
- TNF-α
tumor necrosis factor-alpha
- 25-OH vitamin D
25-hydroxyvitamin D
Footnotes
Disclosure summary:
All authors state that they have no conflicts of interest.
References
- 1.Holick MF, Chen TC. Vitamin D deficiency: a worldwide problem with health consequences. Am J Clin Nutr. 2008;87:1080S–1086S. doi: 10.1093/ajcn/87.4.1080S. [DOI] [PubMed] [Google Scholar]
- 2.Kumar J, Muntner P, Kaskel FJ, Hailpern SM, Melamed ML. Prevalence and associations of 25-hydroxyvitamin D deficiency in US children: NHANES 2001–2004. Pediatrics. 2009;124:e362–e370. doi: 10.1542/peds.2009-0051. [DOI] [PMC free article] [PubMed] [Google Scholar]
- 3.Misra M, Pacaud D, Petryk A, Collett-Solberg PF, Kappy M. Vitamin D deficiency in children and its management: review of current knowledge and recommendations. Pediatrics. 2008;122:398–417. doi: 10.1542/peds.2007-1894. [DOI] [PubMed] [Google Scholar]
- 4.Ross AC, Manson JE, Abrams SA, Aloia JF, Brannon PM, Clinton SK, Durazo-Arvizu RA, Gallagher JC, Gallo RL, Jones G, Kovacs CS, Mayne ST, Rosen CJ, Shapses SA. The 2011 report on dietary reference intakes for calcium and vitamin D from the Institute of Medicine: what clinicians need to know. J Clin Endocrinol Metab. 2011;96:53–58. doi: 10.1210/jc.2010-2704. [DOI] [PMC free article] [PubMed] [Google Scholar]
- 5.Prentice A, Goldberg GR, Schoenmakers I. Vitamin D across the lifecycle: physiology and biomarkers. Am J Clin Nutr. 2008;88:500S–506S. doi: 10.1093/ajcn/88.2.500S. [DOI] [PubMed] [Google Scholar]
- 6.Alemzadeh R, Kichler J, Babar G, Calhoun M. Hypovitaminosis D in obese children and adolescents: relationship with adiposity, insulin sensitivity, ethnicity, and season. Metabolism. 2008;57:183–191. doi: 10.1016/j.metabol.2007.08.023. [DOI] [PubMed] [Google Scholar]
- 7.Parikh SJ, Edelman M, Uwaifo GI, Freedman RJ, Semega-Janneh M, Reynolds J, Yanovski JA. The relationship between obesity and serum 1,25-dihydroxy vitamin D concentrations in healthy adults. J Clin Endocrinol Metab. 2004;89:1196–1199. doi: 10.1210/jc.2003-031398. [DOI] [PubMed] [Google Scholar]
- 8.Tzotzas T, Papadopoulou FG, Tziomalos K, Karras S, Gastaris K, Perros P, Krassas GE. Rising serum 25-hydroxy-vitamin D levels after weight loss in obese women correlate with improvement in insulin resistance. J Clin Endocrinol Metab. 2010;95:4251–4257. doi: 10.1210/jc.2010-0757. [DOI] [PubMed] [Google Scholar]
- 9.Zittermann A, Tenderich G, Koerfer R. Vitamin D and the adaptive immune system with special emphasis to allergic reactions and allograft rejection. Inflamm Allergy Drug Targets. 2009;8:161–168. doi: 10.2174/187152809788462644. [DOI] [PubMed] [Google Scholar]
- 10.Confavreux CB, Levine RL, Karsenty G. A paradigm of integrative physiology, the crosstalk between bone and energy metabolisms. Mol Cell Endocrinol. 2009;310:21–29. doi: 10.1016/j.mce.2009.04.004. [DOI] [PMC free article] [PubMed] [Google Scholar]
- 11.Ferron M, Hinoi E, Karsenty G, Ducy P. Osteocalcin differentially regulates beta cell and adipocyte gene expression and affects the development of metabolic diseases in wild-type mice. Proc Natl Acad Sci U S A. 2008;105:5266–5270. doi: 10.1073/pnas.0711119105. [DOI] [PMC free article] [PubMed] [Google Scholar]
- 12.Lee NK, Sowa H, Hinoi E, Ferron M, Ahn JD, Confavreux C, Dacquin R, Mee PJ, McKee MD, Jung DY, Zhang Z, Kim JK, Mauvais-Jarvis F, Ducy P, Karsenty G. Endocrine regulation of energy metabolism by the skeleton. Cell. 2007;130:456–469. doi: 10.1016/j.cell.2007.05.047. [DOI] [PMC free article] [PubMed] [Google Scholar]
- 13.Clemens TL, Karsenty G. The osteoblast: An insulin target cell controlling glucose homeostasis. J Bone Miner Res. 2011;26:677–680. doi: 10.1002/jbmr.321. [DOI] [PubMed] [Google Scholar]
- 14.Foresta C, Strapazzon G, De TL, Gianesello L, Calcagno A, Pilon C, Plebani M, Vettor R. Evidence for osteocalcin production by adipose tissue and its role in human metabolism. J Clin Endocrinol Metab. 2010;95:3502–3506. doi: 10.1210/jc.2009-2557. [DOI] [PubMed] [Google Scholar]
- 15.Hwang YC, Jeong IK, Ahn KJ, Chung HY. The uncarboxylated form of osteocalcin is associated with improved glucose tolerance and enhanced beta-cell function in middle-aged male subjects. Diabetes Metab Res Rev. 2009;25:768–772. doi: 10.1002/dmrr.1045. [DOI] [PubMed] [Google Scholar]
- 16.Hwang YC, Jeong IK, Ahn KJ, Chung HY. Circulating osteocalcin level is associated with improved glucose tolerance, insulin secretion and sensitivity independent of the plasma adiponectin level. Osteoporos Int. 2011 doi: 10.1007/s00198-011-1679-x. [DOI] [PMC free article] [PubMed] [Google Scholar]
- 17.Pollock NK, Bernard PJ, Gower BA, Gundberg CM, Wenger K, Misra S, Bassali RW, Davis CL. Lower uncarboxylated osteocalcin concentrations in children with prediabetes is associated with beta-cell function. J Clin Endocrinol Metab. 2011;96:E1092–E1099. doi: 10.1210/jc.2010-2731. [DOI] [PMC free article] [PubMed] [Google Scholar]
- 18.Lian J, Stewart C, Puchacz E, Mackowiak S, Shalhoub V, Collart D, Zambetti G, Stein G. Structure of the rat osteocalcin gene and regulation of vitamin D-dependent expression. Proc Natl Acad Sci U S A. 1989;86:1143–1147. doi: 10.1073/pnas.86.4.1143. [DOI] [PMC free article] [PubMed] [Google Scholar]
- 19.O’Connor E, Molgaard C, Michaelsen KF, Jakobsen J, Cashman KD. Vitamin D-vitamin K interaction: effect of vitamin D supplementation on serum percentage undercarboxylated osteocalcin, a sensitive measure of vitamin K status, in Danish girls. Br J Nutr. 2010;104:1091–1095. doi: 10.1017/S0007114510001935. [DOI] [PubMed] [Google Scholar]
- 20.Ozaydin E, Dayangac-Erden D, Erdem-Yurter H, Derman O, Coskun T. The relationship between vitamin D receptor gene polymorphisms and bone density, osteocalcin level and growth in adolescents. J Pediatr Endocrinol Metab. 2010;23:491–496. doi: 10.1515/jpem.2010.080. [DOI] [PubMed] [Google Scholar]
- 21.Kamycheva E, Sundsfjord J, Jorde R. Serum parathyroid hormone level is associated with body mass index. The 5th Tromso study. Eur J Endocrinol. 2004;151:167–172. doi: 10.1530/eje.0.1510167. [DOI] [PubMed] [Google Scholar]
- 22.Reinehr T, de SG, Alexy U, Kersting M, Andler W. Vitamin D status and parathyroid hormone in obese children before and after weight loss. Eur J Endocrinol. 2007;157:225–232. doi: 10.1530/EJE-07-0188. [DOI] [PubMed] [Google Scholar]
- 23.Hill KM, McCabe GP, McCabe LD, Gordon CM, Abrams SA, Weaver CM. An inflection point of serum 25-hydroxyvitamin D for maximal suppression of parathyroid hormone is not evident from multi-site pooled data in children and adolescents. J Nutr. 2010;140:1983–1988. doi: 10.3945/jn.110.124966. [DOI] [PMC free article] [PubMed] [Google Scholar]
- 24.Alvarez JA, Ashraf AP, Hunter GR, Gower BA. Serum 25-hydroxyvitamin D and parathyroid hormone are independent determinants of whole-body insulin sensitivity in women and may contribute to lower insulin sensitivity in African Americans. Am J Clin Nutr. 2010;92:1344–1349. doi: 10.3945/ajcn.110.000976. [DOI] [PMC free article] [PubMed] [Google Scholar]
- 25.Rosenbaum M, Shelov SP, Speiser PW, Accacha S, Rapaport R, Lell B, Fennoy I, Altschuler L, Carey DE. The Reduce Obesity and Diabetes (ROAD) project: Design and methodological considerations. Childhood Obesity. 2011;7:223–234. [Google Scholar]
- 26.Guiding principles for research involving animals and human beings. Am J Physiol Regul Integr Comp Physiol. 2002;283:R281–R283. doi: 10.1152/ajpregu.00279.2002. [DOI] [PubMed] [Google Scholar]
- 27.Dean AG, Arner TG, Sunki GG, Sangam S, Zubieta JC, Sullivan KM, Brendel KA, Gao Z, Fontaine N, Shu M, Fuller G, Smith DC, Nitschke DA, Fagan RF. Epi Info (TM), a database and statistics program for public health professionals. 2007. [Google Scholar]
- 28.Fernandez JR, Redden DT, Pietrobelli A, Allison DB. Waist circumference percentiles in nationally representative samples of African-American, European-American, and Mexican-American children and adolescents. J Pediatr. 2004;145:439–444. doi: 10.1016/j.jpeds.2004.06.044. [DOI] [PubMed] [Google Scholar]
- 29.Cullen KW, Watson K, Zakeri I. Relative reliability and validity of the Block Kids Questionnaire among youth aged 10 to 17 years. J Am Diet Assoc. 2008;108:862–866. doi: 10.1016/j.jada.2008.02.015. [DOI] [PubMed] [Google Scholar]
- 30.Matthews DR, Hosker JP, Rudenski AS, Naylor BA, Treacher DF, Turner RC. Homeostasis model assessment: insulin resistance and beta-cell function from fasting plasma glucose and insulin concentrations in man. Diabetologia. 1985;28:412–419. doi: 10.1007/BF00280883. [DOI] [PubMed] [Google Scholar]
- 31.Kahn SE. The relative contributions of insulin resistance and beta-cell dysfunction to the pathophysiology of Type 2 diabetes. Diabetologia. 2003;46:3–19. doi: 10.1007/s00125-002-1009-0. [DOI] [PubMed] [Google Scholar]
- 32.Rosenbaum M, Nonas C, Horlick M, Fennoy I, Vargas I, Schachner H, Kringas P, Stanton K, Weil R. beta-Cell function and insulin sensitivity in early adolescence: association with body fatness and family history of type 2 diabetes mellitus. J Clin Endocrinol Metab. 2004;89:5469–5476. doi: 10.1210/jc.2004-0971. [DOI] [PubMed] [Google Scholar]
- 33.Wilson PW, D’Agostino RB, Levy D, Belanger AM, Silbershatz H, Kannel WB. Prediction of coronary heart disease using risk factor categories. Circulation. 1998;97:1837–1847. doi: 10.1161/01.cir.97.18.1837. [DOI] [PubMed] [Google Scholar]
- 34.Perneger TV. What’s wrong with Bonferroni adjustments. BMJ. 1998;316:1236–1238. doi: 10.1136/bmj.316.7139.1236. [DOI] [PMC free article] [PubMed] [Google Scholar]
- 35.Rothman KJ. No adjustments are needed for multiple comparisons. Epidemiology. 1990;1:43–46. [PubMed] [Google Scholar]
- 36.Thomas DC, Siemiatycki J, Dewar R, Robins J, Goldberg M, Armstrong BG. The problem of multiple inference in studies designed to generate hypotheses. Am J Epidemiol. 1985;122:1080–1095. doi: 10.1093/oxfordjournals.aje.a114189. [DOI] [PubMed] [Google Scholar]
- 37.Salamoun MM, Kizirian AS, Tannous RI, Nabulsi MM, Choucair MK, Deeb ME, El-Hajj Fuleihan GA. Low calcium and vitamin D intake in healthy children and adolescents and their correlates. Eur J Clin Nutr. 2005;59:177–184. doi: 10.1038/sj.ejcn.1602056. [DOI] [PubMed] [Google Scholar]
- 38.Rauchenzauner M, Schmid A, Heinz-Erian P, Kapelari K, Falkensammer G, Griesmacher A, Finkenstedt G, Hogler W. Sex- and age-specific reference curves for serum markers of bone turnover in healthy children from 2 months to 18 years. J Clin Endocrinol Metab. 2007;92:443–449. doi: 10.1210/jc.2006-1706. [DOI] [PubMed] [Google Scholar]
- 39.Zhou J, Zhao LJ, Watson P, Zhang Q, Lappe JM. The effect of calcium and vitamin D supplementation on obesity in postmenopausal women: secondary analysis for a large-scale, placebo controlled, double-blind, 4-year longitudinal clinical trial. Nutr Metab (Lond) 2010;7:62. doi: 10.1186/1743-7075-7-62. [DOI] [PMC free article] [PubMed] [Google Scholar]
- 40.Arabi A, El RR, El-Hajj FG. Hypovitaminosis D in developing countries-prevalence, risk factors and outcomes. Nat Rev Endocrinol. 2010;6:550–561. doi: 10.1038/nrendo.2010.146. [DOI] [PubMed] [Google Scholar]
- 41.Rajakumar K, de Las HJ, Chen TC, Lee S, Holick MF, Arslanian SA. Vitamin d status, adiposity, and lipids in black american and caucasian children. J Clin Endocrinol Metab. 2011;96:1560–1567. doi: 10.1210/jc.2010-2388. [DOI] [PMC free article] [PubMed] [Google Scholar]
- 42.Saleem U, Mosley TH, Jr, Kullo IJ. Serum osteocalcin is associated with measures of insulin resistance, adipokine levels, and the presence of metabolic syndrome. Arterioscler Thromb Vasc Biol. 2010;30:1474–1478. doi: 10.1161/ATVBAHA.110.204859. [DOI] [PMC free article] [PubMed] [Google Scholar]
- 43.Reinehr T, Roth CL. A new link between skeleton, obesity and insulin resistance: relationships between osteocalcin, leptin and insulin resistance in obese children before and after weight loss. Int J Obes (Lond) 2010;34:852–858. doi: 10.1038/ijo.2009.282. [DOI] [PubMed] [Google Scholar]
- 44.Gracia-Marco L, Vicente-Rodriguez G, Valtuena J, Rey-Lopez JP, Diaz Martinez AE, Mesana MI, Widhalm K, Ruiz JR, Gonzalez-Gross M, Castillo MJ, Moreno LA. Bone mass and bone metabolism markers during adolescence: The HELENA Study. Horm Res Paediatr. 2010;74:339–350. doi: 10.1159/000314965. [DOI] [PubMed] [Google Scholar]
- 45.Szulc P, Seeman E, Delmas PD. Biochemical measurements of bone turnover in children and adolescents. Osteoporosis International. 2000;11:281–294. doi: 10.1007/s001980070116. [DOI] [PubMed] [Google Scholar]
- 46.Yoshimura N, Muraki S, Oka H, Kawaguchi H, Nakamura K, Akune T. Biochemical markers of bone turnover as predictors of osteoporosis and osteoporotic fractures in men and women: 10-year follow-up of the Taiji cohort. Mod Rheumatol. 2011 doi: 10.1007/s10165-011-0455-2. [DOI] [PubMed] [Google Scholar]
- 47.Pittas AG, Harris SS, Eliades M, Stark P, Dawson-Hughes B. Association between serum osteocalcin and markers of metabolic phenotype. J Clin Endocrinol Metab. 2009;94:827–832. doi: 10.1210/jc.2008-1422. [DOI] [PMC free article] [PubMed] [Google Scholar]
- 48.Rosenbaum M, Nicolson M, Hirsch J, Heymsfield SB, Gallagher D, Chu F, Leibel RL. Effects of gender, body composition, and menopause on plasma concentrations of leptin. J Clin Endocrinol Metab. 1996;81:3424–3427. doi: 10.1210/jcem.81.9.8784109. [DOI] [PubMed] [Google Scholar]
- 49.Bikle D. Nonclassic actions of vitamin D. J Clin Endocrinol Metab. 2009;94:26–34. doi: 10.1210/jc.2008-1454. [DOI] [PMC free article] [PubMed] [Google Scholar]
- 50.Pischon T, Girman CJ, Hotamisligil GS, Rifai N, Hu FB, Rimm EB. Plasma adiponectin levels and risk of myocardial infarction in men. JAMA. 2004;291:1730–1737. doi: 10.1001/jama.291.14.1730. [DOI] [PubMed] [Google Scholar]
- 51.Beauloye V, Zech F, Tran HT, Clapuyt P, Maes M, Brichard SM. Determinants of early atherosclerosis in obese children and adolescents. J Clin Endocrinol Metab. 2007;92:3025–3032. doi: 10.1210/jc.2007-0619. [DOI] [PubMed] [Google Scholar]
- 52.Gravenstein KS, Napora JK, Short RG, Ramachandran R, Carlson OD, Metter EJ, Ferrucci L, Egan JM, Chia CW. Cross-sectional evidence of a signaling pathway from bone homeostasis to glucose metabolism. J Clin Endocrinol Metab. 2011 doi: 10.1210/jc.2010-2589. [DOI] [PMC free article] [PubMed] [Google Scholar]
- 53.Iki M, Tamaki J, Fujita Y, Kouda K, Yura A, Kadowaki E, Sato Y, Moon JS, Tomioka K, Okamoto N, Kurumatani N. Serum undercarboxylated osteocalcin levels are inversely associated with glycemic status and insulin resistance in an elderly Japanese male population: Fujiwara-kyo Osteoporosis Risk in Men (FORMEN) Study. Osteoporos Int. 2011 doi: 10.1007/s00198-011-1600-7. [DOI] [PubMed] [Google Scholar]