Abstract
Purpose.
To evaluate retina and optic nerve damage following experimental blast injury.
Methods.
Healthy adult mice were exposed to an overpressure blast wave using a custom-built blast chamber. The effects of blast exposure on retina and optic nerve function and structure were evaluated using the pattern electroretinogram (pERG), spectral domain optical coherence tomography (OCT), and the chromatic pupil light reflex.
Results.
Assessment of the pupil response to light demonstrated decreased maximum pupil constriction diameter in blast-injured mice using red light or blue light stimuli 24 hours after injury compared with baseline in the eye exposed to direct blast injury. A decrease in the pupil light reflex was not observed chronically following blast exposure. We observed a biphasic pERG decrease with the acute injury recovering by 24 hours postblast and the chronic injury appearing at 4 months postblast injury. Furthermore, at 3 months following injury, a significant decrease in the retinal nerve fiber layer was observed using OCT compared with controls. Histologic analysis of the retina and optic nerve revealed punctate regions of reduced cellularity in the ganglion cell layer and damage to optic nerves. Additionally, a significant upregulation of proteins associated with oxidative stress was observed acutely following blast exposure compared with control mice.
Conclusions.
Our study demonstrates that decrements in retinal ganglion cell responses can be detected after blast injury using noninvasive functional and structural tests. These objective responses may serve as surrogate tests for higher CNS functions following traumatic brain injury that are difficult to quantify.
Keywords: traumatic brain injury, traumatic optic neuropathy, pattern electroretinography, blast injury
This manuscript demonstrates retinal ganglion cell deficits acutely and chronically after exposure to a blast wave in a mouse model of traumatic brain injury.
Introduction
The widespread use of improvised explosive devices (IEDs) in recent military conflicts has increased the prevalence of blast-mediated injuries in soldiers. Blast-mediated injuries are the leading cause of combat-related injuries in Operations Enduring and Iraqi Freedom, leading them to be designated as the signature injury of these conflicts.1 Residual physical symptoms reported after blast exposure include headache, nausea, light and noise sensitivity, and visual disturbances.2 However, the residual visual outcomes after closed-globe eye injury and their manifestations over time are unknown.
A pathology associated with blast injury is damage to and dysfunction of CNS neurons.3 Several clinical studies have documented electrophysiologic deficits in the afferent sensory system following traumatic brain injury (TBI).4–8 For example, a long-term analysis of visual event-related potentials (VERPs) in 17 patients with TBI reported deficits in complex visual integrative tests.9 Further, reduced amplitude and delayed latency of VERPs have been observed in patients with moderate TBI.10 Often, blast injury is comorbid with other types of injury such as blunt injury. Thus, the effect of the blast injury itself compared with a combination of blunt injury and blast exposure on neurologic dysfunction remains poorly understood.
Recently, chronic visual dysfunction has been documented in Warfighters with TBI caused by exposure to blast waves.5,11–13 For example, Cockerham et al.14 has reported that 20 of 46 patients with blast-mediated injuries had evidence of closed-globe eye injuries, although the visual acuity of most eyes remained normal. Interestingly, the use of protective ballistic eyewear during blast exposure was not related to the extent of the closed-eye injuries, which is suggestive of blast-induced deficits in ocular tissue. Other visual system dysfunctions included photosensitivity, oculomotor difficulties, and binocular vision deficits12,15,16 that have been found to persist up to 1 year postinjury.17 In addition, plasma concentrations of markers of oxidative stress are increased in blast-exposed patients and may have adverse systemic effects.18,19 In spite of growing clinical evidence supporting blast-induced visual dysfunction, a paucity of controlled experimental data precludes a complete understanding of how blast injury has an impact on the structure and function of the retina and optic nerve. The purpose of this study was to characterize the potential retina and optic nerve deficits in a reproducible rodent model of blast injury using both functional and structural analysis measurements.
Methods
Animals
All animal studies were conducted in accordance with the ARVO Statement for the Use of Animals in Ophthalmic and Vision Research and were approved by Iowa State University and the Iowa City Veterans Affairs Institutional Animal Care and Use Committee. Healthy adult male C57BL/6J mice (The Jackson Laboratory, Bar Harbor, ME) at 2, 4, or 8 months of age were exposed to one single blast injury for the purpose of this study. The purpose of using mice of different ages was to evaluate the effect of age on response to blast injury. A total of 145 mice were used in this study.
Blast Injury Induction
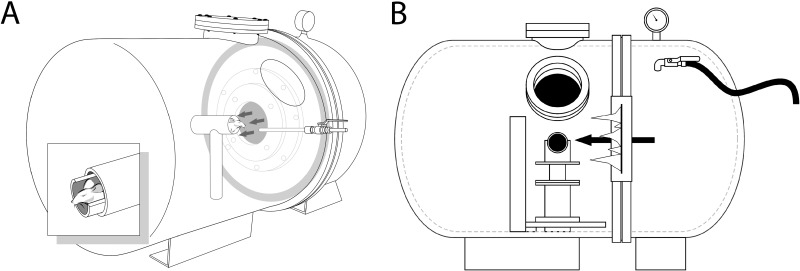
An enclosed blast chamber (50 cm long; 33 cm wide) was constructed using a modified air tank in which one half can be pressurized with a 13-cm opening between the sides of the chamber (Fig. 1). A mylar membrane is be placed over the opening on the pressurized side of the chamber. On the unpressurized side of the tank is a padded polyvinyl chloride (PVC) protective restraint for an anesthetized mouse positioned 30 cm from the opening of the pressurized part of a modified air tank. The head of the mouse is able to move within this system and is not fixed into position. A continuous flow of anesthesia was maintained using a soft flexible nose cone connected through a one-way port in the unpressurized side of the blast chamber. Compressed air was pumped into the pressurized side of the tank containing the mylar membrane and was maintained until the mylar membrane ruptured, which created a blast wave. The plastic mylar membrane (Mylar A, 0.00142 gauge; Country Plastics, Ames, IA) used in these studies ruptured at 20 ± 0.2 psi (137.8 ± 1.3 kPa, mean ± SEM) of compressed air. The energy of the blast wave was propagated from the ruptured membrane to the animal fixed in the padded protective restraint. For blast-wave injury, mice were anesthetized with 0.8 L/min oxygen and 4% halothane in an induction chamber and subsequently positioned within the blast chamber, and oriented with the left side of the head toward the blast membrane with the left eye facing the blast wave (direct exposure) and the right eye facing away from the direction of the blast wave (indirect exposure). To ensure that the primary effect of the blast wave was at the level of the head, only the head of the mouse was exposed to the blast wave, with the rest of the body shielded using a padded PVC chamber. The padding on the holder served to minimize blunt impact trauma of the head against the rigid holder. Immediately following exposure to the blast wave, mice were placed on a heating pad and provided with 100% oxygen to facilitate recovery from general anesthesia and to prevent hypothermia. Control mice used in this study were anesthetized and did not receive a blast exposure. Both blasted and sham-blasted mice received a subcutaneous injection (0.1 mL/20 g body weight) of buprenorphine (0.003 mg/mL) immediately after the blast or sham-blast, respectively.
Figure 1.
A schematic of the blast chamber showing (A) the two halves of the tank closed together. The head of the mouse is untethered and is located in a padded holder ([A], inset). A small port between the two halves of the tank is covered with a mylar membrane and when it ruptures under pressure, a blast wave is generated. The mylar membrane is sealed in place before the pressure is increased in that half of the tank using a locking metal ring shown at the juncture of the two halves in (B). The pressure is increased through a pressure hose (black hose to the right in [B]) and a pressure valve is used to monitor the pressure at which the mylar membrane ruptures. The anesthetized mouse is held securely in a padded animal holder, with the left side of the head facing the blast wave at a distance of 30 cm from the mylar membrane and the rest of the body shielded from the blast wave.
Chromatic Pupil Light Reflex
The chromatic pupil light reflex (cPLR) evaluation was performed (Melan-100 instrument; BioMed Vision Technologies, Ames, IA) as previously described.20 Conscious mice (n = 35) were held still using minimal manual restraint during the recording session, which lasted less than 1 minute. The wavelength and intensity of the diode-based light sources were as follows: 630 ± 3 nm for red light, luminance 200 kcd/m2; 480 ± 3 nm for blue light, luminance 200 kcd/m2. Red light was used to elicit strictly rod–cone-mediated PLR, since red light does not activate the intrinsic retinal ganglion cell (RGC) photopigment melanopsin. Blue light was used to elicit combined responses (rod–cone response + melanopsin intrinsic response). Baseline pupil diameter measurements were taken in darkness prior to illumination using an infrared video camera (Sony Handycam; Sony Corporation, Tokyo, Japan). A red light stimulus with 2-second duration was used to illuminate one eye at a distance of 4 cm from the ocular surface. The direct pupil constriction responses were recorded from the illuminated eye with a digital infrared camera. Prior to performing illumination with the blue light, pupils were allowed to completely dilate to baseline diameter. Captured digital movies of pupil responses were analyzed using a photo-editing system (Adobe Photoshop, v. 10.0.1; Adobe Systems, Inc., San Jose, CA). A calibrated dot grid with dot sizes of 0.5, 1, 1.5, 2, and 3 mm in diameter was recorded from a distance of 4 cm to calculate a regression equation and subsequent calculation of the absolute pupil diameter from the recorded image.
Pattern Evoked Electroretinography
Pattern evoked electroretinography (pERG) was used to objectively measure the function of RGCs by recording the amplitude and latency of the pERG waveform at acute (<24 hours) and chronic time points (>7 days). Mice (n = 79) were initially anesthetized with 3.5% halothane and 0.8 L/min oxygen until unresponsive to the righting reflex. Mice were subsequently maintained using 1.75% halothane, 0.8 L/min oxygen, and 0.4 L/min nitrous oxide for the duration of recording. Mice were placed on a stainless steel recording table equipped with a hot-water–based warming platform to maintain body temperature. Pupils were dilated using a 1% tropicamide solution. Mice were positioned 20 cm from the stimulus monitor with the head tilted 45° to provide direct exposure of the stimulus normal to the visual axis of the recorded eye. The recordings were obtained from the eye facing the blast wave (direct injury) or the eye facing away from the blast wave (indirect injury) as indicated. Pattern ERG responses were evoked using alternating, reversing, black and white vertical stimuli delivered on a monitor with an electroretinogram system (Roland Consult, Brandenburg, Germany). To record the pERG response, commercially available mouse corneal gold ring electrodes were used (S&V Technologies AG, Hennigsdorf, Germany). A reference needle electrode was placed at the base of the head, and a ground electrode was placed at the base of the tail to complete the circuit. Each animal was placed at the same fixed position in front of the monitor to prevent recording variability due to animal placement. Stimuli (9° radius visual angle subtended on full field pattern, two reversals per second, 200 averaged signals with cutoff filter frequencies of 1–30 Hz, 98% contrast, 80 cd/m2 average monitor illumination intensity) were delivered under mesopic conditions without dark adaptation, to exclude the possible effect of direct photoreceptor-derived evoked responses. A diffuser placed over the pattern on the monitor also did not elicit a measurable evoked potential, further ensuring that the electrical responses were elicited from retinal ganglion cells. The pERG response was evaluated by measuring the amplitude (peak to trough; Supplementary Fig. S1) and implicit time of the waveform.
Full-Field Electroretinography
Mice (n = 17) were dark adapted for 12 hours prior to recording the full-field ERG responses. Baseline ERG responses were compared with ERG responses that were obtained 7 days after blast exposure. Animals were initially anesthetized with 3.5% halothane and 0.8 L/min oxygen until unresponsive to the righting reflex. Animals were subsequently maintained using 1.75% halothane, 0.8 L/min oxygen, and 0.4 L/min nitrous oxide for the duration of recording. Pupils were dilated using 2.5% phenylephrine and 1% tropicamide applied to the cornea. Animals were positioned on a heated stage to maintain body temperature during anesthesia and recording sessions. Ground and reference electrodes were placed subcutaneously in the tail and forehead of the animal, respectively. A gold ring recording electrode (Roland Consult) was placed on each eye in contact with the cornea, and a thin layer of methylcellulose was used to maintain contact between the cornea and electrode and to decrease the recording noise. Following placement of the electrodes, animals were dark adapted for an additional 30 minutes prior to recording. An automated ERG protocol was used to evaluate the electroretinographic parameters. The ERG recordings were performed using the electrophysiologic diagnostic and laser scanning systems (Reti-Port Ganzfeld system; Roland Consult). Scotopic rod responses (illumination 0.22 cd/m2, cutoff frequency 1–300 Hz, n = 8 responses were averaged) were collected first, followed by the scotopic maximum combined response (78 cd/m2, 1–300 Hz, n = 8 responses were averaged), oscillatory potentials (78 cd/m2, 200–500 Hz, n = 8 responses were averaged), photopic cone response (21 cd/m2 rod bleaching background light in combination with 78 cd/m2 stimulation, 1–300 Hz, n = 8 responses were averaged), and the flicker ERG response (78 cd/m2, 1–300 Hz, n = 50 responses were averaged). The ERG responses were subsequently analyzed (RETIport32 software; Roland Consult).
Phenol Red Thread Tear Test
The phenol red thread (PRT) test (zone-Quick; Showa Yakuhin Kako, Tokyo, Japan) was used to analyze tear production in mice (n = 9). The test uses a sterilized PRT that changes color from yellow to red when in contact with tears. With one end bent, the thread was placed onto the palpebral conjunctiva for 30 seconds. The length (mm) of color change from yellow to red on the PRT was recorded from the eye directly exposed to the blast wave. Mice were maintained conscious throughout the length of recording, and they were acclimatized to handling prior to recording, to minimize anxiety. Anesthesia drops were not used for this analysis.
Spectral Domain Optical Coherence Tomography
Spectral domain optical coherence tomography (SD-OCT) analysis was performed 3 months following blast injury on anesthetized mice (exposed to blast wave at 2 months of age, n = 16; exposed to blast wave at 8 months of age, n = 6) using a Spectralis SD-OCT (Heidelberg Engineering, Vista, CA) imaging system coupled with a 25-diopter lens for mouse ocular imaging (Heidelberg Engineering). Mice were anesthetized using a 3% halothane and 0.8 L/min oxygen and placed on a heating pad to maintain body temperature. Pupils were dilated using a 1% tropicamide solution. The cornea was moisturized with a saline solution, which was applied every 20 to 30 seconds. Circular scans positioned approximately 100-μm diameter from the edge of the optic nerve head (Supplementary Fig. S2) were performed to quantify the retinal nerve fiber layer (RNFL) thickness. Circular scans were subsequently analyzed by excluding blood vessels from the RNFL thickness calculation, since blood vessels in rodents are almost completely embedded in the RNFL21 and are included in the automated RNFL measurement routines that are part of the instrument software analysis. An individual masked to the treatment performed the analysis of the SD-OCT scans.
Histopathology and Morphology Analysis of the Retina and Optic Nerve
Blast exposed mice were deeply anesthetized with halothane (4%) and perfused intracardially with ice-cold heparinized saline followed by 4% paraformaldehyde in 0.1 M phosphate buffer. Eye globes were postfixed and embedded in paraffin, and 7-μm-thick sections of the retina were collected onto poly-l-lysine–coated glass slides, and stained with hematoxylin and eosin. Retinal sections were evaluated by an individual masked to the treatment.
Expression of proteins associated with oxidative stress in the retina after blast-mediated injury was examined by immunohistochemistry. Briefly, paraffin-embedded sections of the retina were rehydrated using xylene and decreasing concentrations of ethanol followed by a final rinse with potassium phosphate-buffered solution (KPBS). Heat-mediated antigen retrieval was performed using citrate buffer. Tissue was incubated in a blocking solution containing 0.1% bovine serum albumin (BSA, A9647; Sigma-Aldrich, St. Louis, MO), 0.04% Triton X-100 (Thermo Fisher Scientific, Inc., Rockford, IL), and 5% normal donkey serum (NDS, 017-000-121; Jackson ImmunoResearch, West Grove, PA) in KPBS. Primary antibodies against 4HNE (1:150, ab48506), β-amyloid (1:100, ab2539), and iNOS (1:200, ab15323), all from Abcam (Cambridge, MA), were diluted in blocking solution and incubated overnight at room temperature. Tissue was rinsed with KPBS containing Triton X-100, and incubated with Cy-3–conjugated secondary antibodies for 2 hours. Following rinses, 4′,6-diamidino-2-phenylindole, dilactate (DAPI, 1 μg/ mL, D3571; Sigma-Aldrich) was applied for 30 minutes at room temperature to visualize nuclei. Slides were mounted with an antifade mounting media and sealed. Negative controls were processed in parallel by omission of the primary or secondary antibody. Tissue was examined using a commercial upright microscope system (Leica DM5000B; Leica Microsystems, Wetzlar, Germany). Micrographs were prepared using a commercial photoediting system (Adobe Photoshop and Adobe Illustrator [CS3]; Adobe Systems). Two individuals naïve to the tissue treatment graded the intensity of the antibody staining. Data were pooled and analyzed using Student's t-test.
Quantification of Immunohistochemistry Staining
Four images of the central and peripheral retina were taken for each section using an upright microscope (Leica DM5000B) and a ×40 oil-immersion objective. Central retinal images were obtained within two microscope fields of the optic nerve. Peripheral retinal images were obtained four to six microscope fields away from the optic nerve. The microscope settings for tissue stained with a particular antibody were left consistent to eliminate variation from one sample to the next. An observer masked for the origin of sections (control versus blast-exposed) graded each section on a scale of 0 to 4 (0: no immunoreactivity; 4: extensive immunoreactivity).
Ultrathin sections of optic nerves were examined by electron microscopy. Briefly, optic nerves (dissected 1 mm posterior to the sclera) were postfixed in a solution containing 2% paraformaldehyde–2% glutaraldehyde in 0.1 M phosphate buffer (pH 7.4) and then rinsed in cacodylate buffer, postfixed in 2% osmium tetroxide in cacodylate buffer, dehydrated in alcohol, and embedded in epoxy resin. Cross-sections (1 μm thick) were cut with an ultramicrotome, mounted on glass slides, and stained with 1% toluidine blue.
Statistical Analysis
Results are expressed as mean ± SEM unless otherwise indicated. Statistical comparisons were performed by Student's t-test or one-way ANOVA with Dunnett's multiple comparison test. A value of P < 0.05 was considered significant.
Results
Rodent Model of Blast Exposure
To study the effects of blast exposure on the visual anterior afferent pathway, we generated a novel model of blast-wave injury in which the blast wave is propagated following rupture of a mylar membrane (Fig. 1). Blast injury resulted in a mortality rate of 3% within the first 10 minutes after injury and no incidence of delayed mortality. All surviving animals had a physiologically normal appearance 60 minutes after blast exposure, including normal motility, grooming, and behavior.
Pupil Light Response Is an Acute but Not Chronic Indicator of Blast-Wave Injury
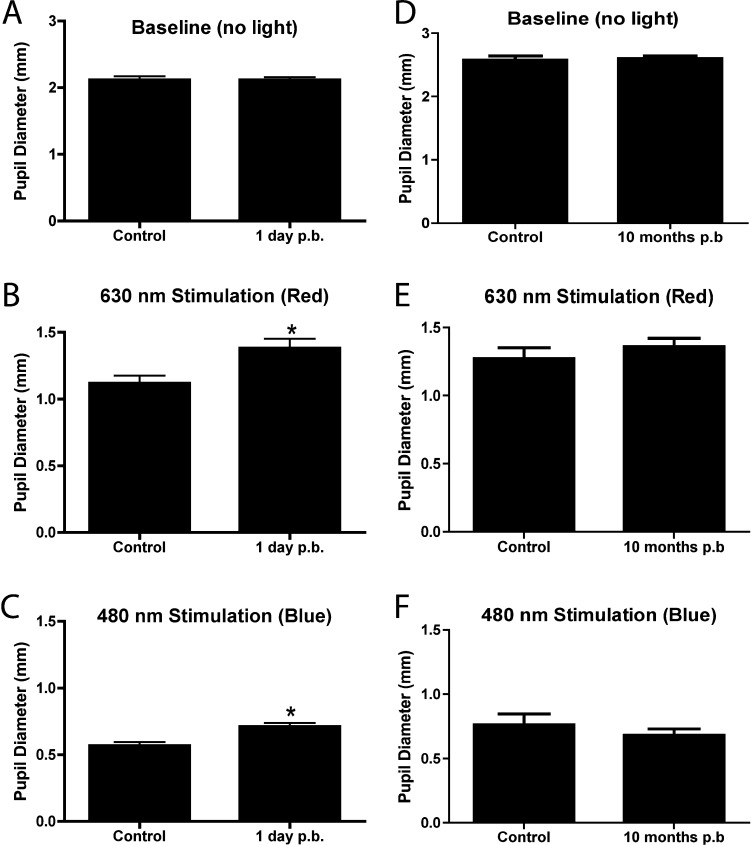
We first examined the effects of blast exposure on the retina and optic nerve 1 day postinjury by determining the chromatic pupil light reflex (cPLR) to red (630 nm wavelength) or blue (480 nm) light. The resting baseline pupil diameter in scotopic conditions was not significantly different between control (n = 9) and blast-injured (n = 12) animals in the eye facing the blast wave (Fig. 2A, ctrl = 2.11 ± 0.05 mm; TBI = 2.11 ± 0.04 mm; P = 0.9914). As expected, the pupil diameter in healthy control mice decreased to 1.12 ± 0.05 and 0.57 ± 0.03 mm after stimulation with red (630 nm) or blue (480 nm) light, respectively. Blast exposure caused a significantly weaker direct pupillary constriction after stimulation with red (Fig. 2B, 1.38 ± 0.07 mm, P = 0.0063, Student's t-test) and blue (Fig. 2C, 0.71 ± 0.03, P = 0.0008, Student's t-test) light compared with healthy control mice, indicative of acute changes in pupil light response following blast injury.
Figure 2.
Chromatic PLR analysis in blast-exposed mice. The pupil direct pupil response from eyes directly exposed to blast was measured after uniocular stimulation with red or blue light. Chromatic PLR analysis of blast exposed mice (n = 12, exposed at 2 months of age) showed significant deficits 24 hours after blast exposure, using the red (630 nm) and blue (480 nm) light compared with age-matched controls (n = 9, [B, C]). Chromatic PLR analysis of blast-exposed mice at 10 months postblast exposure (n = 9) did not show statistically significant difference (630 nm) compared with response obtained from healthy (control) age-matched mice (n = 5) (E, F). There was not a statistically significant difference in the resting pupil diameter of control or blast-exposed mice in scotopic conditions (A, D).
To observe whether the cPLR deficit after blast-wave injury persisted chronically, we tested the response 10 months postblast exposure. The resting baseline pupil diameter in scotopic conditions was similar between age-matched control (n = 5) and blast-injured (n = 9) mice (Fig. 2D, control = 2.5 ± 0.06 mm; 10 months postblast = 2.6 ± 0.04 mm; P = 0.74, Student's t-test). Following stimulation with red (630 nm) or blue (480 nm) light, the pupil diameter in healthy control mice decreased to 1.2 ± 0.07 mm and 0.7 ± 0.08 mm, respectively. In contrast to effect of blast-wave injury on acute cPLR, at 10 months postinjury, the pupillary constriction of blast-exposed mice after stimulation with red (Fig. 2E, 1.3 ± 0.06 mm, P = 0.36, Student's t-test) and blue (Fig. 2F, 0.68 ± 0.04, P = 0.41, Student's t-test) light was not impaired as compared with age-matched healthy control mice.
Tear Production
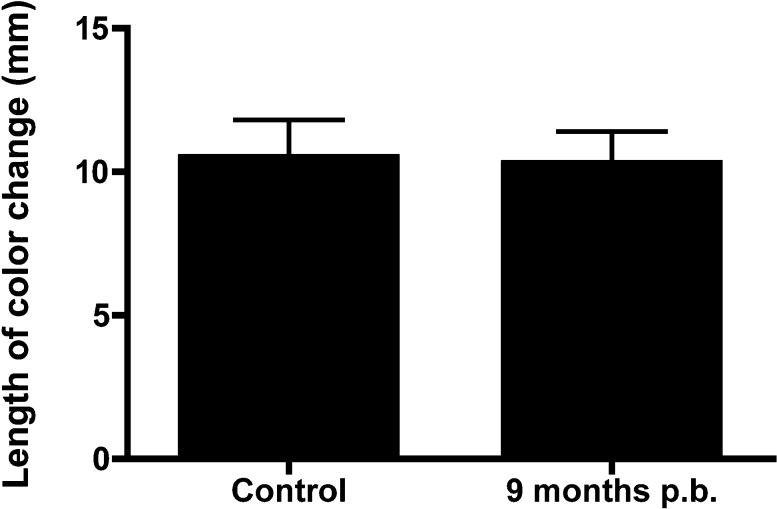
Tear production was tested using the PRT test in blast-exposed mice (mice exposed to blast at 8 months of age and measured 9 months postblast, n = 4) and age-matched healthy control mice (n = 5). The length of color change on the PRT in the eye directly exposed to blast injury in was 10.3 ± 1.1 mm (Fig. 3, mean ± SEM) and 10.5 ± 1.3 mm in healthy controls and blast-exposed mice, respectively. No significant difference was observed between both groups (P = 0.99, Student's t-test).
Figure 3.
Tear production analysis. Tear production was measured 10 months postblast exposure in the eye directly exposed to blast injury. No statistically significant difference was observed in the tear production between blast-exposed mice (exposed at 2 months of age; n = 4) and age-matched controls (n = 5).
Pattern Electroretinography
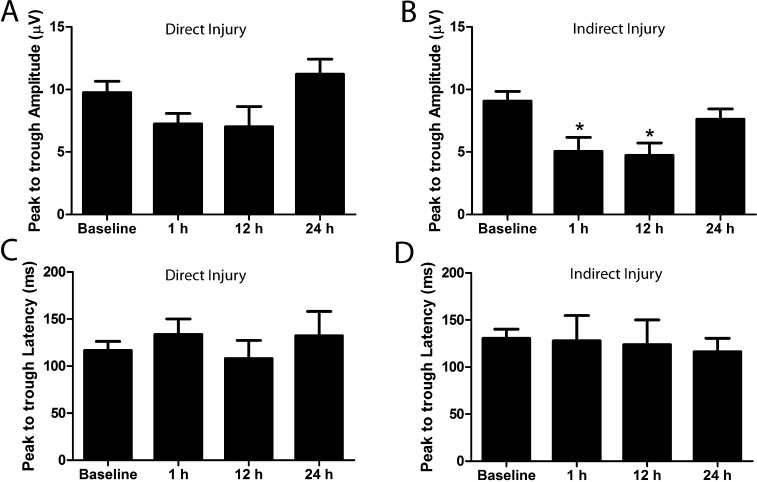
For analysis of the pERG parameters acutely following blast exposure, the baseline pERG response amplitudes and latencies from all mice (n = 30) were recorded at least 2 days prior to blast exposure (Fig. 3). Animals were euthanized at each time point after pERG recording and tissue was collected for histologic analysis. The prerecorded baseline peak to trough amplitude for right and left eyes was 9 ± 0.78 and 9.7 ± 0.9 μV, respectively (Figs. 4A, 4B; mean ± SEM). Following blast exposure, pERGs were recorded at 1 hour and 12 and 24 hours postinjury. A statistically significant reduction was observed in the peak to trough amplitude from right eyes (facing away from the direction of the pressure wave; indirect exposure) at 1 hour (n = 6; 5 ± 1.11 μV, P = 0.0039, Student's t-test) and 12 hours (n = 5; 4.7 ± 0.9 μV, P = 0.0029, Student's t-test) postinjury, when compared with baseline values (Fig. 4A). However, this recovered to the baseline amplitude values at 24 hours (n = 5; 7.6 ± 0.8 μV, P = 0.4245, Student's t-test) after injury (Fig. 4A). The peak to trough amplitude from left eyes (facing the direction of the pressure wave; direct exposure), as shown in Figure 4B, was 7.2 ± 0.8 μV at 1 hour (n = 5; P = 0.1259, Student's t-test), 7 ± 1.6 μV at 12 hours (n = 4; P = 0.1057, Student's t-test), and 11.2 ± 1.2 μV, at 24 hours (n = 5; P = 0.3468, Student's t-test), and the changes from baseline were not statistically significant.
Figure 4.
Acute pERG deficits following blast injury. pERG was recorded at 1 hour, 12 hours, and 24 hours postblast in mice exposed to blast injury at 2 months of age. Significant deficits in the peak to trough amplitude were observed in the right eyes (indirect exposure) at 1 hour (n = 6; P = 0.0039, Student's t-test) and 12 hours (n = 5; P = 0.0029, Student's t-test) compared with baseline parameters that recovered by 24 hours (n = 5; P = 0.4245, Student's t-test) postinjury (A). No significant change was observed in the peak to trough amplitude from left eyes (direct exposure) from baseline parameters (1 hour: n = 5, P = 0.1259; 12 hours: n = 4, P = 0.1057; 24 hours: n = 5, P = 0.3468, Student's t-test) (B). No significant changes from baseline were observed in the peak to trough latency from right eyes (1 hour: n = 6, P = 0.6; 12 hours: n = 5, P = 0.5; 24 hours: n = 5, P = 0.5, Student's t-test) (C). No significant changes from baseline were observed in the peak to trough latency from left eyes (1 hour: n = 6, P = 0.3; 12 hours: n = 4, P = 0.7; 24 hours: n = 5, P = 0.5, Student's t-test) (D).
The baseline peak to trough latency for right and left eyes was 130.6 ± 9.7 and 116.5 ± 9.6 ms, respectively (Figs. 4C, 4D, mean ± SEM). The peak to trough latency from right eyes was 127. 8 ± 26.96 ms (n = 6; P = 0.6, Student's t-test), 123.8 ± 26.29 ms (n = 5; P = 0.5, Student's t-test), and 116.2 ± 14.46 ms (n = 5; P = 0.5, Student's t-test) at 1 hour and 12 and 24 hours after injury, respectively, and the change from baseline latency was not significantly different (Fig. 4C). Similarly, for left eyes, the peak to trough latency was 133.7 ± 16.47 ms (n = 6; P = 0.3, Student's t-test), 108 ± 19.24 ms (n = 4; P = 0.7, Student's t-test), and 132.2 ± 25.84 ms (n = 5; P = 0.5, Student's t-test) at 1 hour and 12 and 24 hours after injury, respectively, which did not vary significantly from baseline values (Fig. 4D).
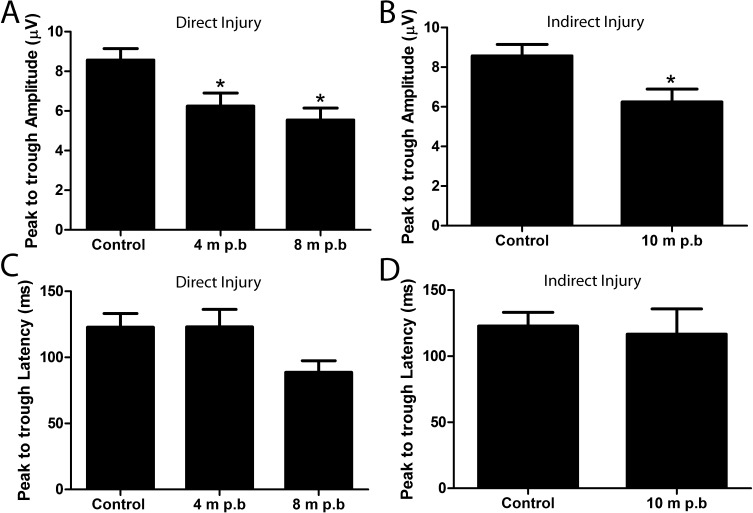
To observe whether blast exposure has a different effect on older animals, mice were exposed to blast at different ages (2, 4, and 8 months of age) and the pERG response from these mice was recorded at 1 year of age (Fig. 5). Mice were exposed to blast at 2 months (n = 9), 4 months (n = 9), or 8 months (n = 11) of age, with pERG responses measured at 10, 8, or 4 months postblast exposure, respectively. Healthy 1-year-old control mice had a peak to trough amplitude of 8.5 ± 0.5 μV (n = 20; mean ± SEM). The peak to trough amplitudes from left eyes (facing blast pressure wave; direct exposure) of the 1-year-old blast-exposed mice (4 months postblast, 6.2 ± 0.6 μV; 8 months postblast, 5.5 ± 0.6 μV) were significantly reduced when compared with age-matched controls (Fig. 5A; P = 0.0017, ANOVA with Dunnett's multiple comparison test). Similarly, the peak to trough amplitude from right eyes facing away from the blast pressure wave (10 months postblast, 6.2 ± 0.6 μV) was significantly reduced compared with age-matched controls (Fig. 5B; P = 0.0138, Student's t-test).
Figure 5.
Chronic pERG deficits occur following blast injury, regardless of the age of the animal when injury was induced. Two-month-old mice (n = 9), 4-month-old mice (n = 9), and 8-month-old mice (n = 11) were exposed to the identical blast injury and their pERG function was evaluated at 1 year of age, with a goal of evaluating possible age related susceptibility to the optic nerve damage. A significant reduction of the peak to trough amplitude (A, B) was observed in all groups of blast exposed mice at 1 year of age when compared with age-matched controls. This includes eyes directly exposed (A) and indirectly exposed (B) to the blast wave. The deficit at this time point occurred regardless of the age at which they were subjected to the blast injury. No significant deficits were observed in the peak to trough latency (C, D).
The peak to trough latency in healthy 1-year-old control mice was 122.9 ± 10.3 ms (n = 20; mean ± SEM). The peak to trough latency from left eyes (direct exposure to pressure blast) of 1-year-old blast-exposed mice (4 months postblast, n = 11, 123.1 ± 13.2 ms; 8 months postblast, n = 9, 88.6 ± 8.8 ms) were not significantly different from age-matched controls (Fig. 5C; P = 0.14, ANOVA with Dunnett's multiple comparison test). Similarly, the peak to trough latency from right eyes (indirect exposure to pressure blast) of 1-year-old blast-exposed mice (10 months postblast, n = 10, 116.7 ± 19.1 ms) did not vary significantly from baseline values (Fig. 5D; P = 0.5, Student's t-test).
Full-Field ERG
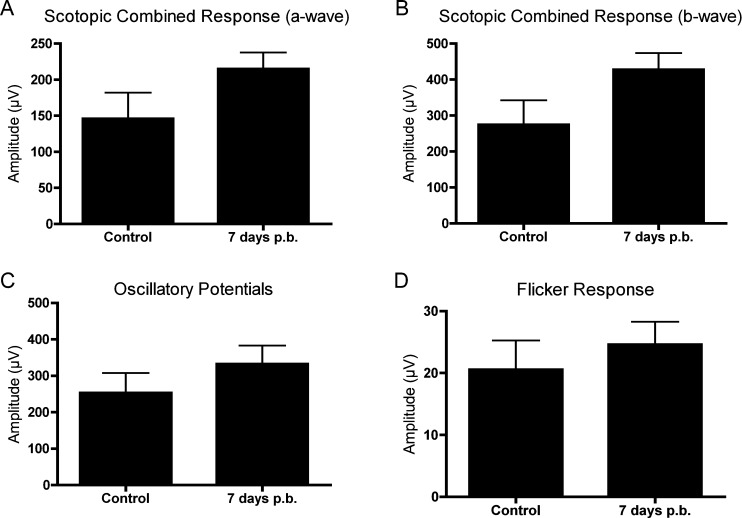
The baseline amplitudes of healthy control mice (n = 7) were 146.0 ± 35.95 μV for the scotopic maximum combined a-wave, 274.5 ± 67.31 μV for the scotopic maximum combined b-wave, 253.2 ± 54.42 μV oscillatory potential summation, and 20.57 ± 4.69 μV for the flicker response (P1–N3 amplitude) (Fig. 6). There was not a significant difference in the full-field ERG response 7 days after blast exposure (n = 10) for the scotopic maximum combined a-wave (Fig. 6A; 214.9 ± 22.68 μV, P = 0.1088, Student's t-test) or b-wave (Fig. 6B; 427.4 ± 45.60 μV, P = 0.0694, Student's t-test). Additionally, we did not detect significant differences in the oscillatory potentials (Fig. 6C; 332.7 ± 49.83 μV, P = 0.3060, Student's t-test) or P1–N3 flicker response amplitude (Fig. 6D; 24.62 ± 3.64 μV, P = 0.5000, Student's t-test) 7 days after injury.
Figure 6.
Full-field ERG responses are not affected by blast exposure. At 7 days postblast (mice exposed to blast were 2 months of age and eyes were facing away from the blast; n = 10), no significant difference was observed in the maximum combined scotopic ERG a-wave (A) and b-wave (B), when compared with age-matched control mice (n = 7). Additionally, there was no significant difference in the amplitudes of the summated oscillatory potential component (C) and P1–N3 flicker response (D) between control and blast-exposed mice.
Optical Coherence Tomography
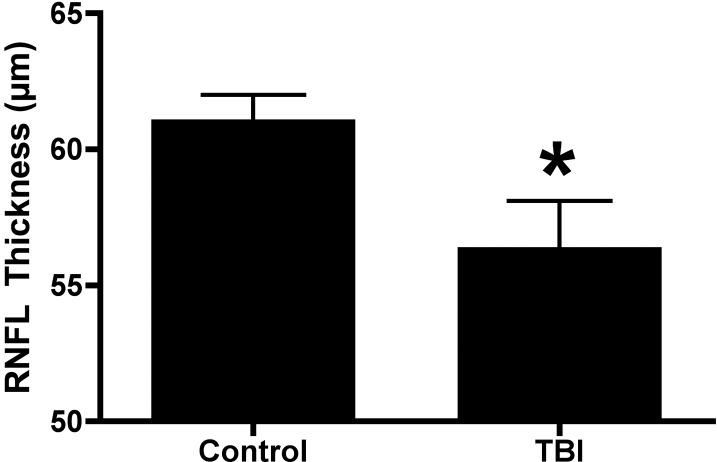
Optical coherence tomography (OCT) was used to analyze the thickness of the retinal nerve fiber layer (RNFL) from the superior-temporal region of the peripapillary retina (Fig. 7). Age-matched healthy control mice (n = 11) were compared with mice that were 3 months postblast exposure (exposed to blast injury at 2 months of age, n = 5). The RNFL thickness in control mice was 61.1 ± 0.9 μm (mean ± SEM). Three months after blast exposure, there was a significant decrease in the RNFL thickness (56.4 ± 1.7 μm, P = 0.0217, Student's t-test) in eyes exposed to direct blast injury when compared with control. Mice that were exposed to a blast wave at 8 months of age and recorded 8 months postinjury did not have a significant change in the RNFL thickness compared with baseline recordings (n = 6, prerecording = 48.9 ± 1.7 μm; postblast = 47.7 ± 2.8 μm; P = 0.57).
Figure 7.
OCT analysis following blast exposure showed mild but statistically significant loss in the peripapillary RNFL thickness (superior-temporal quadrant) in mice exposed to blast at 2 months of age and recorded 3 months later (3 months postblast) in the eye facing the blast wave; (n = 5) when compared with the age-matched controls (n = 11). There was no statistically significant difference in the RNFL thickness for all other peripapillary quadrants, total retinal thickness, or RNFL thickness in the area centralis region. Recordings were performed 3 months postblast exposure.
Histologic Analysis of the Retina and Optic Nerve
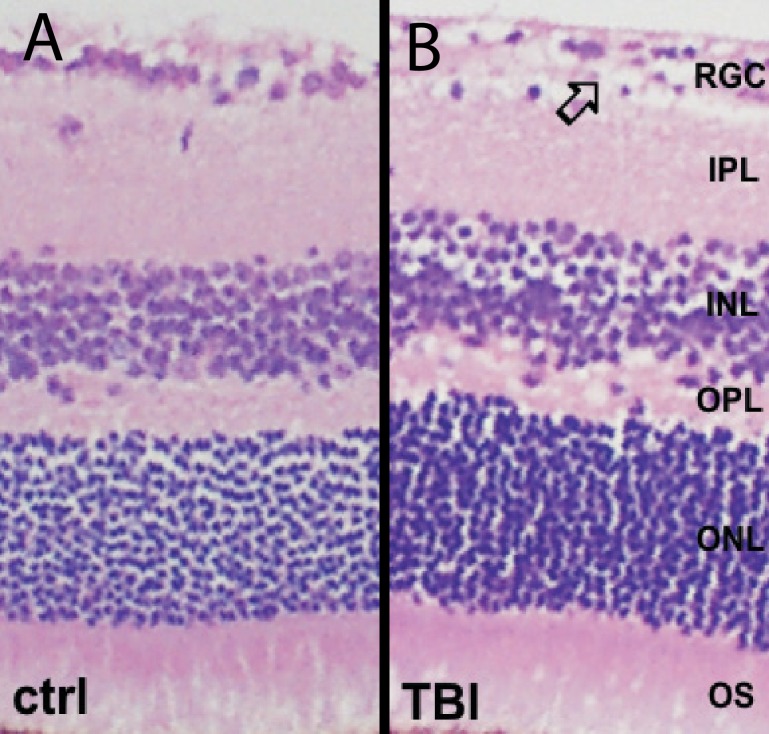
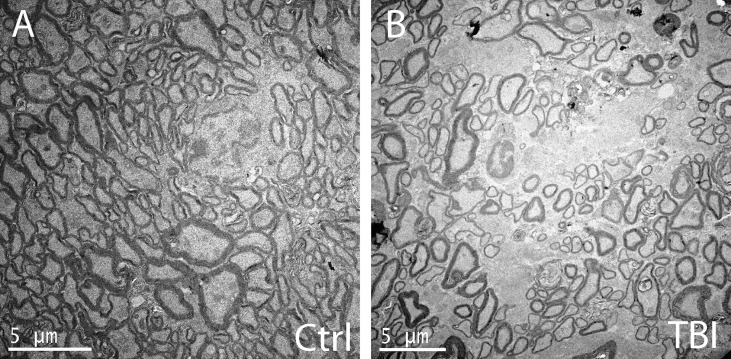
Pathologic analysis of the retina demonstrated normal retina and optic nerve structure and absence of inflammatory changes in majority of evaluated eyes. A minimal reduction in cellularity in the retinal ganglion cell layer was observed following blast injury when compared with healthy control mice (Fig. 8). Analysis of optic nerve using electron microscopy revealed predominantly normal structural features, with sporadic regions within the samples having decreased axon density and glial scarring 10 months after blast injury (when exposed to blast injury at 2 months of age, indirect blast exposure; Fig. 9).
Figure 8.
Histologic evaluation of the retina from control (A) and blast-injured (B) mice show near normal appearance. A focal reduction in cellularity of the retinal ganglion cell layer was observed 10 months after blast injury in the eye receiving indirect blast injury, whereas all other retinal layers had a normal appearance in mice exposed to blast injury at 2 months of age.
Figure 9.
Electron microscopy of the optic nerve in healthy control mice demonstrates normal axonal appearance (A). Electron microscopy of the optic nerves of a mouse chronically after blast exposure (10 months postblast, exposed to blast at 2 months of age in the eye receiving indirect blast injury) shows reduced axon density (B).
Immunohistochemistry
Blast injury resulted in an acute upregulation of proteins associated with oxidative stress in eyes exposed to indirect blast injury. Analysis of 4HNE (a marker for oxidative stress and lipid peroxidation) showed increased immunoreactivity in the retina of animals exposed to blast (n = 12) when compared with healthy controls (n = 4) (Fig. 10A; Control: 1.2 × 10⁻⁶ ± 2.5 × 10⁻⁷ [mean ± SEM]; 1 hour after blast exposure: 0.6 ± 0.1; P = 0.04, Student's t-test). Evaluation of iNOS expression showed a trend toward increased immunoreactivity in blast-injured mice (n = 12) when compared with controls (n = 21) (Fig. 10B; control: 0.57 ± 0.16, 1 hour postblast: 0.91 ± 0.19); however, the difference was not statistically significant (P = 0.08, Student's t-test). One hour postblast injury, beta amyloid immunoreactivity was significantly increased in the retina of animals exposed to blast injury (n = 10) when compared with healthy control eyes (n = 20) (Fig. 10C, control: 0.4 ± 0.11, 1 hour postblast: 1.0 ± 0.2, P = 0.03, Student's t-test). However, no statistically significant difference was observed when 12 hours (n = 6) and 24 hours (n = 10) postblast exposure were included in the analysis (12 hours postblast: 0.6 ± 0.2; 24 hours postblast: 0.8 ± 0.2; P = 0.18, one-way ANOVA with Dunnett's multiple comparison test).
Figure 10.
Proteins associated with oxidative stress are increased acutely after blast exposure in mice exposed to blast at 2 months of age. At 1 hour postblast, a significant increase in the expression of 4-Hydroxynonenal (4HNE, P = 0.04) was observed in the retina of blast-exposed mice (n = 4) compared with age-matched controls (n = 12) (A). At 1 hour postblast (n = 12), there was a trend toward an increase in the expression of inducible nitric oxide synthase (iNOS) in blast-exposed animals compared with healthy control mice (n = 21), although this change was not statistically significant (P = 0.08) (B). At 1 hour postblast, retinal expression of beta amyloid in blast-exposed mice (n = 10) was significantly increased (P = 0.03) compared with age-matched controls (n = 20) (C).
Discussion
The primary objective of this study was to examine the effects of a blast-mediated injury on the function and structure of the retina and optic nerve. We studied the direct and indirect effects of blast injury to the eye because direct injury to the eye facing the blast in a rodent may not be equivalent to that in humans, owing to the differences in globe size and orbital configuration. Blast exposure in mice was associated with a significant anterior afferent visual pathway dysfunction, mimicking the visual system damage observed in Warfighters exposed to blast waves. We demonstrated that exposure to a single blast wave was sufficient to result in chronic retina and optic nerve functional deficits in eyes exposed either directly or indirectly to blast exposure. Subsequent histologic analysis showed mild and sporadic retinal ganglion cell injury and axon loss. Noninvasive retinal outcome measures may be useful as surrogates to monitor CNS function in blast-injured Warfighters. We have also identified potential targets for therapeutic intervention, including oxidative stress-associated proteins that may contribute to secondary retina and/or optic nerve damage and dysfunction.
A major finding of our study is the presence of structural and functional damage to the eyes directly and indirectly exposed to the blast wave at chronic time points. These closed-globe injuries most likely result from the impact of the blast wave on the globe (direct injury and indirect injury) or potentially from the impact of the globe on the padded surface of the holder (indirect injury). Closed-globe eye injuries that result in visual system damage and dysfunction have been documented in combat-injured military personnel with TBI after exposure to a blast wave.14 In this study of 46 veterans with traumatic brain injury events, 43% were found to have closed-globe eye injuries. Interestingly, the visual acuity of blast-exposed eyes did not correlate with the presence of closed-globe injuries, suggestive of subtle retina and optic nerve damage away from the fovea that is not apparent symptomatically.14 In addition, the use of ballistic protective eyewear by Warfighters did not correlate with the extent of closed-eye injury, suggesting that the injury to the visual system is a result of the blast wave propagating through, or around, the protective eyewear and interacting with the ocular tissues. Another potential explanation for the observed ocular deficits following blast exposure in humans and in our experimental model is the role of acceleration and deceleration of the untethered head, which may have a large negative impact on the optic nerve, in addition to deformation of the globe as mentioned above. A recent study by Goldstein et al.3 using a shock-tube model of blast-mediated TBI has demonstrated that head acceleration is required for the development of axonal injury in the brain. Based on the similarities of our findings to this study, it is likely that the movement of head is at least partly responsible for the observed RGC and optic nerve deficits.
Mild traumatic brain injuries are often characterized by low mortality rates and subclinical damage. In our model, the mortality rate of mice exposed to a blast wave was 3%, consistent with to a previous study that documented an 8% rate using a similar blast pressure.22 This is in stark contrast to a recently published study that reported a 26% mortality using a primary blast-injury model with a similar pressure as in our model.23 The difference in mortality may be due to the difference in concentration of forces of the blast waves. An important advancement toward identifying the causes of visual dysfunction in blast-injured Warfighters is developing a model that accurately replicates the blast-injury phenotype that is observed in humans.
A hallmark feature of blast injury is axonal damage that results in a phenotype that is similar to diffuse axonal injury and can be quantified using amyloid-precursor protein.24 Diffuse axonal brain damage is difficult to quantify in vivo, and this subtle damage is not amenable to detection using standard MRI techniques, similar to injuries in blast-injured Warfighters.25 The objective retinal outcomes used in our study may be useful to detect such subtle axonal damage.
The pERG is often abnormal in patients with vision impairment due to damage and dysfunction of the retina and optic nerve, which develops progressively over a period of years.26 An advantage of using a mouse model of traumatic brain injury is the ability to longitudinally monitor the chronic degeneration over a shorter time scale. Although waveform abnormalities in the pattern visual evoked cortical potential have been reported,5 no previous studies have examined the anterior afferent visual responses in subjects with blast-mediated mild TBI. A major finding of our study is the identification of both acute and chronic deficits in the pERG response in mice following blast exposure. These data are consistent with a retrospective study that reported a strong correlation between blast injury and visual disorders among veterans 1 year postinjury.17 We observed a biphasic loss of pERG response that consisted of an acute decline in the pERG function followed by a transient recovery period. A further pERG decline was observed by 4 months postinjury in our model. Although we do not know the underlying molecular pathways that contribute to this dysfunction, it is likely that the pERG deficit results from retinal ganglion cell and optic nerve damage. In fact, pERG deficits have been reported in other animal models of diseases that affect RGCs. The pERG waveform can be diminished by cataract formation, which can occur as a result of dry eye conditions and even transiently during the recording, but we did not observe evidence for cataract formation and tear formation was normal after blast exposure. Further analysis of the electrophysiologic parameters of the retina using full-field flash ERG did not reveal any significant changes in the response amplitude compared to baseline values. In general, the lack of effect of this TBI model on the full-field flash ERG responses is most likely consistent with damage to the inner retina.
Our data reveal that the chromatic PLR can temporarily detect significant deficits in the pupil constriction parameters immediately following blast exposure. We have previously reported that chromatic PLR can differentiate outer from inner retinal dysfunction in patients that is not evident with standard PLR testing.27 One day following blast injury in mice, there was significant impairment in pupillary constriction in response to either red or blue light, which, taken with pERG analysis, indicates significant acute inner retina and/or optic nerve deficits. However, the chronic pupil response was normal in eyes directly exposed to blast injury. Thus, analysis of the chromatic PLR may provide a useful tool for rapid screening of military personnel with suspected acute blast-induced retina and/or optic nerve damage.
A recent study using the fluid percussion model of TBI has demonstrated that the prechiasmatic region of the optic nerve is highly susceptible to traumatic axonal injury and occurs rapidly after injury.28 Interestingly, cell body loss does not correlate with axonal degeneration observed with blast injury,29 further suggesting that axon degeneration is the primary contributor to the pathology following blast injury in our model at the time points studied. Indeed, we have now identified structural deficits in the RNFL axons in the superior-temporal peripapillary region using SD-OCT 3 months postinjury in young animals exposed to the blast; further, the histologic abnormalities were localized to the ganglion cell layer and the optic nerve. These data may be suggestive of axonal degeneration and damage as the primary factor for neuronal impairment following blast-wave exposure. One surprising finding of our study was the lack of RNFL loss in mice exposed to blast injury at 8 months of age compared with age-matched controls. We do not yet understand the underlying mechanism that seems to protect the structure of these eyes. One potential simplistic explanation is that the process of aging results in a preconditioning of the retina and/or optic nerve that allows it to better cope with injury compared with younger subjects. Another explanation is the fact that the normal aging process has reduced the sensitivity of the test and has masked the effect of the blast injury because of a decrease in the RNFL of control animals.
An increase in β-amyloid immunoreactivity is characteristic of axonal injury and has been observed in patients with mild brain injury.30,31 Acutely after mild TBI, we observed increased β-amyloid immunoreactivity in the entire retina of eyes exposed to direct blast injury that attenuated over time. In addition, we observed a significant increase in immunoreactivity of the lipid peroxidation product 4-hydroxy-trans-2-nonenal (4HNE) at 1 hour postblast exposure and a trend toward increased inducible nitric oxide synthase (iNOS) expression at 1 hour postblast. These data are in accord with previous studies that plasma markers of oxidative stress are upregulated following blast exposure in human patients.18,19,32 Taken together these results suggest increased oxidative stress in the retina acutely following blast exposure. Identification of the molecular mechanisms underlying such early oxidative stress and their potential contribution to observed chronic deficits could generate targets for early therapeutic intervention.
In conclusion, although the acute symptoms of blast injury typically resolve rapidly, chronic neurologic dysfunction may manifest months to years after the initial injury. In this study, we report a murine model of blast-wave injury with acute and chronic visual pathway damage. Utilizing noninvasive tests, we observed chronic optic nerve/inner retina dysfunction following exposure to a single blast wave, accompanied by mild structural abnormalities in the ganglion cell layer, retinal nerve fiber layer, and the optic nerve. Utilization of noninvasive analyses of visual function may allow for better identification of individuals with TBIs.
Acknowledgments
The authors thank Kristina W. Thiel for assistance in manuscript preparation and Iowa State University scholars Stephanie Larson and Lisa Noble for helping with the histology preparation.
Supported by the Department of Veterans Affairs; Veterans Health Administration; Office of Research and Development; Rehabilitation Research and Development Center for Prevention and Treatment of Visual Loss; a Rehabilitation Research and Development Career Development Award (MMH); an RRD Merit Study Award (1I01RX000427-01); Iowa State University T32 National Institutes of Health Fellowship awards; and The Iowa State University Biotechnology Fund. The authors alone are responsible for the content and writing of the paper.
Disclosure: K. Mohan, None; H. Kecova, None; E. Hernandez-Merino, None; R.H. Kardon, None; M.M. Harper, None
References
- 1. State of the Art (SOTA) Conferences, U.S. Department of Veterans Affairs State of the Art IX: Traumatic Brain Injury Research. April 30–May 2, 2008; Washington, DC. [Google Scholar]
- 2. Defense and Veterans Brain Injury Center Working Group on the Acute Management of Mild Traumatic Brain Injury in Military Operational Settings: Clinical Practice Guideline and Recommendations. Available at: http://www.pdhealth.mil/downloads/clinical_practice_guideline_recommendations.pdf. Published December 22, 2006. Accessed June 1, 2012. [Google Scholar]
- 3. Goldstein LE, Fisher AM, Tagge CA, et al. Chronic traumatic encephalopathy in blast-exposed military veterans and a blast neurotrauma mouse model. Sci Transl Med. 2012; 4:134ra160. [DOI] [PMC free article] [PubMed] [Google Scholar]
- 4. Gaetz M, Weinberg H. Electrophysiological indices of persistent post-concussion symptoms. Brain Inj. 2000; 14: 815–832. [DOI] [PubMed] [Google Scholar]
- 5. Freed S, Hellerstein LF. Visual electrodiagnostic findings in mild traumatic brain injury. Brain Inj. 1997; 11: 25–36. [DOI] [PubMed] [Google Scholar]
- 6. Lew HL, Dikmen S, Slimp J, et al. Use of somatosensory-evoked potentials and cognitive event-related potentials in predicting outcomes of patients with severe traumatic brain injury. Am J Phys Med Rehabil. 2003; 82: 53–61; quiz 62–54, 80. [DOI] [PubMed] [Google Scholar]
- 7. Lew HL, Lee EH, Pan SS, Date ES. Electrophysiologic abnormalities of auditory and visual information processing in patients with traumatic brain injury. Am J Phys Med Rehabil. 2004; 83: 428–433. [DOI] [PubMed] [Google Scholar]
- 8. Rappaport M, Hemmerle AV, Rappaport ML. Intermediate and long latency SEPs in relation to clinical disability in traumatic brain injury patients. Clin Electroencephalogr. 1990; 21: 188–191. [DOI] [PubMed] [Google Scholar]
- 9. Lachapelle J, Bolduc-Teasdale J, Ptito A, McKerral M. Deficits in complex visual information processing after mild TBI: electrophysiological markers and vocational outcome prognosis. Brain Inj. 2008; 22: 265–274. [DOI] [PubMed] [Google Scholar]
- 10. Lew HL, Poole JH, Chiang JY, Lee EH, Date ES, Warden D. Event-related potential in facial affect recognition: potential clinical utility in patients with traumatic brain injury. J Rehabil Res Dev. 2005; 42: 29–34. [DOI] [PubMed] [Google Scholar]
- 11. Du T, Ciuffreda KJ, Kapoor N. Elevated dark adaptation thresholds in traumatic brain injury. Brain Inj. 2005; 19: 1125–1138. [DOI] [PubMed] [Google Scholar]
- 12. Lew HL, Poole JH, Vanderploeg RD, et al. Program development and defining characteristics of returning military in a VA Polytrauma Network Site. J Rehabil Res Dev. 2007; 44: 1027–1034. [PubMed] [Google Scholar]
- 13. Green W, Ciuffreda KJ, Thiagarajan P, Szymanowicz D, Ludlam DP, Kapoor N. Accommodation in mild traumatic brain injury. J Rehabil Res Dev. 2010; 47: 183–199. [DOI] [PubMed] [Google Scholar]
- 14. Cockerham GC, Rice TA, Hewes EH, et al. Closed-eye ocular injuries in the Iraq and Afghanistan wars. N Engl J Med. 2011; 364: 2172–2173. [DOI] [PubMed] [Google Scholar]
- 15. Goodrich GL, Kirby J, Cockerham G, Ingalla SP, Lew HL. Visual function in patients of a polytrauma rehabilitation center: a descriptive study. J Rehabil Res Dev. 2007; 44: 929–936. [DOI] [PubMed] [Google Scholar]
- 16. Cockerham GC, Goodrich GL, Weichel ED, et al. Eye and visual function in traumatic brain injury. J Rehabil Res Dev. 2009; 46: 811–818. [DOI] [PubMed] [Google Scholar]
- 17. Dougherty AL, MacGregor AJ, Han PP, Heltemes KJ, Galarneau MR. Visual dysfunction following blast-related traumatic brain injury from the battlefield. Brain Inj. 2011; 25: 8–13. [DOI] [PubMed] [Google Scholar]
- 18. Cernak I, Savic VJ, Kotur J, Prokic V, Veljovic M, Grbovic D. Characterization of plasma magnesium concentration and oxidative stress following graded traumatic brain injury in humans. J Neurotrauma. 2000; 17: 53–68. [DOI] [PubMed] [Google Scholar]
- 19. Zunic G, Romic P, Vueljic M, Jovanikic O. Very early increase in nitric oxide formation and oxidative cell damage associated with the reduction of tissue oxygenation is a trait of blast casualties. Vojnosanit Pregl. 2005; 62: 273–280. [DOI] [PubMed] [Google Scholar]
- 20. Mohan K, Harper MM, Kecova H, et al. Characterization of structure and function of the mouse retina using pattern electroretinography, pupil light reflex, and optical coherence tomography. Vet Ophthalmol. 2012; 15 (suppl 2): 94–104. [DOI] [PubMed] [Google Scholar]
- 21. Connolly SE, Hores TA, Smith LE, D'Amore PA. Characterization of vascular development in the mouse retina. Microvasc Res. 1988; 36: 275–290. [DOI] [PubMed] [Google Scholar]
- 22. Kretschmer WB, Baciut G, Baciut M, Zoder W, Wangerin K. Transverse stability of 3-piece Le Fort I osteotomies. J Oral Maxillofac Surg. 2011; 69: 861–869. [DOI] [PubMed] [Google Scholar]
- 23. Hines-Beard J, Marchetta J, Gordon S, Chaum E, Geisert EE, Rex TS. A mouse model of ocular blast injury that induces closed globe anterior and posterior pole damage. Exp Eye Res. 2012; 99: 63–70. [DOI] [PMC free article] [PubMed] [Google Scholar]
- 24. Kuehn R, Simard PF, Driscoll I, et al. Rodent model of direct cranial blast injury. J Neurotrauma. 2011; 28: 2155–2169. [DOI] [PubMed] [Google Scholar]
- 25. Risling M. Evaluation of diffuse blastwave induced brain injury with magnetic resonance imaging. FOI-R--0756--SE Stockholm: Swedish Defence Research Agency; 2002: 1–7. [Google Scholar]
- 26. Bach M, Unsoeld AS, Philippin H, et al. Pattern ERG as an early glaucoma indicator in ocular hypertension: a long-term, prospective study. Invest Ophthalmol Vis Sci. 2006; 47: 4881–4887. [DOI] [PubMed] [Google Scholar]
- 27. Kardon R, Anderson SC, Damarjian TG, Grace EM, Stone E, Kawasaki A. Chromatic pupillometry in patients with retinitis pigmentosa. Ophthalmology. 2011; 118: 376–381. [DOI] [PubMed] [Google Scholar]
- 28. Wang J, Hamm RJ, Povlishock JT. Traumatic axonal injury in the optic nerve: evidence for axonal swelling, disconnection, dieback, and reorganization. J Neurotrauma. 2011; 28: 1185–1198. [DOI] [PMC free article] [PubMed] [Google Scholar]
- 29. Koliatsos VE, Cernak I, Xu L, et al. A mouse model of blast injury to brain: initial pathological, neuropathological, and behavioral characterization. J Neuropathol Exp Neurol. 2011; 70: 399–416. [DOI] [PubMed] [Google Scholar]
- 30. Blumbergs PC, Scott G, Manavis J, Wainwright H, Simpson DA, McLean AJ. Staining of amyloid precursor protein to study axonal damage in mild head injury. Lancet. 1994; 344: 1055–1056. [DOI] [PubMed] [Google Scholar]
- 31. Blumbergs PC, Scott G, Manavis J, Wainwright H, Simpson DA, McLean AJ. Topography of axonal injury as defined by amyloid precursor protein and the sector scoring method in mild and severe closed head injury. J Neurotrauma. 1995; 12: 565–572. [DOI] [PubMed] [Google Scholar]
- 32. DeWitt DS, Prough DS. Blast-induced brain injury and posttraumatic hypotension and hypoxemia. J Neurotrauma. 2009; 26: 877–887. [DOI] [PubMed] [Google Scholar]


